Global Arbitrage Opportunities: Across World ExchangesIntroduction: The Art of Earning from Market Inefficiencies
In the world of finance and trading, arbitrage is often considered the holy grail of risk-free profit-making. It is the art of exploiting price differences of the same asset across different markets or exchanges. Though it sounds simple, global arbitrage requires deep market knowledge, speed, technology, and capital efficiency. As world exchanges become increasingly connected through technology and globalization, arbitrage has evolved from manual calculations to high-frequency trading algorithms that identify even millisecond differences.
In 2025, as global markets face volatility, digitalization, and decentralization, arbitrage remains a powerful strategy for both institutional and individual investors. This article explores how arbitrage works across world exchanges, the types of arbitrage that exist, key global examples, and how traders can spot opportunities amid market inefficiencies.
1. Understanding Arbitrage in Global Markets
Arbitrage occurs when an asset—such as a stock, commodity, currency, or cryptocurrency—is priced differently across two or more markets. Traders simultaneously buy the asset where it’s undervalued and sell it where it’s overvalued, profiting from the price difference.
For example, suppose Apple Inc. (AAPL) trades at $180 on the NASDAQ and $181 on the London Stock Exchange (LSE). A trader could buy Apple shares on NASDAQ and sell them simultaneously on LSE, pocketing the $1 difference per share, excluding transaction costs.
This principle applies across stocks, commodities, currencies, derivatives, and digital assets—making global arbitrage a multidimensional opportunity.
2. The Foundation of Arbitrage: Market Inefficiency
The core of arbitrage lies in the concept of market inefficiency. In an ideal, perfectly efficient market, asset prices should reflect all available information simultaneously. However, due to differences in time zones, regulations, liquidity, exchange rates, and information flow, inefficiencies persist even today.
These inefficiencies give rise to price gaps that can be exploited for profit. High-frequency traders, hedge funds, and institutional investors deploy advanced algorithms that scan global markets in microseconds to identify such discrepancies.
Even with today’s high level of automation, inefficiencies cannot be completely eliminated—creating continuous arbitrage potential worldwide.
3. Major Types of Global Arbitrage Opportunities
Let’s explore the most common and profitable forms of arbitrage that occur across world exchanges:
a. Spatial Arbitrage (Inter-Exchange Arbitrage)
This is the most classic form—buying an asset in one market and selling it in another where the price differs.
Example: Buying gold futures on the London Metal Exchange (LME) and selling them at a higher price on COMEX (New York).
b. Triangular Arbitrage
A strategy used in foreign exchange (forex) markets, where discrepancies between three currency pairs allow traders to profit.
Example: Using USD, EUR, and GBP pairs to exploit minor rate mismatches across exchanges.
c. Statistical Arbitrage
This involves using quantitative models to identify mispriced securities based on historical correlations.
Example: If two global steel companies usually move in tandem, but one lags temporarily, a trader can long one and short the other expecting reversion.
d. Cross-Border Index Arbitrage
Global index futures—like the S&P 500, Nikkei 225, or FTSE 100—often trade differently on international exchanges. Traders exploit these pricing gaps between index futures and their underlying baskets.
e. Commodity Arbitrage
Differences in oil, gold, copper, or agricultural commodity prices across world exchanges (MCX India, CME US, LME UK) often create arbitrage windows due to supply-chain disruptions or currency fluctuations.
f. Crypto Arbitrage
With 24/7 trading and hundreds of exchanges, cryptocurrencies offer one of the richest fields for arbitrage. For instance, Bitcoin might trade at $62,300 on Binance and $62,450 on Coinbase, allowing instant profit.
g. Interest Rate Arbitrage (Covered Interest Arbitrage)
This involves borrowing in a low-interest-rate currency and investing in a higher-yielding currency, hedging the exchange rate risk through forward contracts.
4. Global Markets Where Arbitrage Flourishes
1. United States (NYSE, NASDAQ, CME)
The U.S. markets are highly liquid, making arbitrage opportunities smaller but more frequent.
Example: Arbitrage between S&P 500 futures on CME and ETFs like SPY on NYSE.
2. United Kingdom (LSE)
London’s time zone overlap with both Asia and the U.S. makes it ideal for intercontinental arbitrage. Traders exploit pricing differences in dual-listed companies such as Unilever or HSBC.
3. India (NSE, BSE, MCX)
The Indian exchanges often see arbitrage between cash and futures markets, and also between NSE and BSE due to liquidity differences.
Example: Buying Reliance shares on NSE and selling on BSE if there’s a small price gap.
4. Japan (TSE) and Hong Kong (HKEX)
Arbitrage between Japanese ADRs (listed in the U.S.) and their domestic listings is common. Similarly, the Shanghai-Hong Kong Stock Connect allows price discrepancies between mainland and Hong Kong shares (A-shares and H-shares).
5. Europe (Euronext, Deutsche Börse)
European markets see cross-border arbitrage due to multiple exchanges trading the same blue-chip stocks. For example, Shell Plc trades across several European exchanges.
6. Crypto Exchanges (Binance, Kraken, Coinbase, OKX)
Crypto exchanges are globally fragmented and unregulated compared to traditional markets. This creates consistent arbitrage windows—especially between fiat-to-crypto pairs.
5. Tools and Technology Driving Modern Arbitrage
Global arbitrage today is a technology-driven discipline. Traditional traders are being replaced or assisted by algorithms, bots, and AI-powered systems. Here’s what drives modern arbitrage:
a. Algorithmic Trading
High-frequency algorithms detect and execute trades within microseconds. These algorithms continuously compare prices across exchanges.
b. Cross-Exchange APIs
APIs allow traders to fetch real-time prices and execute simultaneous buy/sell orders across global platforms.
c. Artificial Intelligence & Machine Learning
AI models analyze historical correlations, volatility patterns, and market inefficiencies to predict potential arbitrage zones.
d. Blockchain & Smart Contracts
In crypto markets, smart contracts automate arbitrage transactions—reducing latency and ensuring immediate execution.
e. Cloud-Based Trading Infrastructure
Cloud servers ensure that traders are geographically closer (co-located) to global exchanges, minimizing network delays.
6. Challenges and Risks in Global Arbitrage
While arbitrage is theoretically risk-free, in practice, execution, regulation, and timing risks can eat into profits. Key challenges include:
1. Transaction Costs
Brokerage, taxes, and exchange fees can eliminate small price differences, making trades unprofitable.
2. Execution Delays
Even a few milliseconds of lag between buying and selling can result in losses if prices move unfavorably.
3. Liquidity Risk
Low-volume assets may not allow traders to exit quickly, causing slippage.
4. Exchange Rate Fluctuations
In cross-border trades, currency volatility can erode arbitrage gains.
5. Regulatory Barriers
Some countries restrict cross-border trading or capital movement, making arbitrage legally complex.
6. Competition
Institutional traders and high-frequency funds dominate arbitrage, leaving minimal room for manual traders.
7. Technology Failures
Glitches, internet outages, or API failures can disrupt trades and cause heavy losses.
7. Case Studies: Real-World Arbitrage Scenarios
Case 1: Gold Arbitrage Between London and New York
When gold prices on the London Bullion Market Association (LBMA) were slightly lower than those on the COMEX, traders shipped gold physically or used futures contracts to arbitrage the difference—making steady profits before logistical costs reduced margins.
Case 2: A-Share and H-Share Arbitrage (China)
Companies listed both on the Shanghai Stock Exchange (A-shares) and the Hong Kong Stock Exchange (H-shares) often show price gaps due to investor access restrictions. Institutional traders exploit this through arbitrage using the Stock Connect link.
Case 3: Bitcoin Arbitrage in 2021-2022
During crypto bull markets, Bitcoin often traded at a “premium” in South Korea (the “Kimchi Premium”) compared to global averages. Arbitrageurs moved BTC from U.S. or Japanese exchanges to Korean exchanges for instant gains.
Case 4: ETF and Futures Arbitrage
During high volatility, index futures may deviate from their underlying ETF prices. Arbitrageurs buy the cheaper and sell the expensive instrument until prices converge.
8. The Future of Global Arbitrage: Trends for 2025 and Beyond
As the financial world moves deeper into digitalization, arbitrage is becoming more complex, global, and data-driven. Some emerging trends include:
1. AI-Enhanced Arbitrage
AI algorithms now learn from historical inefficiencies and predict arbitrage windows across correlated assets.
2. Tokenized Assets
With real-world assets being tokenized on blockchain, arbitrage between traditional and digital markets will rise.
3. Multi-Asset Arbitrage
Cross-market opportunities involving stocks, commodities, forex, and crypto will create new strategies.
4. Decentralized Exchanges (DEXs)
On-chain arbitrage between DEXs and centralized exchanges (CEXs) will continue to expand, especially in DeFi ecosystems.
5. Regulatory Harmonization
Efforts by global regulators to integrate financial systems (e.g., Basel norms, MiFID II) may reduce inefficiencies but also make legal cross-border arbitrage safer.
6. Quantum Computing
Quantum algorithms could soon revolutionize arbitrage by processing millions of correlations simultaneously—making inefficiencies vanish almost instantly.
9. How Individual Traders Can Find Arbitrage Opportunities
While institutional players dominate, retail traders can still benefit by focusing on specific niches:
Track price spreads between NSE and BSE for dual-listed stocks.
Monitor crypto exchanges for real-time differences using bots.
Use broker data APIs to automate alerts for arbitrage opportunities.
Combine forex and commodity arbitrage strategies using multi-asset platforms.
Participate in ETF arbitrage where price gaps persist during volatile periods.
With proper tools, discipline, and low transaction costs, individual traders can still find small but consistent profits.
10. Conclusion: Arbitrage—The Silent Engine of Global Market Efficiency
Arbitrage is not just about profit—it plays a vital role in maintaining market balance and price efficiency. By exploiting inefficiencies, arbitrageurs help ensure that identical assets trade at consistent prices worldwide.
In 2025, global arbitrage has evolved into a sophisticated, technology-powered discipline spanning traditional finance, commodities, and digital assets. Despite tighter spreads and fierce competition, opportunities persist for those who understand global linkages, act swiftly, and leverage automation.
In essence, arbitrage is where intelligence meets precision—a strategy that proves markets may be efficient, but never perfectly so.
Trade ideas
Btcusdt - At Crtitical Decision Point, Breakout Or Breakdown Bitcoin is currently sitting at a critical decision point near the 124,120 level after a Break of Structure (BOS) to the downside, following a Change of Character (ChoCH) at the top.
Key Technical Zones:
Support Zone: Price is testing a marked support area, which has previously acted as a demand zone. This zone could trigger a bullish reaction.
Strong Low: If this level breaks, bearish momentum could accelerate.
Weak High: May be targeted if price finds support and reverses.
Decision Point: The current price level acts as a pivot, determining whether the market will:
Bounce and aim for the upper target near 126,013, or
Break down towards the lower target below 121,000.
Scenarios:
Bullish Scenario:
If price holds the support zone and breaks recent BOS highs, the market may rally toward the 126K target.
Bearish Scenario:
A breakdown below the support and the strong low could trigger a move toward the 121K area.
Conclusion:
Monitor the support zone closely. A strong bullish reaction could confirm a long setup toward 126K, while a clean break below the strong low confirms further downside.

[UPDATE] BTC LAST CALL !! Wave 4 Correction in Play?BTC has moved more impulsively than previously anticipated, yet the Elliott Wave structure remains intact. Price action shows a clear rejection from the $126,000 zone marking a new all-time high.
Interestingly, this correction aligns with the full moon phase 🌕, which historically correlates with short-term market reversals. The full moon often triggers emotional shifts and heightened volatility, especially in speculative assets like crypto.
We’re now eyeing a potential Wave 4 cooldown toward the Fibonacci 0.618–0.5 zone ($119K–$120K) before BTC resumes its rally and enters a fresh price discovery phase.
Stay sharp next leg could be explosive. Don't miss the train !

BTC “Blow-off” confirmed, what’s next?Newest chart (H&S with RS near 118.7k, high 124.5k, supports 110.9k / 108.7k / 95.1k / 96.5k / 77.3–74.5k) shows we did get the blow-off extension I had at 13%. We now re-weight the next path conditional on a completed blow-off.
🎯 Short to $73K — plan, gates, and guardrails
It’s feasible only after losing: $110.9K → $108.7K → $103–101K → $96–95K
Risk guardrails (objective invalidations) 🚧
Primary invalidation: Daily close > 118.7K (your RS/supply).
Hard invalidation: Momentum HH > 120.5K and sustained bid above; expect squeeze back to 123–125K.
Trailing logic:
After 110.9K breaks → trail to entry.
After 108.7K breaks → trail to 111.0–111.5K.
After 101K breaks → trail to 105–106K.
After 95K breaks → trail to 99–100K.
Position management 🔧
Scale targets: 108.7K, 103–101K, 96–95K, 90–88K, 83–78K, 75–73K.
What would help the $73K path 📉
Clean acceptance below 95K (no immediate reclaim).
ETF flow cool-off (you’ve been tracking this) + weak spot bid during futures-led dumps.
CME term structure flattening/inversion into breakdowns.
OBV / CVD making lower lows as price ranges (distribution tells).
What would hurt it 📈
Swift 118.7K reclaim on strong spot-led buying.
Persistent positive ETF net inflows on down days.
Perp funding resetting positive while price refuses to break 108.7K.
Aligned with the post–blow-off distribution thesis. Hold the short only as long as 118.7K isn’t reclaimed and the market accepts below 110.9K → 108.7K. The hinge zone is 96–95K; lose it cleanly and $83–78K → $75–73K opens up. Manage via staged profits and a rising trailing stop so the trade can breathe on the way to $73K objective.

,.,...................,.,.,...........Chinese investors and consumers are selling their assets and turning to gold as prices skyrocket. Even wealthy individuals and major investors are following the trend, selling off stocks and moving their money into gold

Want to Trade Like a Pro? This BTC Layer Strategy is Your Answer🚀 Become a Pro Trader: The "Thief" Layer Strategy for BTC/USDT (Bullish Swing Plan) 🚀
Unlock a professional money-making operation! This detailed plan combines a unique entry technique with deep fundamental & sentimental analysis to give you an edge.
📈 Trade Idea: BTC/USDT (Swing / Day Trade)
Bias: Bullish | Timeframe: 4H - 1D
🎯 The "Thief" Layer Entry Strategy
This strategy "steals" good entries at various levels instead of chasing the market.
Entry Method: Multiple Buy Limit Orders (Layering)
Proposed Entry Zones: $111,000 | $111,500 | $112,000 | $112,500
You can add more layers based on your capital and risk appetite.
⛔ Stop Loss (Risk Management)
Hard Stop Loss: $110,000 (Below key support)
⚠️ IMPORTANT NOTE (Thief OG's): This is MY stop loss. You MUST adjust your SL based on your personal risk management strategy. Protect your capital first.
🎯 Take Profit (Exit Strategy)
Primary Target: $116,000 (Strong Resistance + Overbought Zone)
The Plan: Escape with "stolen" profits before any potential trap snaps shut!
⚠️ IMPORTANT NOTE (Thief OG's): This is MY target. You are free to take profit earlier or adjust based on your own analysis. Secure your bags!
🔍 Why This Plan? The "Thief's" Analysis
This trade setup is backed by a confluence of technical, fundamental, and sentimental factors.
📊 Technical & Sentimental Backdrop (As of Sept 9, 2025)
Price Action: BTC showed strength with a +1.52% gain, bouncing from the $111,184 support.
Market Sentiment (Fear & Greed Index): 48/100 (Neutral) 😐. This indicates a balanced market with no extreme fear or greed—often a good base for a move.
Retail vs. Institutional:
Retail Traders: 55% Long (Slightly Bullish) 🤔. Fueled by Fed rate cut expectations.
Institutional Traders: 60% Short (Cautiously Bearish) 🏢. Their selling pressure appears to be exhausting, as shown by declining volume on dips. This creates a contrarian opportunity.
🌍 Fundamental & Macro Tailwinds
The $7.26T Cash Pile: Money market funds are holding a massive $7.26 Trillion. A Fed rate cut could unleash this capital into risk assets like Bitcoin. 🏦
Fed Rate Decision: An expected 25-50 bps cut is highly bullish for crypto, potentially triggering a major rotation.
Strong Bitcoin Fundamentals:
Low Inflation Rate: Only 1.17% (low new supply pressure). ✅
Network Health: Active addresses and settlement volume remain stable (~$12.9B/24h).
Dominance: BTC is outperforming traditional safe havens like gold (+102% YoY vs. gold's +42%).
✅ Overall Outlook Score
Bull (Long) Score: 55/100 → Neutral-Bullish 🐂
Bear (Short) Score: 45/100 → Weak Bearish Pressure 📉
🎯 Final Thief's Outlook: Cautiously optimistic. The layered entry strategy allows us to capitalize on potential upside driven by macro factors while strategically managing risk.
👀 Related Pairs to Watch
BINANCE:ETHUSDT | BINANCE:SOLUSDT | BINANCE:BNBUSDT (Altcoins follow BTC's lead)
TVC:DXY (U.S. Dollar Index) | CBOE:SPX (S&P 500)
✨ “If you find value in my analysis, a 👍 and 🚀 boost is much appreciated — it helps me share more setups with the community!”
#BTC #Bitcoin #Trading #Strategy #LayerStrategy #SwingTrading #Cryptocurrency #TechnicalAnalysis #FundamentalAnalysis #ThiefStrategy


BTCUSD NEXT POSSIBLE MOVEBitcoin is currently testing a key support area after a healthy correction. If price holds above this zone, a bullish rebound can be expected.
Market structure remains positive as long as supports hold — buyers may regain control and push price toward higher levels.
Wait for a bullish confirmation candle before entering to ensure momentum shift in buyers’ favor.

This will shock you, BTCUSDT Cup and Handle on WeeklyJust tested the built-in indicator, it is interesting, on Weekly chart Bitcoin seems that it formed a Cup and Handle Pattern. This could mean 2x from this level lol. Not financial advise, just interesting what the indicator shows as an educational idea.

Nothing Bearish Here – Bitcoin Looks Ready to Expand HigherBTCUSDT – Daily Chart
Bitcoin continues to hold strong in the Stage 2 Accumulation → Expansion phase, with clean bullish structure across the 5, 10, 20 & 50 MAs. The markup leg remains intact — no signs of distribution or exhaustion so far.
If price begins to form a controlled pullback that respects the 5/10/20 MAs, I’ll be watching for new entry opportunities similar to what’s drawn on the chart. As long as these levels hold, BTC looks positioned to continue breaking into new all-time highs over the coming weeks.
Key Points:
• Trend remains firmly bullish — all MAs are cleanly stacked and rising
• Structure supports continuation toward and beyond ATHs
• Watching for a shallow flag / micro-pullback to build continuation setups
• Invalidation only if the daily closes back below the 20 MA
Bias: Bullish continuation
Stage: Accumulation → Expansion (Phase 2)
Questions for you:
• Do you think this trend has enough strength to break all-time highs next?
• How deep do you expect the next pullback to be before continuation?
• Which MA are you watching for confirmation of the next leg?
👇 Drop your thoughts — still long BTC here or waiting for deeper confirmation?

Bitcoin Consolidates Above Support — Main Trend IntactBitcoin (BTC/USDT) — Holding Strong Above Key Support Zones 💪
Bitcoin continues to trade above the low-timeframe support at $122,100, showing resilience and consolidation after its recent upward move.
✅ Low Time Frame Support ($122.1K): BTC remains stable above this short-term structure, suggesting buyers are still in control.
✅ Main Trend Support ($110.2K): The larger bullish structure remains intact as long as price holds above the $110.2K region.
📈 Momentum Outlook: A sustained hold above $122K could set up another push toward $126K–$130K, confirming bullish continuation.
Summary:
BTC remains bullish above both its low-timeframe and main-trend levels. Short-term consolidation is healthy, and the next breakout could target new local highs if momentum strengthens.
🎯 Support: $122.1K / $110.2K
🎯 Resistance: $126K / $130K
📊 Bias: Bullish continuation

Analytics: Market Outlook and Forecasts
📈 WHAT HAPPENED?
Last week, Bitcoin surprised us with its dynamics: despite the US shutdown, the cryptocurrency showed explosive growth. On the one hand, the shutdown is negative for the global market, people have less trust in the government. On the other hand, Bitcoin acts as an independent ecosystem perceived by people as a hedge asset in relation to fiat.
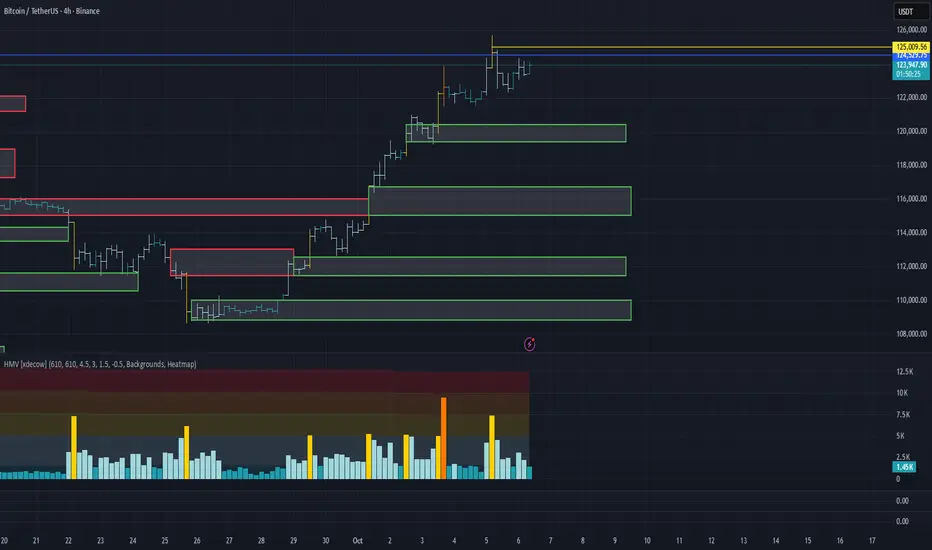
As a result of the massive inflow of liquidity, almost all of the sell zones were broken, with only a few offering resistance. Moreover, the all-time high (ATH) was reached and updated, now standing at $125,700.
💼 WHAT WILL HAPPEN: OR NOT?
The bullish momentum has now slowed down, with a strong absorption of buys. The pricing remains inefficient, increasing the likelihood of a correction.
The key area of attention is $125,000 (cluster anomalies). If there is a reaction from this level, we expect a move towards $120,000, where the nearest buyer activity zone is located.
If there is no reaction and a confident breakout of the current local high, we shift our focus to finding entry points for long trades during corrections.
Buy Zones:
• $120,400–$119,400 (absorption of selling pressure)
• $116,700–$115,000 (pushing volumes, strong chart imbalance)
• $112,500–$111,500 (mirror zone, volume anomalies)
• $110,000–$108,800 (strong absorption of selling pressure)
📰 IMPORTANT DATES
Macroeconomic events this week:
• October 8, Wednesday, 1:00 (UTC) — announcement of the interest rate decision in New Zealand;
• October 8, Wednesday, 19:00 (UTC) — publication of the US FOMC minutes;
• October 9, Thursday, 12:30 (UTC) — speech by US Federal Reserve Chairman Jerome Powell, as well as publication of the number of initial jobless claims in the US;
• October 10, Friday, 12:30 (UTC) — publication of the average hourly wage, unemployment rate, and change in the number of non-agricultural workers in the United States for September.
*This post is not a financial recommendation. Make decisions based on your own experience.
#analytics
Bitcoin Weekly Plan: 125K–129K Targets, Watch 120,250Last week, Bitcoin showed strong growth and updated its ATH. As seen on the chart, the EMA 21 and SMA 50 are acting as support, with the price repeatedly bouncing from them. As long as the price remains above, the priority stays with the green scenario .
If the SMA 50 breaks, the trendline will also be broken, and the price will likely head toward the weekly pivot point at 120,250 , where the SMA 200 is located — a level where we should see a positive reaction and a potential reversal.
Targets for this week: 125K–129K .
If the price fails to hold above the weekly pivot point, support can be found in the 114K–111K range.

Bitcoin (BTC/USD)Bitcoin just broke a new all-time high 🚀
As shown in my pinned analysis, I marked the $111K level and mentioned that investors could also look for entries around $109K.
Today, you can see how that plan played out ✅
I’m not a fortune teller,
I don’t know what the whales are planning,
I don’t memorize Glassnode data —
My only tool is the chart 📊
I’m a swing trader —
Calm, stress-free, and patient.
Hope this analysis helped you too.
🎯 Stay profitable and trade safe.

BTC Breakout Update – Bullish Setup in Play#Bitcoin has been consolidating in a falling wedge pattern – a historically bullish formation. Recently, #BTC has broken out of the wedge, signaling potential momentum shift.
Key Points to Watch:
Wedge breakout already confirmed (bullish sign)
Structure shows LLs & LHs turning – possible trend reversal
Next confirmation needed: break above previous LHs & resistance zone
Only after this breakout can we confidently enter a long trade with proper risk management
Strategy:
I’ll be waiting for a clear breakout + retest of the resistance to position long. Until then, patience is key.
What’s your view – do you think #BTC will continue its breakout and start a strong uptrend, or is this a fake-out before another drop?
Drop your thoughts in the comments & don’t forget to hit like if you found this useful. Follow for more daily #BTC updates & trade ideas!
#BTC #Bitcoin #Crypto #CryptoTrading #BTCUSD #BitcoinAnalysis #BitcoinPrice #CryptoMarket #BTCUpdate #BitcoinTrading #CryptoAnalysis #CryptoSignals #BTCChart #CryptoCommunity #BitcoinBreakout #CryptoTrend #BTCPriceAction #BitcoinTechnicalAnalysis #CryptoIdeas

BTCUSDT - 126K next!!BTC yet ready for another short covering soon as per USDT dom and other things to factor in

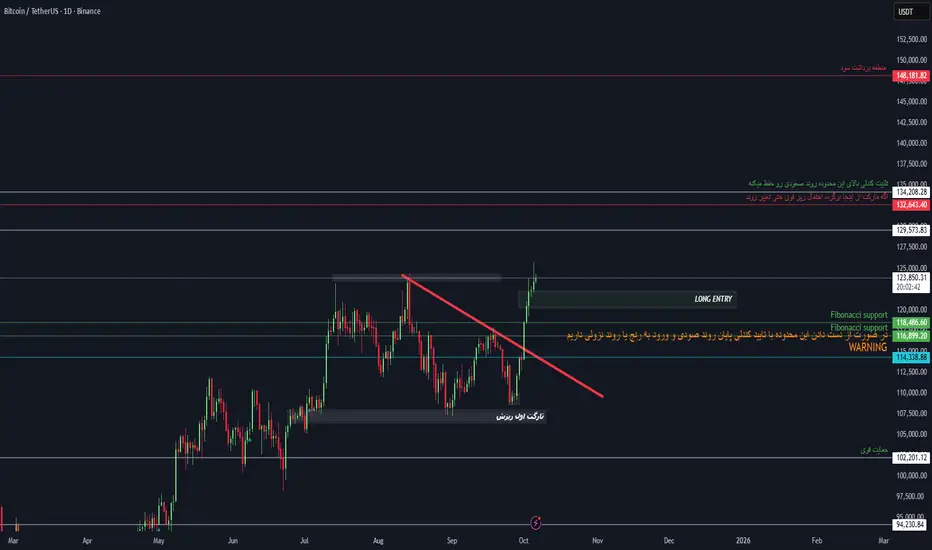
Bitcoin Weekly Analysis – Key Fibonacci & Demand Zone ReactionsThis weekly BTC/USDT chart highlights major Fibonacci support zones and the critical demand levels that have kept Bitcoin’s structure intact during recent corrections.
The chart shows how price reacted strongly to the Fibonacci confluence area around $116K–$118K, confirming it as a powerful support base. The breakout above the local downtrend line signals renewed bullish momentum, with targets at $129K and $132K — where a historical resistance cluster may trigger profit-taking.
Key notes from the chart:
Strong Support Zones: $114K–$118K area marked by Fibonacci and previous demand reaction.
Main Resistance Levels: $129K–$132K region — potential new all-time high zone.
Trend Observation: Price broke the short-term descending resistance line, showing buyers’ dominance returning.
Strong Base: Weekly structure remains bullish as long as $114K holds.
📈 “Respect the zones, follow the structure.”
#BTC #Bitcoin #CryptoAnalysis #TradingView #TechnicalAnalysis #TradeWithMky #Miracle #miracleshot
Bitcoin Btc usdt daily analysis
Time frame daily
Btc reached my target
It reached new high price last night about 125.000 $
I think btc will play in yellow box that you can watch in the chart and let other assets to grow up
Alt party has started

bitcoinbtc usdt daily analyse
time frame 4 hours
risk rewards ratio > 5 woooow
target 123.000 $
btc is in the down side of my critical red box
here is good area to pump
LS is very tight to decrease my probably damage
so I open a long position to win

BITCOIN THE ROOF connecting the two most current highs on 3hr close provided a perfect point of entry and the best rejection for the daily candle.the zone of 124,478-125k was rejected.
i dont know if its possible to return to 116-117k zone ,however should price comes to this zone we have a buy floor ,based on the break and retest rule.
break and close 124,478-125k will expose 135k-145k zone depending on the volatility +liquidity in the market.
dont forget that take profit is on the way for earlier investors, dont let them dump this coin on you.
GOODLUCK
#BTC #BITCOIN

BTCUSDT STILL LONG First time looking AT BTCUSDT.
-The market has now created its ATH. However when we look at the chart on a line format the market hasnt yet created that ATH but it is still in the consolidation highlighted.
-Normally when the market breaks & creates a new high it indicates selling opportunities.
-This means that the which could be a liquidity sweep & could continue to sell for it to buy at a way lower point.
w/that been said...
-THE MARKET ON A 1H TF HAS CREATED A RETESTED & ALSO BROKEN THAT STRUCTURE WITH A LOW WHICH IS A POINT OF ENTRY FOR THIS SHORT BUY.
-i WILL RIDE THE MARKET & KEEP TRAILING MY STOP LOSS AS I DO BELIEVE THAT MY CHANCES OF THE TRADE GOING MY WAY ARE HIGHER AS IM NOT TRADING AGAINST THE MARKETS OVERALL DIRECTION.
-Lets see...

Bitcoin (BTC) Hits New Highs, Analyzing Future ScenariosBINANCE:BTCUSDT
Bitcoin (BTC) hit a new all-time high today, once again encountering resistance at a long-term slant, extending from the 2017 and April 2021 highs. Since then, a correction of approximately 2% has occurred, forming a long upper shadow on the daily chart. Notably, this trend is displaying a fractal pattern similar to the July 14th peak. If today's daily chart closes with a long upper shadow, it could lead to a short-term sideways or correction phase. Conversely, if it closes with a negative candlestick, this section could be interpreted as a trend reversal signal following the formation of a high.
8-year long-term oblique angle
Your follow and boost would mean a lot. 🚀
I am Korean and I used Google Translate.
