BTC (Y26.P3.E1). Looking for a Grantley HarmonicHi traders,
We are looking for more highs and in the short term, the daily level will likely be resistance and hence a shorting scalp opportunity is likely there. On the bigger picture, a Gantley harmonic could be the target as it will take out much of the liquidity. I was hoping for an ATH around 127k or more for the cup and handle target but we might not get that any time soon. I have tweeted many times that September will be bearish and October and November bullish. I don’t envision this time the Harmonic is a topping structure, but we can’t rule it out.
All the best,
S.SAri.
Trade ideas

BtcusdtThey just trapped the last late greedy bulls . Haven’t seen the OBV this bad last time it was this bad btc couldn’t keep going up and crashed 17% I will bought sbit the btc inverse down 5% already I would probably close it at 118k but I doubt it will go that high . just my thoughts

Ready for BTC/USDT's Next Big Move?🎉 BTC/USDT: "Bitcoin vs. Tether" Crypto Wealth Heist Map (Swing/Day Trade) 🤑
🚨 Thieves of the Crypto Market, Assemble! 🚨
Ready to pull off a stylish swing/day trade heist on BTC/USDT? This is your Crypto Wealth Strategy Map with a bullish setup that’s screaming opportunity!
📈 Let’s dive into this cheeky yet professional plan with a sprinkle of thief swagger to snatch those profits! 💰
📊 The Setup: Why This Trade is a Steal! 🕵️♂️
Bullish Confirmation: We’ve got a double bottom pattern signaling a potential reversal. ✅
Accumulation Zone: Price action shows buyers stacking up, ready to push BTC higher. 🛒
Heikin Ashi Reversal: Smooth, green Heikin Ashi candles confirm the bullish vibes. 🟢
Market Sentiment: The crypto streets are buzzing with optimism — time to capitalize! 😎
The Thief’s Entry Plan: Layered Limit Orders 💸
This is where our thief strategy shines! We’re using a layering strategy with multiple buy limit orders to sneak into the market like the slick bandits we are. 🕴️
Entry Levels:
🎯 $112,000
🎯 $113,000
🎯 $114,000
🎯 $115,000
🎯 $116,000
Pro Tip: Feel free to add more layers based on your risk appetite! Stack those orders like a master thief planning the perfect heist. 😏
Why Layering?: This approach lets you average into the position, reducing risk if the market pulls a fast one. 🃏
🛑 Stop Loss: Protect Your Loot! 🔒
Thief’s Stop Loss: Set at $110,000. This is our escape hatch if the market turns into a trap. 🕳️
Note: Dear Thief OGs (Ladies & Gentlemen), this SL is just a suggestion. You’re the boss of your own vault — adjust it to your risk tolerance! 💪
🎯 Target: Cash Out Like a Pro! 🏦
Profit Target: Aim for $127,000, where we expect strong resistance and potential overbought conditions. Watch out for a possible trap — don’t get greedy! 😈
Note: Dear Thief OGs, this TP is my take. You decide when to grab your profits and vanish into the crypto night. 🌙 Take the money and run at your own discretion!
🔗 Related Pairs to Watch 👀
Keep an eye on these correlated pairs (all in USD) to confirm the broader market trend:
BITSTAMP:ETHUSD : Ethereum often moves in tandem with Bitcoin. A bullish ETH could reinforce BTC’s upward momentum. 📈
BITSTAMP:XRPUSD : Ripple’s price action can signal broader crypto market strength. Watch for similar bullish patterns. 🌊
COINBASE:LTCUSD : Litecoin tends to follow BTC’s lead. A breakout in LTC could confirm our bullish bias. ⚡
Key Correlation Insight: These pairs often move together due to shared market sentiment in the crypto space. If BTC/USDT pumps, expect ETH, XRP, and LTC to potentially follow suit. Cross-check their charts for confluence! 🧠
🛠️ Technicals Recap: The Thief’s Toolkit 🧰
Double Bottom: A classic reversal pattern signaling bulls are ready to charge. 🐂
Accumulation Zone: Buyers are quietly stacking positions — a sign of strength. 📦
Heikin Ashi: Smooth candles filter out noise, confirming bullish momentum. 🕯️
Resistance Watch: $127,000 is a key level where sellers might step in. Stay sharp! ⚠️
⚠️ Disclaimer: Thief Style, Just for Fun! 😜
This Thief Strategy is for entertainment and educational purposes only. Trading is risky, and the crypto market can be a wild ride. Always do your own research (DYOR) and manage your risk like a seasoned bandit. I’m not a financial advisor, just a cheeky chart enthusiast sharing the vibe! 😎
✨ If you find value in my analysis, a 👍 and 🚀 boost is much appreciated — it helps me share more setups with the community!
#BTCUSDT #CryptoTrading #SwingTrading #DayTrading #ThiefStrategy #Bullish #TechnicalAnalysis #HeikinAshi #DoubleBottom #MakeMoney

Bitcoin Price Eyes $120,000 as Seller Exhaustion Sets InBitcoin is trading at $116,502, attempting to hold $115,000 as a new support level. Securing this area is vital as the cryptocurrency also works to break out of the two-month downtrend that has capped its upward momentum since midsummer.
If conditions improve, Bitcoin could rally beyond $117,261. Breaching this level would open the door to $120,000. This would reinforce optimism among traders and institutions anticipating further growth in the crypto king’s valuation.
However, failure to maintain current levels would invalidate the bullish outlook. Bitcoin could fall back to $112,500 or even $110,000, extending the bear run. Such a move would dampen sentiment, signaling renewed vulnerability in the world’s largest cryptocurrency.

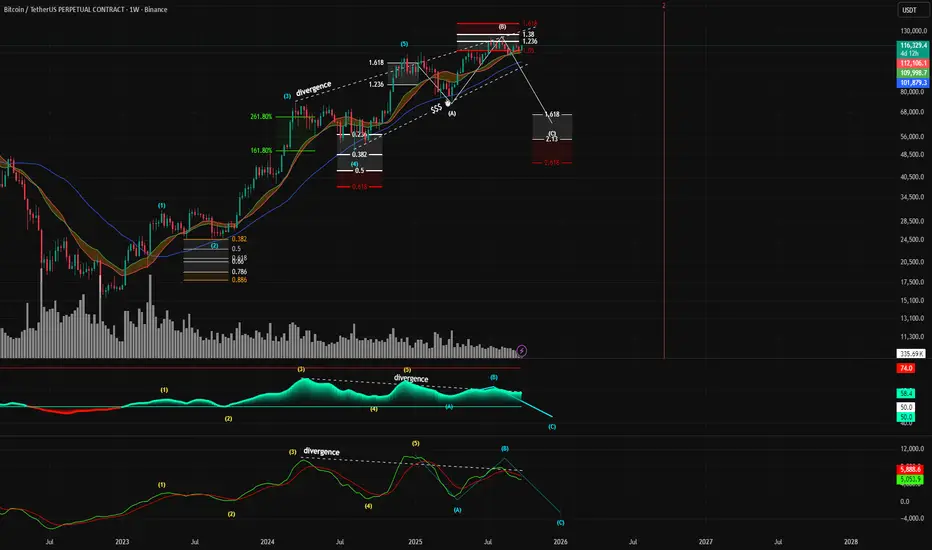
Expanding Flat Elliot wave countBitcoin may be approaching a significant macro top, with multiple technical indicators aligning to signal a potential reversal and a subsequent major corrective wave.
Key Projections:
Potential Top Formation: The current price action is forming what appears to be the peak of a corrective Wave (B), with a potential top range between $109,000 and $150,000.
Projected Corrective Target: Following the completion of Wave (B), a significant downward move, labeled as Wave (C), is anticipated. This corrective wave targets the $45,000 - $67,000 price zone.
Timeline: The entire corrective structure, from the formation of the top to the potential bottom of Wave (C), is projected to unfold by approximately September 2026.
Elliott Wave Structure: The primary thesis is based on an Elliott Wave count. The chart indicates the completion of a five-wave impulse cycle, and the market is now in a larger A-B-C corrective pattern. The current price is likely forming the peak of the B-wave.
Fibonacci Confluence: There is a strong confluence of Fibonacci extension levels at the potential top. The peak of the current Wave (B) is precisely testing the 1.618 Fibonacci extension level, a critical ratio often associated with the termination of corrective waves.
Significant Bearish Divergence (Crucial Point): This is one of the most compelling signals on the chart.While the price is making higher highs (from the peak of wave (5) to the peak of wave (B)).Both the RSI and the MACD indicators are showing lower highs. This is a classic, multi-indicator bearish divergence on a high timeframe (weekly), indicating that the upward momentum is weakening significantly and a trend reversal is becoming more likely.
116,888 Supply hit alreadyI didn't think this supply level would hit this quickly.
116,888 was the previous supply level, and BTC strongly rejected here after a "bullish" 4h close.
It seems likely the drop can happen now.
It could also liq grab to 118.6k but less likely now.
SL 118.9k
If the trade loses, there will be no shorts for some time even if that means shorting lower

BTC 4H – Testing 116k, Key Supply AheadBitcoin bounced strongly from the 109k demand zone and broke above 114k.
Now testing the 116k–117.2k supply zone, which is the key area to watch.
✅ Bullish: Break & hold above 117.2k opens the way to 118k – 120k.
❌ Bearish: Rejection from 116k–117.2k could trigger a pullback to 114k → 111k.
Key Levels:
Supports: 114k / 113k / 111k / 109k
Resistances: 116k / 117.2k / 118k / 120k
⚡️ 116k–117.2k is the decision zone for the next move.

MY BTC LONG TERM BIAS $90k - $75kIts obviously obvious green candle chaser will sooner or later get trashed because they fail to understand that the green candles we are currently seeing are as a result of the USDT Dominance taking a break to the downside.
From experience, when the USDT Dominance take a mild dive, BTC only gets a few thousands in aapreciation.
But when table turns, the outcome is always alarming.

BITCOIN BTCUSDTi will be watching the buy power into 115,606-117,430 for possible rejection as seen on weekly time frame double top structure.
the descending trendline will be watched for breakout ,if we break out of the trend then our target will 124k ,break of 124k will be 141k-139K zone
on weekly time frame we are coming for retest into 117k-115,606,pls watch this zone because of bearish reversal..
watch bitcoin on daily time frame and the structure is clear on price action.
if respected then the sell will drop below 107 zone and target will be 100k-98k zone and 93-94k
layer by layer dont rush.
#bitcoin #btc #btcusdt #crypto

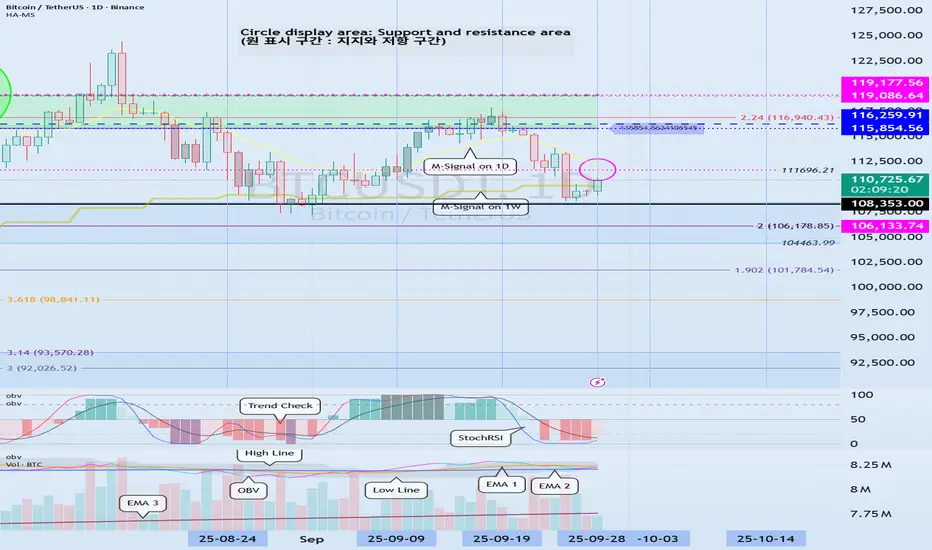
Next Volatility Period: Around October 3rd (October 2nd-4th)
Hello, fellow traders!
Please "Follow" to get the latest information quickly.
Have a great day!
-------------------------------------
(BTCUSDT 1D Chart)
This volatility period lasts until September 29th, but since the next volatility period is around October 3rd (October 2nd-4th), it's highly likely that the volatility period will continue until October 4th.
Therefore, we need to see if the price can sustain above 11696.21 after the volatility period.
If it fails to do so and falls below the 104463.99-108353.0 range, a sharp decline is likely.
If a sharp decline occurs, we need to check for the formation of new indicators such as the DOM (-60) or HA-Low indicators.
If new support is formed, it's important to determine whether there is support near that area.
If support is not found, a step-down trend is likely.
-
It is currently located near the M-Signal indicator on the 1W chart and the M-Signal indicator on the 1D chart.
Therefore, if the price rises above 111696.21 and holds, further upward movement is likely.
At this point, the key question is whether the price can rise above 115854.56 and hold.
To sustain the uptrend,
- The StochRSI indicator must show an upward trend. It must rise from the oversold zone.
- The On-By-Signal (OBV) indicator must show an upward trend. It must rise above EMA 1 and, if possible, above the High Line and remain there.
- The TC (Trend Check) indicator must show an upward trend. It must rise above the 0 point and remain there.
If the above conditions are met, the uptrend is likely to continue above 111696.21.
-------------------------------------------
The basic trading strategy is to buy in the DOM(-60) ~ HA-Low range and sell in the HA-High ~ DOM(60) range.
However, if the price rises in the HA-High ~ DOM(60) range, a stepwise upward trend is likely, while if the price falls in the DOM(-60) ~ HA-Low range, a stepwise downward trend is likely.
Therefore, the basic trading strategy should be a segmented trading approach.
This basic trading strategy principle was developed for trading on Heikin-Ashi charts.
Adding the M-Signal indicator on the 1M, 1W, and 1D charts allows you to see the overall trend.
The remaining indicators indicate support and resistance points or zones for chart analysis or trading strategies.
Trading is all about reaction, so understanding support and resistance points or zones is crucial.
However, you should interpret the charts based on core fundamental trading strategies.
-
Thank you for reading to the end.
I wish you successful trading.
--------------------------------------------------
- Here's an explanation of the big picture.
(3-year bull market, 1-year bear market pattern)
I'll explain more in detail when the bear market begins.
------------------------------------------------------
Bitcoin Correction Still in Play – Waiting for a Higher LowIn the 4H timeframe, Bitcoin still hasn’t made the correction I was waiting for.
I see this whole move as a single wave, and I’ll remain patient until we get a higher low (or equal low) around 108,810.
🔹 If no correction happens, I’ll wait for the market to build a clearer structure.
🔹 I’m not opening any positions for now.
🔹 Don’t rush — patience is key. If you stay consistent and keep tracking the market, opportunities will always come.

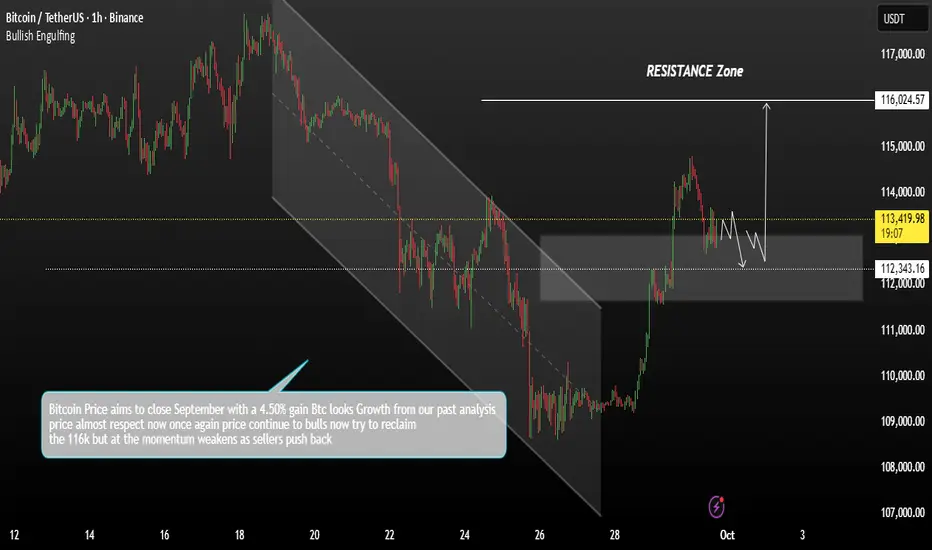
Bitcoin formation of a bullish reversal pattern.Bitcoin price is aiming to close September with a 4.50% monthly gain, signaling the potential end of the recent correction phase and the formation of a bullish reversal pattern.
Technical Analysis:
BTC is currently testing a key mirror resistance level after a strong rally. Despite the recent upward momentum, the price has so far struggled to extend its growth beyond this zone.
If Bitcoin manages to break above the critical 114,000 resistance, the market structure could shift to a bullish reversal, confirming the end of the corrective phase. In such a scenario, the next resistance level to watch would be around 116,000, where further bullish momentum could push the price higher.
You may find more details in the chart.
Trade wisely best of Luck.
Ps; Support with like and comments for better analysis Thanks
BTC market snapshotThe U.S. government has gone into a shutdown, and crypto reacted with growth on the dollar’s weakness. HOWEVER, the short signal is strengthening. The monthly close reinforced the short signal for me personally, which doesn’t mean it will play out tomorrow. From current levels, there’s still a chance to update the highs if we break out above the 116K–117K zone.

Bitcoin - Key support $105 - 107k Buyers Should step inBitcoin - Key support $105 - 107k Buyers Should step in or up trend is over
best confirmation for me Open interest absorption

Ichimuko talks againAccording to BTC price action based on ichimuko clouds we can see that the last time BTC have crossed the red cloud it leaded to a new Ath
Today is the first day of breaking it again
We expect a new ATH as soon as possible
Stop loss under the cloud around 11k
Tp at least 128k
Dyor

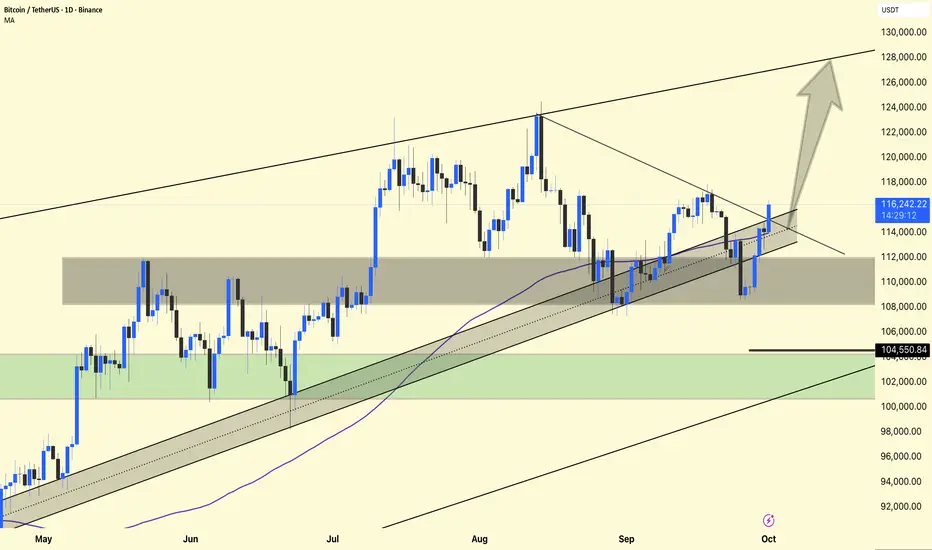
#BTC/USDT 1DAY CHART UPDATE !!BTC Trend Context: The price is within an ascending channel – overall, this suggests an upward trend in the market.
Support Testing: The lower boundary or support zone is being tested – this is a critical "decisive" area.
Rejection/Bounce Potential: If support holds and the price reacts upwards, we could see a further move upwards towards resistance.
Breakdown Risk: If the price breaks decisively below support, this could lead to a deeper decline or a trend reversal.
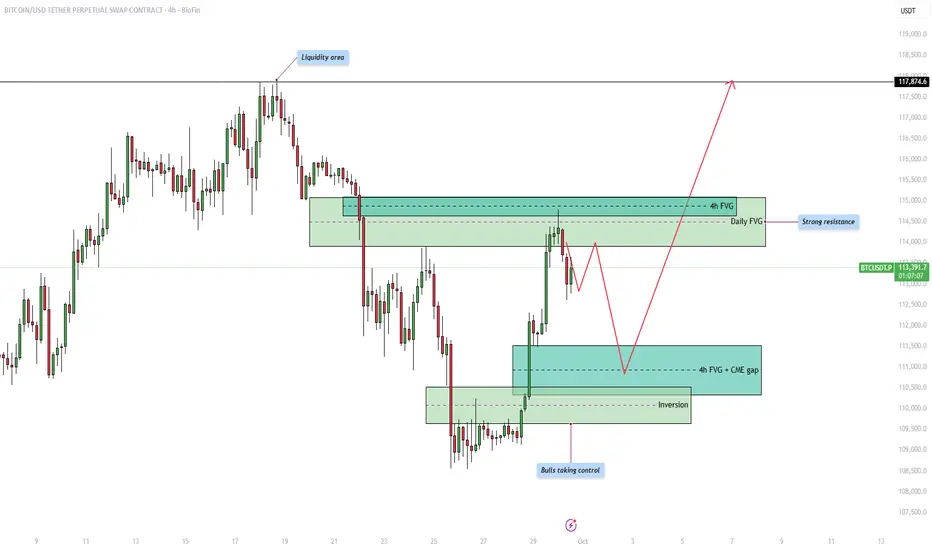
Bitcoin - Shortterm correction in the bullish trend!Introduction
The Bitcoin price action is currently moving within a structured range where both liquidity and fair value gaps (FVGs) are playing an important role in shaping potential market direction. By analyzing the chart, we can identify key areas of liquidity, resistance, and support that traders are likely to pay close attention to in the coming days. Understanding how price reacts around these zones will help anticipate whether bulls can maintain control or if bears will attempt to reclaim lost ground.
Upside liquidity
At the top of the range, we can see a clear liquidity area where price previously reversed. This liquidity pool represents buy-side liquidity, and the market could be drawn towards it as price seeks to sweep the highs. Liquidity is often targeted by the market before making a significant move in the opposite direction, which makes this area important to watch closely.
Resistance from the 4h and daily FVG
Before price can reach higher liquidity levels, it must contend with a strong resistance zone that overlaps with both the 4-hour and the daily fair value gap. This confluence strengthens the resistance, making it more likely that price will struggle to break through immediately. Traders will be watching for signs of rejection within this area, which could cause short-term pullbacks before any potential breakout.
4h FVG and CME gap support
On the downside, the 4-hour fair value gap aligns with the CME gap, providing a strong support level. This zone acts as an attractive area for price to retrace into before continuing higher. It is common for the market to return to such imbalances to fill inefficiencies, so a temporary dip into this support could serve as a healthy retracement before bulls attempt to push price further upward.
Bullish inversion
Another critical development is the inversion zone, where previous resistance has now flipped into support. This shift highlights that bulls are taking control of the market structure, strengthening the overall bullish outlook. As long as this inversion level holds, buyers are likely to defend it aggressively, reducing the probability of a deeper breakdown.
Final thoughts
Overall, the market remains in a bullish posture with upside liquidity acting as a magnet, but significant resistance awaits at the overlapping 4h and daily FVG. Short-term pullbacks into the 4h FVG and CME gap support are likely before the next major move upward. If the bullish inversion continues to hold, we could see a strong push towards the higher liquidity zones, potentially targeting levels beyond 117,000. The coming days will be crucial in determining whether bulls can maintain this control or if resistance proves too strong.
-------------------------
Thanks for your support. If you enjoyed this analysis, make sure to follow me so you don't miss the next one. And if you found it helpful, feel free to drop a like 👍 and leave a comment 💬, I’d love to hear your thoughts!
BTC/USDTI think wave 2 of C has completed, I will open a short position for wave 3 of C with this setup.

BTC Still IN GREEN ZONE - UPDATE 01-10-2025BTC/USDT Update
✅ Bitcoin has reclaimed the low time frame zone, showing renewed strength after the recent dip.
📊 As long as BTC continues holding above $113.6K support, the short-term trend remains bullish.
🚀 The next target sits around the $116K zone, where resistance could be tested in the coming sessions.
🔑 The main trend remains far below, meaning the broader structure is still secured and positive.
📌 Summary:
BTC is holding strong above the low time frame support, with momentum building toward the $116K target zone. Holding this structure keeps the outlook bullish.

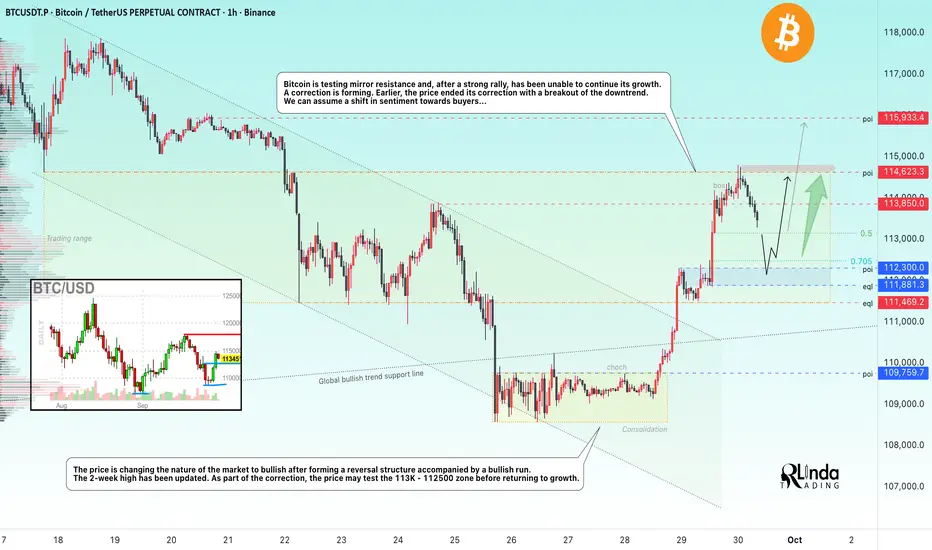
BITCOIN → Correction before the breakout of 114.5KBINANCE:BTCUSDT , after the end of the correction, is forming a 3.5% rally and testing the important milestone of 114,600. It was not possible to break through the level without consolidation and at such a high speed. How long will the correction last?
Bitcoin is testing mirror resistance and, after a strong rally, was unable to continue its growth. The reason for the halt is a huge liquidity pool above 114,600. A pullback is forming. Earlier, the price ended a 3-week correction by breaking through the downward resistance. We can assume a change in sentiment towards the buyer...
Technically, the price is changing the nature of the market to bullish after the formation of a reversal structure accompanied by a bullish run. The 2-week high has been updated.
Resistance levels: 113850, 114620, 115900
Support levels: 113100, 112300, 111800
As part of the correction, the price may test the 113K - 112500 zone before returning to growth. If the market holds the price above 112K - 113K, it will confirm the bullish sentiment, and the positive fundamental background will support further growth.
Best regards, R. Linda!
Forecast for BTCUSDT 1st October 2026 (Updated)Forecast for BTC for the next 4 weeks. Continuation to ~$115k-$117k followed by a retrace to ~$106k then continuation up to ~$115k-$117k retest followed by a huge dump to ~$98k-100k then up to new all time high, ~$150k-$170k

BTC - Will it go 120k?No certainly not unless youre blind to follow where the patterns are moving to, So lets follow the pattern to be precise!

BTC BREAKING KEY LEVEL — $115K TO $119K MOVE INCOMING?Bitcoin just tested $113K support and bounced hard — now eyeing $117K resistance. This setup is primed for momentum traders looking to catch the next leg up.
Critical Price Action
Price is hovering around the $115K psychological level, which has become the make-or-break zone for bulls. Support at $113K represents the ultimate safety net — lose this on 4-hour or daily timeframes and Bitcoin will probabilistically head lower toward retest of sub-$112K levels. The chart shows multiple touches confirming this as a legitimate demand zone where institutional buyers are stepping in.
The Setup (High Probability Trade)
✅ Trade Condition: Close above $113.5K on 4H → Confirms bullish reversal and momentum shift. This breakout would signal that buyers have absorbed selling pressure and are ready to push toward liquidity pools sitting between $118K-$119K.
🎯 Target Zones: First target $117,000 as immediate resistance, then If momentum sustains, liquidity grab could extend toward $118K-$119K where October forecasts project continuation.
🛑 Stop Loss: Below $113k — this invalidates the bullish structure and suggests bears maintain control.
Why This Works
Strong bounce from ~ $113K base equals momentum building. This is a classic support-to-resistance move where former resistance (the $115K zone) now acts as support, creating asymmetric risk-reward for bulls. Volume analysis shows accumulation patterns consistent with institutional buying ahead of Q4 volatility.
Watch for Confirmation — No Fakeouts
The key is waiting for 4-hour candle close (min 1hr) above $114.5K with volume confirmation. Fakeouts are common at psychological levels, so patience prevents getting stopped out prematurely. Monitor order book depth and funding rates for additional confluence.
#BTC #Bitcoin #CryptoTrading #DayTrading #Breakout #BullishSetup #TechnicalAnalysis #CryptoSignals #BTCAnalysis #TradingView
