BTC — Sunday Liquidity TrapAfter hitting the BIG resistance at $117,896 (0.618 Fib retracement), BTC rejected as anticipated and started its current downtrend. The anchored VWAP from the $117.9K high has been an excellent guide, acting as resistance → most recently at $113,800, where it provided a clean short entry.
Over the weekend, BTC has traded sideways. We just saw a small pump to clear the range highs and take out buy-side liquidity, a common setup before markets rotate lower to sweep sell-side liquidity.
Key Confluence Zone
The next level of interest sits around $108,250, where multiple factors align:
Monthly Open: $108,246.36
Daily Level: $108,246.35
0.618 Fib Retracement: $108,236.67
Liquidity cluster with many stop-losses residing here
If this zone fails to hold, the next downside interest lies at:
Key Low: $107,255 → possible SFP area
0.666 Fib Retracement: $106,975.52 → additional support
🟢 Long Trade Setup
Entry: Long around $108,250 (mOpen confluence zone)
Stop-Loss: Below 0.666 Fib retracement (~$106,975)
Take Profit: TP1 → $111K, if volume expands → trail stop for higher targets
R:R: ~1:2
Market Insight
Sunday pumps are notoriously unreliable, often designed to trap traders into late longs before a pullback wipes them out. This setup reflects exactly that dynamic.
Indicators used
DriftLine — Pivot Open Zones → For identifying key yearly/monthly/weekly/daily opens that act as major S/R reference points
➡️ Available for free. You can find it on my profile under “Scripts” and apply it directly to your charts for extra confluence when planning your trades.
_________________________________
💬 If you found this helpful, drop a like and comment!
Trade ideas

The only trades you need this week In this space you will find the highest probability zones to set your alerts, an entry and exit model that you can execute in your sleep and a trading philosophy that stands the test of time.
As we play in this range, one must prepare for another rotation to the range low or a range break.

Daily Bitcoin Signal: Watching the 110,500 Breakout, target 113KBitcoin Technical Signal
Bitcoin is currently showing signs of strength as it tests the key resistance level around 110,500. A confirmed breakout above this zone could trigger fresh bullish momentum, opening the door for higher targets in the short term.
Here’s my personal trade plan:
If the price breaks and closes a 1H candle above 110,500, I will enter a long position.
🎯 Target 1: 111,650
🎯 Target 2: 113,200
🛑 Stop-loss: 109,500
Please note:
This is not financial advice – I’m only sharing my personal trades.
Always do your own research before taking action.
👍 Don’t forget to boost my trading idea if you found this useful, and feel free to follow me for more analysis of this kind.
Best of luck 🌹

BTC Daily & 4H – Bearish Bias Below 114kBitcoin is trading around 110k after the latest drop.
My bias remains bearish, as long as price is capped below 113k–114k.
🔹 Daily (1D):
Rejection from the 116k–117.2k supply zone.
Price is testing the 107.7k demand, which is the key level to watch.
A daily close below this level can accelerate the move toward 104k → 100k.
🔹 4H:
Market consolidating around 109.5k–110.5k after a breakdown.
Any bounce is likely corrective unless BTC reclaims 114k.
Downside continuation remains in play, with 108k–107.7k as the next liquidity target.
🎯 Key Levels:
Supports: 110k / 107.7k / 104k / 100k
Resistances: 113k–114k / 116k–117.2k
⚡️ As long as BTC stays below 114k, I’m voting for further downside.

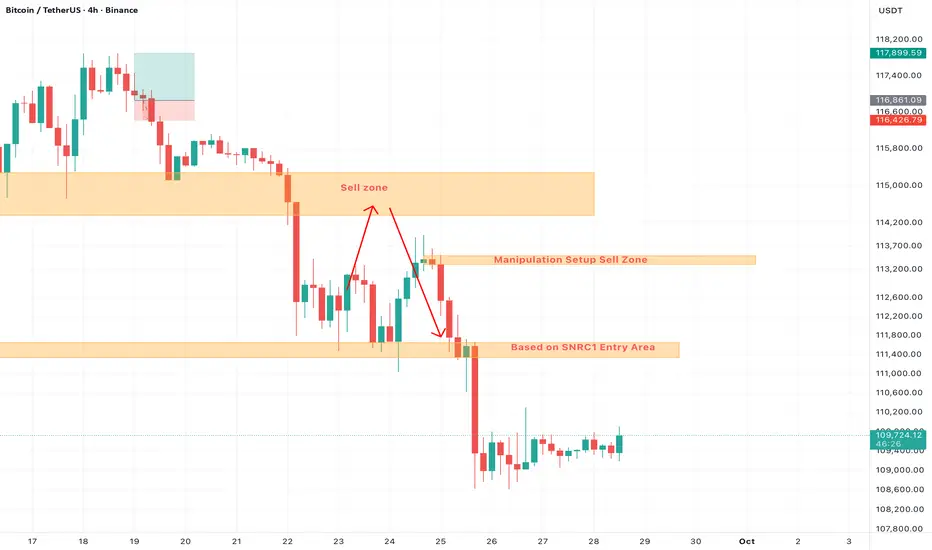
Bitcoin Trade IdeaDaily is in sell trend. I will join the trend sell on potential zones and wait for market structure change to bullish to ride the trend.

BTCUSDBitcoin daily is in sell trend and I am also looking to sell on 2 potential areas before it's bullish move. Looking for sell in next week anytime soon!!
$btc Am simple stylish trader follow meBtc will continue to short , up to 25k area
Trend shifting is bearish
Wxy is corrective
Short at end of wave y

Are you ready for a major drop?Are you ready for a major drop?
Always remember that Bitcoin will suddenly drop significantly after a period of suffering.

Bitcoin - Sacrificed by the banks! (100k, then 130k - buy here)Bitcoin and the whole crypto market have been dropping heavily these days. And I know why! You may wonder, why is Bitcoin in such a weak uptrend, and why do the majority of altcoins never grow, or after a small pump, a huge dump follows? Finally, I bring you the answer to this important question many of you are wondering about.
You know that the world is basically controlled by these 2 companies, BlackRock and Vanguard. So every time you visit a supermarket, you can be sure that 95% of all items are from 1 major company, so they are pretty much telling you what to eat and drink. That's public information; everyone can verify it. There is really nothing special or secret about it.
So there is no doubt that the financial markets are manipulated by whales (banks, governments, and big funds). They can very easily move the price in whatever direction they want. And because altcoins have a very low market cap, they made the price action look like a pump and dump scheme. So every time you buy a coin, you end up in a loss, because they use altcoins as a casino. That's their game, and that's how they make money in crypto. There is really no real uptrend or downtrend on altcoins; in fact, the majority of the time the market has been going down, and only sometimes do we see a big pump, but that's just a temporary event. You can be sure that the market will go down again. Please boost and comment if you agree with you.
Now, everyone is buying coins such as XRP, but what if I tell you that XRP will drop heavily in 2026 to 0.6 USD? The current price is 2.8 USD, so that's a huge crash. Yeah, the majority will find out that this was a scam, and they will sell with an 80% loss on their account into the hands of banks.
So what about Bitcoin? I expect Bitcoin to hit 100k in the next weeks! I think this is a very strong buyable support, but we need more data to confirm another uptrend to 130k! Write a comment with your altcoin, hit the like button, and I will make an analysis for you in response.

TradeCityPro | Bitcoin Daily Analysis #182👋 Welcome to TradeCity Pro!
Let’s move on to Bitcoin analysis. Today the weekly candle closes, and from tomorrow the market can start moving again.
⌛️ 4-Hour Timeframe
On the 4-hour chart, Bitcoin has started a downward move from the 117,570 high, dropping in two bearish legs down to the 108,750 zone.
✨ After reaching this area, volume began to decrease—both because the market is ranging and because it’s the weekend.
✔️ Yesterday, in my analysis, I highlighted a range box on the 1-hour chart. This same box is still visible now on the 1-hour timeframe, spanning 108,750 to 109,890.
🧩 Today’s New York session is very important, since this session often drives weekend market moves. So watch the market carefully,our triggers might get activated.
🔑 If strong volume enters today and 108,750 breaks, we can look to open a short position. However, keep in mind there’s an important support area just below this level that could prompt a reaction and halt further decline.
⭐ For a long position, the first trigger we have is a breakout of 109,890. But note that the short-term trend is still bearish, so it’s better to wait for bullish confirmation first. A clean break of 109,890, followed by a higher high and higher low above this level, would be a solid confirmation for a potential upward move.
❌ Disclaimer ❌
Trading futures is highly risky and dangerous. If you're not an expert, these triggers may not be suitable for you. You should first learn risk and capital management. You can also use the educational content from this channel.
Finally, these triggers reflect my personal opinions on price action, and the market may move completely against this analysis. So, do your own research before opening any position.

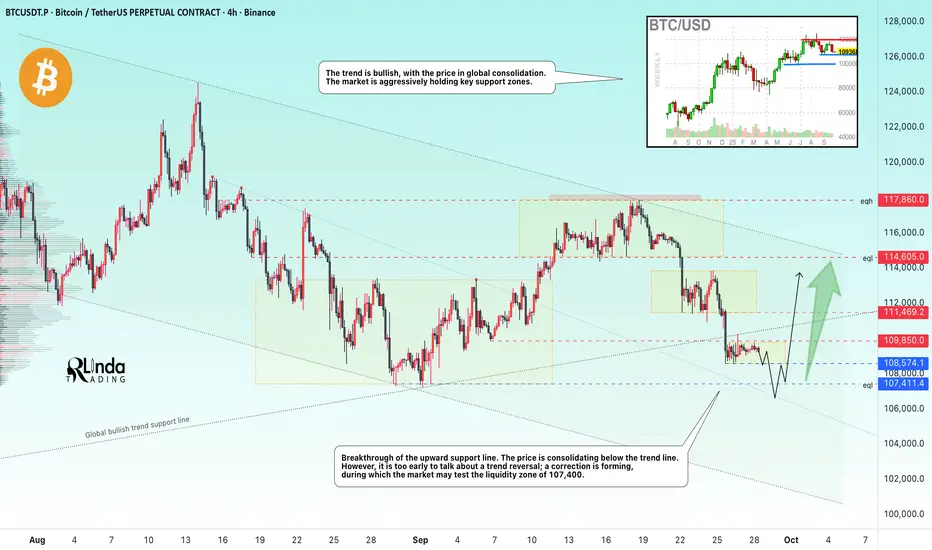
BITCOIN → Stagnation. A brief overview of the current situation.BINANCE:BTCUSDT.P is consolidating after breaking through the trend line support. Despite the positive fundamental background and bullish trend, the market is forming a countertrend correction.
The decline in interest rates in the US has had a negative impact on the cryptocurrency market. Can this be called manipulation? Most likely, yes. But the cryptocurrency market needs a constant driver to keep it alive; calm or neutral conditions lead to corrections and retests of intermediate lows...
As for Bitcoin, I have identified several key areas: the boundaries of the current consolidation at 109,850 and 108,575. Accordingly, a breakout and close above or below one of these boundaries could trigger a move in the corresponding direction. But within the local trend, we can expect a decline to the intermediate bottom of 107,400, from which an attempt at growth could form. In addition, an important zone is the conglomerate of resistance at 110K and the ascending support line. If the price can form an upward momentum and close above the trend support, the market may react positively.
Resistance levels: 109,850 - 110K, 111,500
Support levels: 108,500, 107,400
After breaking through the trend support, there is no momentum and the price is consolidating. This suggests that the market does not believe this premise and a battle for the area is forming. If the bulls can hold their ground and bring the price back within the boundaries of the uptrend, then it may be worth looking for a buying opportunity. Otherwise, it is worth waiting for a retest of the intermediate bottom at 107,400 before looking for an opportunity to open long positions.
Best regards, R. Linda!
BTC - THE FINAL MOVE
Huge liquidity spot between 106.5K - 108.2K
We are also approaching the end of the weekly/monthly candle.
Currently we are in a downtrend however seeing signs in the RSI that a move up is on the horizon (bullish div.)
Based on historical halving events Bitcoin achieved a new ATH in Nov or Dec of 2013, 2017 and 2021
Put all this information together. I think that the whales are going to grab the liquidity Zone as we move into October and the next 3 months are going to mega bullish for the crypto market. Anything over the 124.5K mark would cement a parabolic run to the upside ending at the back end of Q4 2025.

BTC Market Update📊 BTC Market Update
BTC is forming a contracting pattern — price is getting tighter ⚡
This usually means a big move is coming soon 🚀📉
Breakout could happen up or down — stay ready and wait for confirmation before entering.

Bitcoin Liquidity GrabBitcoin came back into discount pricing (between the swing low and swing high), and it looks like it is still waiting for the next catalyst for the next leg up.
We are currently still in the weekly imbalance, which a lot of times will act as a demand zone. Before we can take a long position, we need to clear the "bump in the road" — or in this case, liquidity.
I will wait for price to take out the liquidity under the equal lows around 107.2k, and then I’ll wait for a CHoCH on the 1H–4H before looking for a long trade.
Happy trading,

How to Turn Others Fear and Greed Into your ProfitHave you ever felt opportunities slip away when others sell in fear or buy in greed?
The crypto market is full of emotional moves that can create big profits.
In this analysis, we will learn how to read crowd behavior and benefit from it.
Hello✌️
Spend 2 minutes ⏰ reading this educational material.
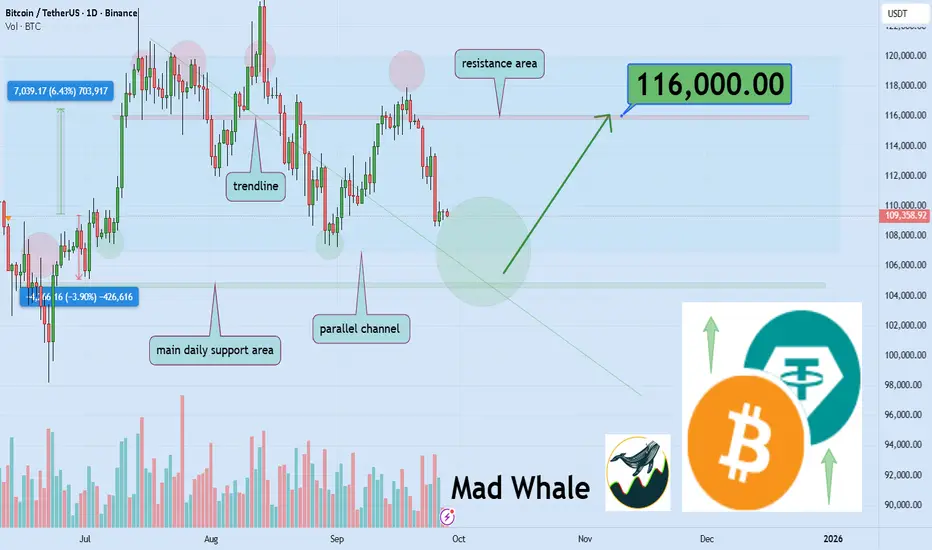
🎯 Analytical Insight on Bitcoin:
Bitcoin is approaching a key daily support and a reliable trendline within a parallel channel, holding which could set up a 6% rally toward 116,000$. Traders should watch this level closely for a potential bounce. 📈🔍
Now , let's dive into the educational section,
🔮 Market Psychology and Crowd Behavior
Crypto is heavily influenced by collective emotions.
FOMO leads to impulsive and irrational buying.
FUD and negative news create fear, pushing prices down.
Recognizing these behaviors reveals trading opportunities.
The goal is to use collective emotions to your advantage.
💡 Practical Tips to Profit from Fear and Greed
Always monitor volume and key indicators.
Use classic patterns like Double Bottom and Bullish Engulfing.
Wait for short-term emotions to settle and the market to stabilize.
Never forget risk management; reserve some capital for market swings.
Avoid making decisions based on crowd emotions alone.
🧠 Individual Psychology and Greed
Understanding your own emotional weaknesses improves decisions.
Success means aligning with crowd behavior without falling victim to emotion.
Others’ fear and greed can become powerful tools for smart profit.
Focused, logical decisions are essential in volatile conditions.
Learning emotional control is the key to long-term success.
📊 TradingView Tools and Indicator
Volume: High volume in a downtrend signals potential buying opportunity.
RSI (Relative Strength Index): Oversold range signals possible price reversal.
Order Book and Level 2 Data: Reveal market pressure from fear or greed.
Sentiment Indicators: Analyze market mood for smarter decision-making.
Moving Averages: Identify strong trends and entry/exit points.
Alerts: Set alerts on critical levels to never miss opportunities.
Drawing Tools: Mark support, resistance, and channels for clarity.
Custom Scripts: Use simple scripts to detect emotional patterns.
📈 Practical Application
When strong market emotions coincide with indicator signals,
Allocate part of your capital for smart profit opportunities.
Simultaneously, manage risk and control your own emotions.
📝 Summary
Others’ fear and greed create golden opportunities.
Analyzing indicators and managing emotions is the key to success.
🌟 3 Powerful Recommendations
Always confirm signals with multiple indicators before acting.
Base decisions on analysis of crowd behavior, not on emotions.
Reserve capital for volatile opportunities while managing risk.
Continuous practice of emotional control is your most important market skill.
✨ Need a little love!
We pour love into every post your support keeps us inspired! 💛 Don’t be shy, we’d love to hear from you on comments. Big thanks , Mad Whale 🐋
📜Please make sure to do your own research before investing, and review the disclaimer provided at the end of each post.
BTCUSDT Bullish or Bearish ?Bitcoin has been consolidating around this level for about three days, forming a potential converging triangle. We won’t predict the direction — if it breaks upward, we’ll go long; if it breaks downward, we’ll go short.
No prediction, just follow.

$BTC Sunday Update Bitcoin dumped over 8K, exactly as I warned CRYPTOCAP:BTC Sunday Update
Bitcoin dumped over 8K, exactly as I warned many times at 115K. This is now the 2nd time price has rejected and fallen below 110K. I’m still holding shorts, and if we push back to 115K again, I’ll add more. My downside targets haven’t changed: 105K, 100K, 95K, 90K or below. Altcoin pumps are only traps before the bigger drop.
BTC Idea.As we approach the month of October and the rate cut/s possibly coming during the coming months I think that BTC has found support and will bounce soon to reach ATH and create new ones.
Tell me on your comments what do you think.
Thank you and stay safe.

BITCOIN BTCUSDTBBITCOIN ,THE btc structure will be watched critically until our POE FOR BUY IS SNIPER ENTRY.
i will be watching what buyers will do at 107,118.8 demand level break of this level will guarantee us of sell drop into 100k-94k zone ,within 100k-94k switch to 15min and scalp your position for better POE .
THE DEMAND FLOOR REMAIN MY KEY BUY ZONE .
#BTC #BITCOIN #BTCUSDT

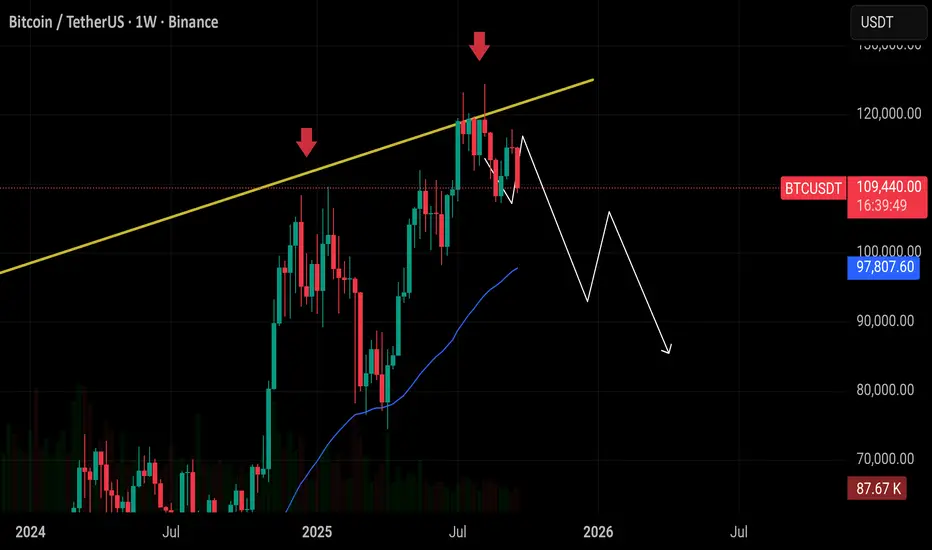
BITCOIN WEEKLY CHARTTHE WEEKLY STRUCTURE HOLD SSTRONGER BIAS THAN THE DAILY .THE weekly chart has the following support level
support1 @100,361-99k zone
support2@94,229.97-93k zone
support 3@73,884.57k zone
support 4@52,845.34 zone
every layer are based on structural probability, manage your risk.
#bitcoin #btc #btcusdt

BTCUSD ShortAs you see in the chart, I see many reasons that we can see BTC to the level of 85,000$ by end of the year. So the reasons are:
Head&Shoulder pattern
Started the downtrend channel
The bold blue trendline is what the price is expected to touch.

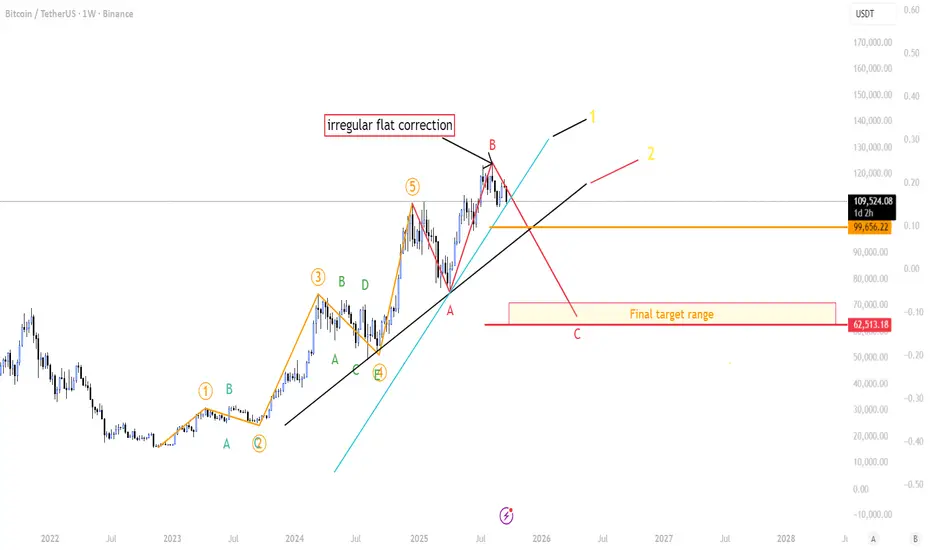
BTC at a Crossroad: Path to 62.5k Is Conditional-Pick Your PlayI’m sharing a possible irregular flat correction that could pull BTC toward ~62,513—only if two key trend supports break.
Note: This Elliott count differs from my main count. It’s my secondary scenario—lower conviction, but it deserves close attention because the structure is developing cleanly. This does not mean BTC is going down (it's just a watch out scenario)
The story so far
From the Nov 22, 2022 low, BTC ran a full 5-wave impulse.
Wave 3 was the extended one.
Wave 4 formed a triangle.
Wave 5 ran hotter than expected (roughly the size of Wave 3). That’s unusual, likely fueled by extreme Bollinger Band Width compression before the final push.
Why this matters: when Wave 3 extends, Wave 5 is usually shorter. It isn’t a hard rule—just a guideline—so this count stays on the board, but it’s not a high-conviction setup.
What I think is happening now
The drop and bounce look like an expanded (irregular) flat: (A) down, (B) up which was our All time high, C down.
If the pattern completes, C could target ~62,513.
Quick pattern note (irregular flat): It’s a 3–3–5 structure — A = 3 waves, B = 3 waves (often pokes above the prior high), and C = 5 waves. On this chart, A and B already printed as 3 + 3. The setup isn’t confirmed until we see C unfold as a clear 5-wave move (1-2-3-4-5). No five-wave C = no completed irregular flat.
What would confirm it (the “if/then”)
Lose the first rising trend support (≈ 109k).
Then lose the second, deeper trend support.
If both break, the path toward ~62.5k could be opening up.
Between those two lines: BTC can go sideways for a weeks—that “range box” is important.
Why the range box matters (Altseason meter)
Altcoins usually need steady BTC to fly:
BTC sideways (not spiking up or dumping).
TOTAL2 (alt mkt cap) breaks ATH.
BTC.D rolls over (dominance falls).
If these three line up, we’ve got a real altseason setup. If not, it’s noise.
Bottom line
This is a watchlist scenario, not gospel.
I’ll respect the levels: no break = no bear target.
If we range between supports, I’ll look for alt strength while BTC stays calm.
BTC/USD Key Scenarios: Bearish Rejection or Bullish Breakout ?Bitcoin (BTC/USD) is approaching critical levels where both bullish and bearish scenarios could unfold:
Bearish Scenarios
1.Price rallies toward $115,000, aligning with the 0.5 Fibonacci level, before rejecting and falling back to $107,000.
2.Alternatively, a push to $117,000 could meet resistance at the 0.382 Fibonacci level, triggering a rejection.
Bullish Scenario
3.If bulls remain in control and resistance breaks decisively, BTC/USD could extend higher toward $124,000.
Traders should watch closely for confirmation signals at these levels, as the next move will likely set the short-term trend.
