$BTC market update.CRYPTOCAP:BTC Market Update
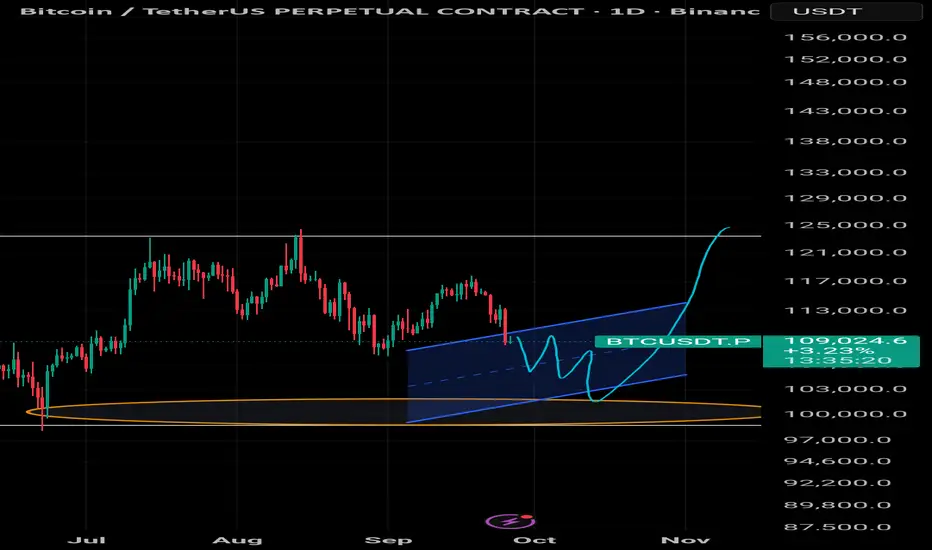
CRYPTOCAP:BTC is currently ranging between $120K and $106K.
If you didn’t enter near the bottom of this range, be cautious—there’s still a strong chance of rejection since the 1W consolidation isn’t finished yet.
The recent liquidity grab was expected, and with the CME gap nearly filled, the market is now at a decision point.
What’s next?
We’re sitting in the middle of the range:
If rejected, we could revisit the bottom around $106K, which would offer a stronger entry for the next leg up.
If momentum continues, the next target is the top of the channel at $120K.
The rejection scenario looks more likely since this push wasn’t impulsive—it was news-driven and unfolded slowly over a week, suggesting market makers may be buying to trigger short liquidations.
Indicators:
RSI → Each time it overheats, a cooldown follows. A better entry may be lower since this move seems topped.
MACD → Still ranging, offering clear buy/sell zones.
Stochastic RSI → Pointing toward a cooldown, reinforcing the rejection case.
Bearish divergence → If it is forming now, it would validate this idea further. Keep and eye on it.
Always remember: DYOR (Do Your Own Research).
Trade ideas

#BTCUSDT 6H ChartPrice had swept the low at 109.33k and it is currently still pushing down. MACD is showing bearish momentum, RSI is oversold and EMAs are turning bearish. Price is expected to keep pushing down aiming to retest the support at 107.5k.

What Next on BTC? As previously predicted, we got pulled back into the Supply and Demand Zone. Expecting a bounce within this parallel channel.
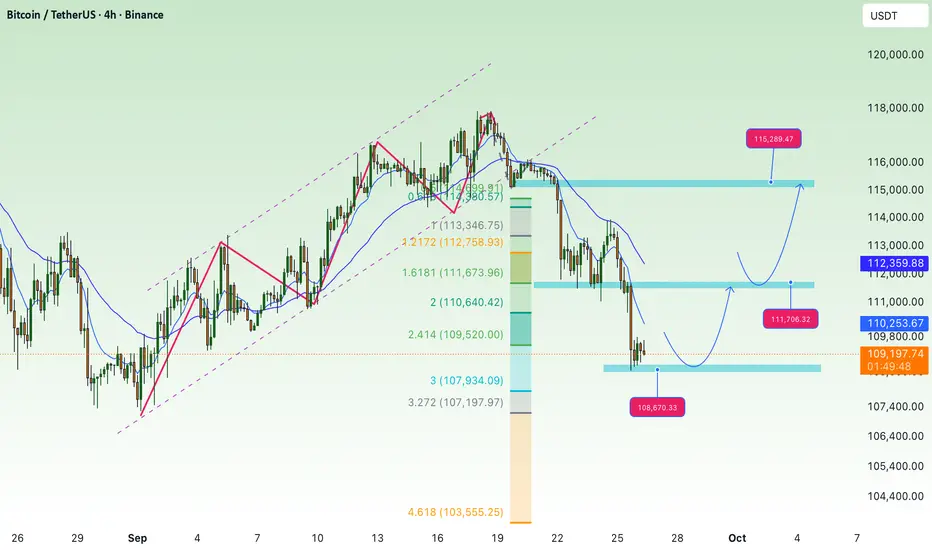
waiting for BTC to recover, accumulate above 107KBTC Technical Analysis (4H Chart):
After breaking down from the rising channel, BTC has confirmed a bearish structure, forming lower highs and lower lows.
Price recently bounced from the 108,800–109,000 support zone, which aligns with the 2.618 Fibonacci extension. This is a key short-term support area to watch.
If buyers can hold this support, BTC may retest the 111,600–111,700 resistance zone. A breakout above could open the path toward the higher resistance at 115,300–115,400.
On the downside, if the 109,000 zone fails, the next bearish targets lie at 105,900 and deeper Fibonacci projections around 104,200–103,100.
Trend Outlook:
Short-term: Possible recovery toward 111,600 or even 115,300 if demand holds above 109,000.
Medium-term: Still bearish-biased as long as price stays under the 200 EMA (~114,000).
Key Levels to Note:
Resistance: 111,600 – 111,700, 115,300 – 115,400
Support: 109,000, 105,900, 104,200 – 103,100

BTCUSDT D1BTCUSDT is still in an uptrend. Given that it has reached a resistance level, a price correction toward the specified zone is expected. If it reaches the support levels, it could present a good buying opportunity after confirmation.

BTC 110K IS A NEW UPTREND FOR LOW TIME FRAME UPDATE 26/09/2025BTC/USDT Update
On the low time frame, BTC is still in a breakdown structure, trading around 109.5K – 109.7K.
However, the market is now approaching a key reversal zone where a new uptrend could start.
Key levels:
110K → first confirmation level. A strong reclaim and close above this would be the first signal for a potential uptrend after more than a day under pressure.
113,296 – 113,892 → main trend resistance zone. Only a breakout and confirmation above this range would flip the structure fully bullish again.
Upside scenario: A move back above 110K confirms low time frame strength, opening the path to test 113K+.
Downside risk: Failure to reclaim 110K keeps BTC under bearish momentum, with risk of continuation toward 108K or lower.
📌 Summary
BTC remains in breakdown mode but is close to reversal territory.
Above 110K → first low time frame uptrend confirmation.
Above 113K+ → stronger trend reversal back into bullish cycle.
Below 110K → downside risk stays active.

BTC Bearish Targets – 108k Next?Bitcoin failed to hold above 110k and the structure remains bearish.
Any bounce into 111k–113k is likely just corrective before more downside.
Main bearish targets are:
🔹 108k – first support zone
🔹 106k – key liquidity area
🔹 104k – deeper target if weakness continues
If 106k breaks on higher timeframes, the psychological 100k zone could be tested.
⚠️ Bias stays bearish as long as price trades below 114k.

Bitcoin at a Crossroad: Will $101K Support Hold?BTC is trading inside a clear descending channel, indicating a sustained bearish trend.
$101,558 – a potential short-term support level.
$98,795 – a stronger support aligned with the lower boundary of the channel and long-term trendline.
Long-term trendline support: Still intact, starting from late 2024, suggesting that the macro uptrend is not yet broken.
If BTC holds above $101K and rebounds, it could reattempt a breakout from the descending channel.
A breakdown below $98.8K may accelerate bearish momentum, potentially pushing the price toward $92,703 as marked on the chart.
On the upside, a confirmed breakout above the descending channel could bring BTC back toward the $120K region.

DeGRAM | BTCUSD will retest the $106900 level📊 Technical Analysis
● BTC/USD rejected dynamic resistance and broke lower within the falling channel, confirming short-term bearish momentum.
● The price targets the 106,900 support zone, with continued pressure from lower highs and strong resistance near 124,000.
💡 Fundamental Analysis
● Bitcoin is weighed down by risk-off sentiment as U.S. yields rise, while weaker liquidity and stronger dollar outlook add to downside pressure.
✨ Summary
BTC/USD remains under dynamic resistance, targeting 106,900 support as bearish momentum dominates. Short-term outlook stays negative unless 114,000 is reclaimed.
-------------------
Share your opinion in the comments and support the idea with a like. Thanks for your support!

BTC Breakdown: Watching 112.6K-113.5K for Rejection Toward 109kHello guys!
Trend Structure:
The price was moving in a clear ascending channel, but recently broke down below the lower boundary with strong bearish momentum. This confirms a structural shift from bullish to bearish sentiment.
Current Price Action:
After the breakdown, BTC attempted a relief rally but is now struggling around the 112,682 – 113,581 resistance zone (marked in blue). This area was previously support inside the channel and is now acting as resistance (role reversal).
Scenarios (Entries):
Rejection at 112,682 zone:
If BTC fails to break above this resistance, sellers could step in and push the price lower. A clean rejection here would open the way toward 109,884 (next major support).
Deeper pullback to 113,581:
If bulls manage to push higher, the 113,581 level becomes the last line of resistance. A rejection here would be a high-probability short entry, also targeting 109,884.
Target Zone:
Both rejection scenarios point to 109,884 as the key downside target. A break below that level would increase bearish momentum toward 108,000 and possibly lower.

Bitcoin Remains Well Positioned For a Deeper CorrectionBitcoin Remains Well Positioned For a Deeper Correction
Bitcoin is currently trading around 109,300 USDT after failing to continue higher. The chart shows signs of weakness, with a potential bearish move ahead.
It looks like we could be in for a bigger correction before the price drops further. That’s what the data so far suggests.
Whether BTC will extend into a normal correction or a bigger correction remains to be seen. We can not predict when the price might finish the correction most of the time.
If the bearish scenario continues, the next key support targets are:
100,000
88,300
79,000
Bitcoin is under pressure, and unless it recovers strongly above current highs, we may see a gradual move down toward the listed targets.
You may find more details in the chart!
Thank you and Good Luck!
❤️PS: Please support with a like or comment if you find this analysis useful for your trading day❤️

Bitcoin I Daily Range Manipulated - chance for push upHello traders, as you know when range low is manipulated price goes to the opostin liuqditiy for the stop hunt. Order flow changed to the bullish. there is chance that we are in distribution phase.
🧪This concept is very easy to follow here are few examples of the recent trades.
✅ EURUSD - Stop hunt of the range
✅ USDCHF - Stop hunt of the range
✅ GBPUSD - stop hunt of the range
💊 Note: this is just a probability. Win rate of this method is above 70% if you trade it with the right market context.
“Adapt what is useful, reject what is useless, and add what is specifically your own.”
David Perk aka Dave FX Hunter ⚔

$BTC structure, next target 95-90kCRYPTOCAP:BTC structure, What You can see here?
How well did this chart and its structure play out? And why should we see a completely different picture now?
Is the next target 95-90k, after which will the long-awaited momentum begin?

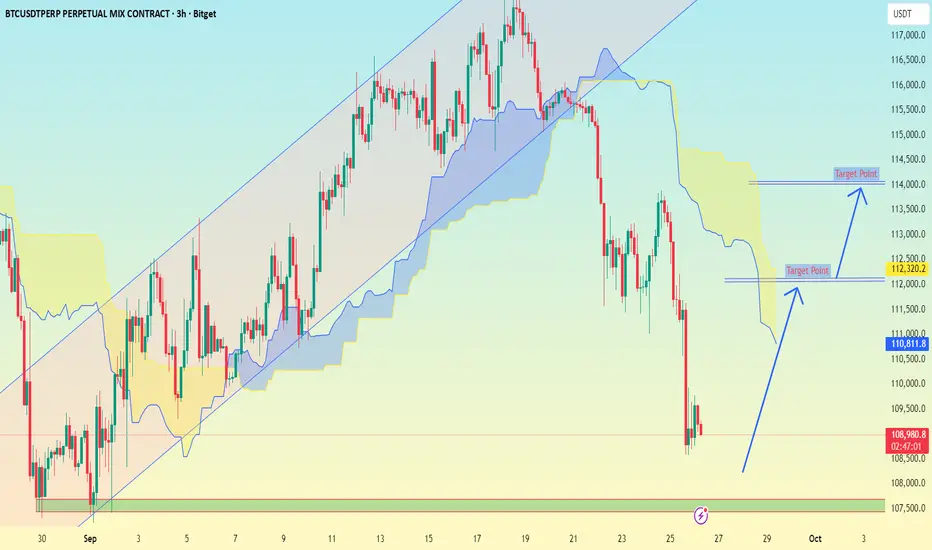
BTCUSDT 3H chart Pattern...BTCUSDT 3H chart:
Price has broken out of the rising channel and dropped sharply.
It’s now consolidating near 109,000 USDT after testing support.
The Ichimoku cloud shows price trading below the Kumo, but My marked two potential bullish retracement targets.
Targets (based on My chart):
1. First Target Point → 112,300 – 112,500 USDT
This aligns with a minor resistance + the bottom edge of the Ichimoku cloud.
2. Second Target Point → 113,800 – 114,200 USDT
This is higher resistance + mid-section of the Kumo cloud.
📌 So, if BTC holds above 108,500 – 109,000 support, these are likely rebound levels:
TP1: 112,500
TP2: 114,000
⚠ But if 108,500 breaks with strong volume, the bullish recovery setup is invalidated, and downside continuation may happen.
BTC: Long or short here is my takeBTC rallied from about 84.5K to 124.4K.
Since the high, it is retracing and currently sitting in the 38.2%–50% Fibonacci retracement zone.
There are bullish order blocks below (97K–100K) and a bearish order block above (118K–124K).
Key Fibonacci Levels
38.2% ($109.2K): Current level. If defended, it can act as a springboard.
50% ($104.5K): Next key support if 38.2% fails.
61.8% ($99.8K): Golden ratio, highly important. Confluent with bullish OBs.
78.6% ($93.1K): Deep retracement level and last line of defense before structure shifts bearish.
Bullish Scenario
Holding 109K–104K keeps the structure constructive. A bounce here could retest 115K and eventually 124K.
A break above 124.4K targets the Fibonacci extensions, with the first at 135K (−27%).
The 97K–100K bullish OB is another potential support zone for a reversal if price retraces further.
Bearish Scenario
Losing 109K cleanly points to a test of 104.5K.
Breaking down through 104.5K–100K significantly increases risk of a move to 93K.
Failure at 93K likely leads to a full retrace into the 84–85K lows, with further extension targets between 76K–73K.
Summary
BTC remains in a mid-retrace phase. The decisive zone is 109K–104K. Holding this keeps the door open for bullish continuation. Breaking it exposes the 100K and 93K levels, with deeper risk toward the 84K range.
Would you like me to mark out the Fibonacci upside extension levels above 124K in case BTC resumes the larger trend?

BTC/USDT — Bull Flag Formation: Continuation Rally or Breakdown?📝 Full Analysis
Bitcoin is currently forming a classic Bull Flag pattern. This setup appears after a strong impulsive rally (flagpole), followed by a corrective consolidation within a descending channel (the flag). Technically, a bull flag often indicates a bullish continuation, suggesting the market is taking a breather before resuming its upward trend.
🔍 Bull Flag Characteristics on the Chart
Flagpole: The sharp rally that pushed BTC up to 124,474.
Flag: A descending parallel channel where price consolidates with lower volatility and reduced volume.
Key Support (~109k): This level acts as the foundation of the flag. As long as BTC holds above it, the bull flag remains valid.
---
📈 Bullish Scenario (Bull Flag Confirmation)
Price holds above 109k and bounces higher.
A valid breakout above the upper flag trendline with a strong 2D candle close and higher volume would confirm the bull flag.
Upside targets:
Immediate Resistance: 117k → 120k.
Retest of Previous High: 124.4k.
Theoretical Bull Flag Target: potentially extending toward 130k+ in the mid-term.
---
📉 Bearish Scenario (Invalidation of Bull Flag)
If BTC fails to sustain above 109k, the bull flag risks invalidation.
A breakdown of this key level could drag price back to 103k, with extended downside risk toward 74.5k if selling pressure intensifies.
In this case, the flag turns into a failed continuation setup, shifting market sentiment bearish.
---
⚖️ Conclusion
The chart currently reflects a textbook Bull Flag: impulsive rally → corrective descending channel.
As long as 109k holds, the bullish continuation bias remains intact.
A breakdown below 109k, however, opens the door to a deeper correction.
---
📌 Trading Outlook (Not Financial Advice)
Bullish Plan: Enter on a confirmed breakout above the flag with strong volume. Targets: 117k → 120k → 124k+.
Bearish Plan: If breakdown occurs below 109k, short-term target ~103k, extended target ~74.5k.
---
#Bitcoin #BTC #BTCUSDT #BullFlag #Crypto #TechnicalAnalysis #ChartPattern #BullishContinuation #Breakout

IPO Structure & Strategy1. Introduction to IPO
An IPO is a process by which a private company becomes publicly listed on a stock exchange. The fundamental purpose is to raise equity capital from a broad range of investors. Companies may pursue an IPO for several reasons:
Capital for Expansion: Raising funds to invest in new projects, infrastructure, research, or acquisitions.
Liquidity for Shareholders: Allowing early investors and founders to realize some returns.
Brand Enhancement: Being publicly listed enhances credibility, attracting customers, partners, and top talent.
Debt Reduction: IPO proceeds can be used to repay existing debt, improving the balance sheet.
However, an IPO is not just a financial transaction—it is a complex strategic initiative. The structure of the offering, timing, pricing, and investor targeting all influence the success of the IPO.
2. Types of IPO Structures
IPO structures vary depending on the objectives of the company, market conditions, and regulatory frameworks. Common structures include:
2.1 Fixed Price Offering
The company sets a fixed price per share in consultation with underwriters.
Investors subscribe at that price.
Simpler but risky if the market price diverges from the fixed price.
2.2 Book Building
Price range (price band) is provided, and investors bid within the range.
The final price is determined based on demand.
Most common method globally due to market efficiency and price discovery.
2.3 Offer for Sale (OFS)
Typically used by promoters to sell their existing shares to the public.
Does not result in fresh capital infusion but increases public shareholding.
2.4 Direct Listing
Companies bypass traditional underwriting and list existing shares directly on the exchange.
No capital is raised, but liquidity is provided.
Popular with mature tech firms.
2.5 Combination Offer
Some IPOs use a mix of fresh issue and offer for sale to balance capital raising and liquidity for existing shareholders.
3. Key Participants in IPO
Successful IPO execution requires coordination among multiple participants:
Company Promoters & Management
Drive the strategic vision, prepare financials, and liaise with regulators.
Underwriters / Investment Banks
Assess valuation, structure the offer, market the IPO, and ensure subscription.
Regulatory Authorities
Ensure compliance with securities laws (e.g., SEBI in India, SEC in the US).
Legal & Audit Advisors
Conduct due diligence, prepare offering documents, and certify disclosures.
Institutional & Retail Investors
Subscribe to shares and determine the success of the offering.
4. IPO Preparation Strategy
The preparation phase is crucial for IPO success. It includes both internal readiness and market positioning.
4.1 Financial Readiness
Audit of financial statements for at least three years.
Streamlined accounting practices.
Robust governance and risk management frameworks.
4.2 Regulatory Compliance
Filing draft prospectus (DRHP in India, S-1 in the US).
Ensuring all disclosures meet regulatory standards.
Resolving pending litigations or compliance issues.
4.3 Corporate Governance
Strengthening board structure.
Introducing independent directors.
Implementing transparency and accountability measures.
4.4 Market Timing
Assessing market conditions (equity market trends, sector performance, investor sentiment).
Avoiding volatile periods or market corrections.
Aligning IPO timing with growth milestones or earnings announcements.
5. IPO Valuation Strategy
Valuation is both an art and a science. Underpricing or overpricing can significantly affect the company’s reputation and capital raised.
5.1 Valuation Methods
Discounted Cash Flow (DCF): Future cash flows discounted to present value.
Comparable Company Analysis: Based on valuation multiples of peer companies.
Precedent Transactions: Considering valuations in prior IPOs of similar companies.
5.2 Pricing Strategy
Underpricing: Encourages oversubscription and first-day gains.
Fair Pricing: Reflects true intrinsic value to avoid leaving money on the table.
Premium Pricing: Signals confidence and strength, but may risk undersubscription.
6. Marketing & Investor Targeting Strategy
A well-executed marketing campaign ensures investor awareness and demand generation.
6.1 Roadshows
Company executives present growth story to institutional investors.
Involves international roadshows in cases of cross-border IPOs.
6.2 Media & Public Relations
Strategic communication through press releases, interviews, and social media.
Focus on transparency, company story, and future prospects.
6.3 Institutional vs Retail Allocation
Allocating shares between high-value institutional investors and retail investors.
Ensures broad-based participation and market stability.
7. Risk Management in IPO
IPO involves multiple risks:
Market Risk
Equity market volatility may reduce demand or affect pricing.
Operational Risk
Mismanagement during preparation or subscription phases.
Regulatory Risk
Delays in approvals or non-compliance penalties.
Reputation Risk
Poor performance post-IPO affects investor trust.
Mitigation Strategies:
Conservative valuation.
Thorough due diligence.
Active investor communication.
8. Post-IPO Strategy
Post-listing strategies ensure sustainable growth and market confidence.
8.1 Price Stabilization
Underwriters may support share price initially to avoid volatility.
Lock-in periods for promoters prevent mass sell-off.
8.2 Investor Relations
Continuous disclosure of financial performance and strategic initiatives.
Building a transparent, long-term relationship with investors.
8.3 Growth Capital Deployment
Utilizing IPO proceeds effectively for business expansion or debt repayment.
Demonstrates prudent capital management.
9. Strategic Considerations for IPO Timing and Market Conditions
9.1 Market Cycles
IPOs perform better during bullish markets.
Consideration of macroeconomic trends, interest rates, and liquidity conditions.
9.2 Sector-Specific Opportunities
Technology, green energy, and healthcare often attract high investor interest.
Positioning IPO to align with sector momentum improves subscription rates.
9.3 Regulatory Changes
IPO windows may be influenced by new regulations, tax policies, or investor-friendly reforms.
10. Global Trends in IPO Strategy
Modern IPO strategies increasingly reflect global practices:
SPACs (Special Purpose Acquisition Companies)
An alternative to traditional IPOs, allowing faster market access.
Dual Listings
Listing on multiple exchanges to attract international investors.
ESG-Linked IPOs
Companies highlighting environmental, social, and governance credentials gain investor interest.
Conclusion
An IPO is far more than a mechanism to raise capital. It is a strategic event that reshapes a company’s financial, operational, and market positioning. The success of an IPO depends on careful planning, transparent governance, meticulous valuation, strategic marketing, and effective post-IPO management. Companies that adopt a structured and holistic approach to IPO planning are better equipped to maximize capital, strengthen investor confidence, and achieve sustainable growth.

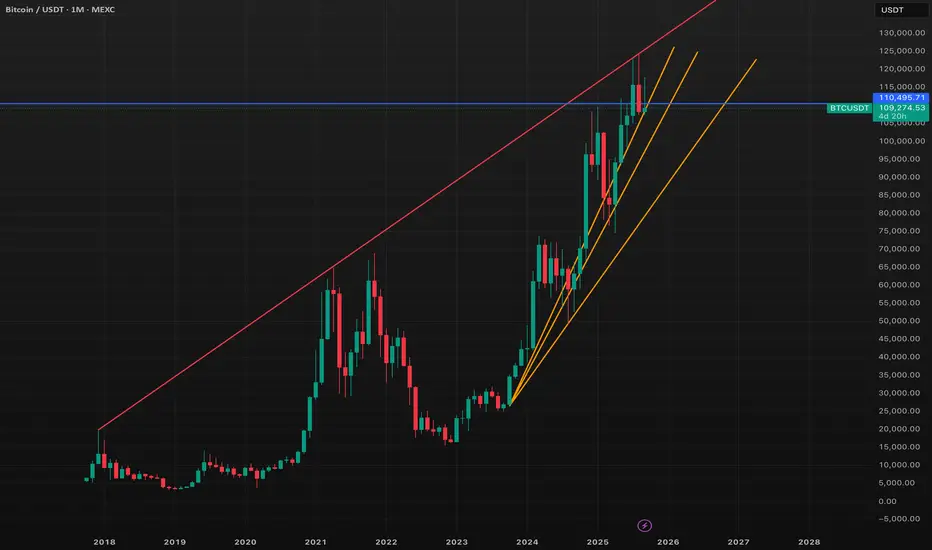
Bitcoin Analysis: Critical Support LevelsBitcoin's current price action presents an interesting technical setup that can be analyzed through the lens of the fan principle. This approach reveals multiple key support levels that deserve attention, particularly the crucial 109-110K zone where Bitcoin currently finds itself.
Understanding the Fan Principle
The fan principle is a technical analysis concept that uses multiple trendlines emanating from a common point, creating successive support and resistance levels. In Bitcoin's case, these fan lines have developed over several years and now present a clear hierarchy of critical price levels that the market must respect or break.
The most immediate and important of these levels sits at 109-110K. This zone represents more than just another support level - it serves as the foundation for Bitcoin's current market structure. How Bitcoin reacts at this level will likely determine the near-term direction and set the tone for what could be a significant move in either direction.
The 8-Year Resistance: Two Rejections and Counting
A critical element in Bitcoin's current technical picture is the 8-year resistance trendline, clearly visible as the red line on the chart. This long-term resistance has proven its significance through price action, having already rejected Bitcoin twice upon contact. These two previous rejections demonstrate the strength and importance of this multi-year technical level.
The pattern of rejection followed by renewed approach is a classic technical setup. Each time Bitcoin has touched this 8-year resistance, it has been turned away, creating a well-defined ceiling that has influenced price action over an extended period. However, repeated tests of resistance levels often lead to eventual breaks, as the selling pressure at these levels can become exhausted over time.
Should Bitcoin manage to hold the current 109-110K support zone and mount another attempt at this 8-year resistance, a successful break would represent a major shift in market structure. Given the two previous rejections, a third attempt that results in a clean break could open the door to new all-time highs, as it would finally eliminate this long-standing technical barrier that has capped Bitcoin's upward movement.
Multiple Scenarios at Play
The fan principle suggests several potential outcomes from the current position. If the 109-110K level holds as support, Bitcoin could use this as a springboard for higher prices, potentially testing and breaking the 8-year resistance. The orange and yellow fan lines extending upward provide potential targets in such a scenario, with projections reaching into 2026 and beyond.
Conversely, a failure to hold the 109-110K zone would shift focus to lower fan support levels. The fan structure provides a roadmap for where Bitcoin might find its next significant support should the current level fail to hold.
Market Structure Considerations
The convergence of multiple technical factors at current levels makes this period particularly noteworthy. The fan principle, combined with the 8-year resistance test, creates a situation where Bitcoin faces both significant support below and meaningful resistance above. This compression often leads to decisive moves in one direction or the other.
The long-term nature of these technical levels also suggests that any major move from here could have lasting implications for Bitcoin's price trajectory. Breaks of multi-year technical levels tend to trigger substantial follow-through in the direction of the break.
Looking Ahead
Bitcoin's position relative to these fan-based support levels and the 8-year resistance creates multiple potential paths forward. The key will be monitoring how price action unfolds around these critical levels, as they provide a technical roadmap for both bullish and bearish scenarios.
The fan principle analysis suggests that maintaining the 109-110K level is crucial for any bullish continuation, while a break of this support could lead to a test of lower fan levels. Meanwhile, any eventual break of the 8-year resistance would represent a significant technical development with potentially far-reaching implications for Bitcoin's long-term trajectory.
As with any technical analysis, these levels provide guidance rather than guarantees, and market participants should monitor price action closely as it unfolds around these critical zones.
Bitcoin Below $109K, Correction or Buying Opportunity?On September 25, 2025 , Bitcoin dropped below $109,000, the lowest point in the past three weeks. The $22 billion options expiration at the end of the month could create short-term selling pressure, but it may also present a recovery opportunity once this pressure eases.
BTCUSDT is trading within a clear downward channel, with lower highs and lower lows . Notably, the price has just faced strong resistance at $109,900, which also aligns with the downtrend line connecting previous highs.
If BTCUSDT cannot break through $109,900, we may see a strong correction towards the nearest support level at $106,000.
With a combination of news and technical analysis, BTCUSDT could continue its downward trend in the near future. Stay prepared and take advantage of the trading opportunities!

BTCUSDT H4 OUTLOOK Lets Goo
We Are Considering Buy Btcusdt Setup On Demand Zone
Liquidity Sweep
Demand Zone
High Probability Setup
Good Luck Guys

Bitcoin Tests Support at $110,500: Will the Downtrend Continue?The chart shows that Bitcoin is in a descending channel, with higher price levels being blocked, creating lower highs. Recent price action has formed a "lower high" pattern and is continuing to move downward.
BTC is currently testing support at the $110,500 level, and if broken, Bitcoin could easily drop to the $109,800 region. This is a level that traders need to watch closely, as if it fails to hold, the price may fall even further.
Recent news about significant liquidations from whales and cautious sentiment from Bitcoin ETFs is pushing the market toward a bearish trend. The actions of large investors, along with the fluctuations of other currencies like the USD, and price adjustments from previous resistance levels further reinforce the downtrend.
Wishing you successful trading!

BTC 110K Low time frame can be the return for Bitcoin📊 Market update low time frame
If there is good news, then BTC should confirm in 4H max.
If btc is able to gain 110K on the low time frame, there is a good chance we can go with BTC to a new uptrend, which could also mean good news for most of the altcoins.
All eyes are on the 10K in the coming time frame for a confirmation.
BTC can make a downtrend move to get volume with a spike to a low time frame, as we know from BTC.
IF BTC moves lower, the low time frame can change to 109800
110K can be the reason for 113K, and a confirmed main trend means a positive BTC
We will follow it step by step.
