BTC/USDT ANALYSIS Long opportunities indicated on the chart. Make sure you will carefully take note of the marked areas and Long BTC there.
Trade ideas

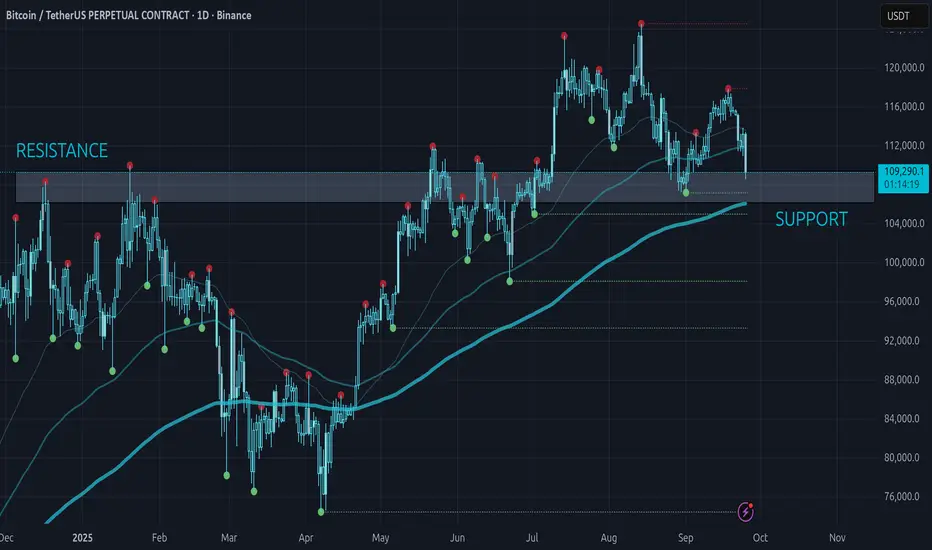
$BTC is retesting the S/R level, don't panic! (yet)Previous resistance often times flips and becomes support.
CRYPTOCAP:BTC is safe until we hold the gray box.
Candles closing below the gray box will be bearish confirmation. Lots of confluence there as with 200EMA on D1 acting as dynamic support level. BINANCE:BTCUSDT.P
Volatility Period: Around September 19th (September 18th-20th)
Hello, traders!
Follow us to get the latest information quickly.
Have a great day!
-------------------------------------
(BTCUSDT 1D Chart)
This volatility period is around September 19th (September 18th-20th).
As this period of volatility progresses, we need to examine the direction in which the price deviates from the 115,854.56-119,177.56 range.
As previously mentioned, the key ranges are 87,814.27-93,570.28 and 104,463.99-108,353.0.
Therefore, if the price falls below 115,854.56, we need to check for support near these key levels.
-
It's perhaps natural for trading volume to decrease after a new ATH (Any New High).
If a new ATH (Any New High) is met with high trading volume, it could indicate a significant amount of profit-taking, increasing the likelihood of a downward trend.
Therefore, I don't think it's wise to interpret the current decline in trading volume as a sign of a decline.
We're using the On-By-Volume (OBV) indicator, which helps us understand the movement of trading volume, so we can roughly gauge the current trading volume trend.
-
The HA-High ~ DOM(60) range on the 1D chart is 115854.56-119177.56, and the HA-High ~ DOM(60) range on the 1W chart is 116259.91-119086.64.
Since these two resistance levels overlap, a breakout above this level suggests a potential surge.
-
Thank you for reading to the end.
We wish you successful trading.
--------------------------------------------------
- This is an explanation of the big picture.
(3-year bull market, 1-year bear market pattern)
I will explain in more detail when the bear market begins.
------------------------------------------------------

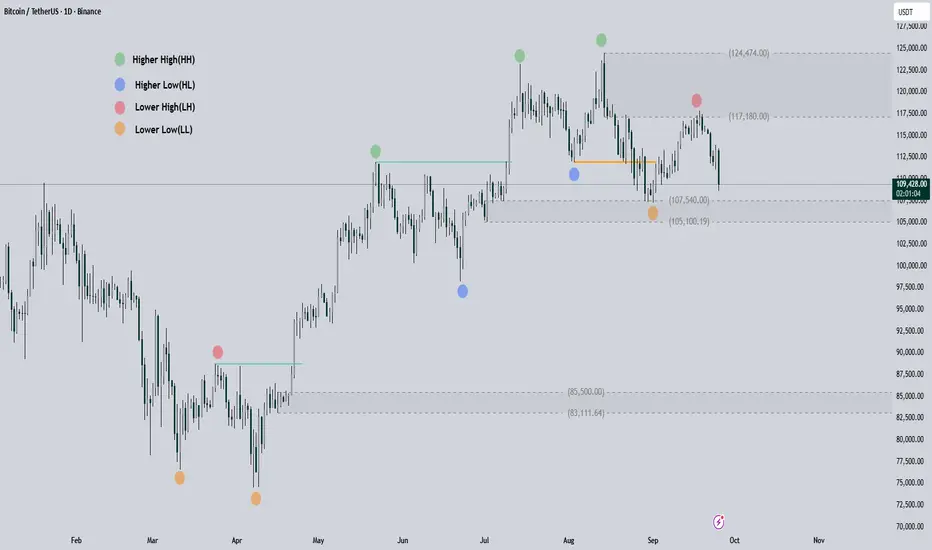
Bitcoin Price Analysis and PredictionIn my opinion, $124k was the highest price BINANCE:BTCUSD would see in this cycle, and the downtrend has started a long time ago.
The colored dots you see on the chart represent the main pivots of the weekly candles that were forming the bullish structure. Now we are seeing this structure being broken one after the other. You can see the key/legend for the colored dots on the chart.
Current Situation
Bitcoin broke the first weekly candle's Higher Low (HL) on August 22nd. Since then, we've seen a Lower Low (LL) and a Lower High (LH) on the weekly chart.
Now, the price is moving back towards that LL to break this LOW and form a new LL.
Last time, we saw good support at $107K and this area could be a support zone this time as well. However, the bearish structure has formed, and we will likely only face temporary reactions. In this area, we will either see the price range or a break of support and the start of a larger trend towards $85k.
Please note that this is just my opinion and it could be completely wrong. Even if it is correct, it might take a long time, or perhaps we'll move towards it with a sharp move!
Activation trigger: 4h-close > 110 286 (KC-Lower)Snapshot (last 4h candle) + what each indicator means
• Price: ~109 332 — current base point.
• VWAP (whole period): ~114 597; z(Price−VWAP) ≈ −2.87 — we are significantly below the "fair" price by volume; such a deviation statistically often leads to rotation to averages.
• aVWAP (anchors): start 114 597, 60d 114 549, from swing low 111 752, from swing high 111 354 — the price is lower than all anchors ⇒ sellers dominate all timeframes; on the rebound, these aVWAPs will be resistances.
• Donchian 20: High 113 900 / Mid 111 230 / Low 108 560 — local frame; return to Mid = standard mean-reversion target.
• Donchian 55: High 117 884 / Mid 113 222 / Low 108 560 — structure of the "older" range; return above Mid changes the medium-term balance.
• Volume Profile (~60d): POC ~115 112, VAL ~109 793, VAH ~120 964 — we are slightly below VAL, i.e. at the lower limit of the “fair” zone; POC often acts as a “magnet” during a stable rebound.
• HVN (dense nodes): ~111.4–112.98, 114.05–115.91, and the POC itself at 115.11 — this is where the market likes to slow down/consolidate.
• LVN (thin spots): cluster ~119.9–123.4 — in case of a sharp up-squeeze, the path here is "slippery".
• RSI(14): ~26.4 — oversold: increases the chances of a technical rebound, but with a strong trend, the price may "creep" near the edge.
• MFI(14): ~29.9 — oversold, taking into account volumes; confirms the likelihood of a bounce.
• CMF(20): ~−0.06 — cash flow is slightly negative; a sustainable recovery requires an exit of ≥0.
• MACD(12/26/9): line −886 < signal −731, hist. −155 — bearish momentum holds, but watch: compression of the histogram will give an early weakening signal.
• ADX/DMI(14): ADX ~43.98; +DI 8.0 / −DI 39.8 — strong downward trend (−DI ≫ +DI).
• ATR(14): ~1 140$ — typical 4h swing; useful for buffers and stops.
• Keltner(20,±2ATR): Upper 114 547 / Mid 112 416 / Lower 110 286 — price below KC-Lower → high probability of a medium return to Mid at the first recap signal.
• Bollinger(20,2σ): Upper 114 162 / Mid 112 271 / Lower 110 381 — below BB-Lower; typical mean-reversion — to BB-Mid ~112 271.
• BB-Squeeze: OFF — volatility is already revealed; this is not a accumulation mode.
• OBV z-scores: z50 −1.43 / z100 −2.04 / z200 −2.48, OBV ROC(10) ≈ −1% — volume-wise, the drop was supported (distribution), and there is still little fresh influx of buyers.
• Open Interest: ~67 331, z(168) ≈ −1.43, ROC(5/10) ≈ +1% / 0% — OI is low relative to history, slightly increasing on decline ⇒ shorts were added/held → risk of short-squeeze on recap.
Latest divergences (auto-detector)
• RSI: bullish — 22 Sep 07:00 → 22 Sep 19:00, 22 Sep 19:00 → 23 Sep 19:00
• MACD: bearish — 15 Sep 07:00 → 16 Sep 19:00, 17 Sep 07:00 → 18 Sep 03:00
• OBV: bearish — 16 Sep 19:00 → 17 Sep 07:00, 17 Sep 07:00 → 18 Sep 03:00
• MFI: bullish — 22 Sep 07:00 → 22 Sep 19:00, 22 Sep 19:00 → 23 Sep 19:00
⸻
What does it mean now
1. Mode - strong downtrend (ADX≈44, −DI ≫ +DI), but RSI/MFI oversold, the price is below KC/BB-Lower and significantly below VWAP (z≈−2.9). The combination "strong trend + extremum" often gives a rotation to the averages if a recap signal appears.
2. Profile: we are at VAL, under the HVN clusters 111–113 and 114–116; a stable rebound usually pulls towards BB/KC-Mid (~112.3–112.4) and further towards POC 115.1.
3. Derivatives: OI slightly ↑ on the fall + OBV z neg. — a continuation downwards is possible, but at the same time, the potential for short-squeeze increases with the first quality recap.
⸻
Key levels
Resistances: 110 286 (KC-Lower) → 111 230 (Donch-20 Mid) → 112 271/112 416 (BB/KC-Mid) → 113 222 (Donch-55 Mid) → 114.0–115.9 HVN → 115 112 (POC) → 117 884 (Donch-55 High) → 120 964 (VAH).
Supports: 110 381 (BB-Lower) → 108 560 (Donch-Low 20/55) → local dips inside ~107–108 (target = 1×ATR below Donch-Low, by reaction).
⸻.
Scenarios and triggers (not financial advice)
A) Basic - rotation to the middle (111.2 → 112.3/112.4)
Status: not activated yet (close below KC-Lower).
• Activation trigger: 4h-close > 110 286 (KC-Lower) and better > ~110 856 (KC-Lower + 0.5×ATR; ATR≈1 140) + confirmations: RSI > 30, MFI > 35, hist. MACD↑, CMF → 0.
• Targets: 111 230 → 112 271/112 416 → 113 222 on impulse.
• Invalidator: quick return < 110 286 after recap, especially when OI ROC+ and OBV z50 ≤ −2.0.
B) Continuation of the downward trend
• Trigger: 4h close < 108,560 (Donch-Low) with ADX ≥ 40, OBV z50 ≤ −2.0, OI ROC+ on the fall.
• Targets: extension by ~1×ATR below (target ≈107.4k) with intermediate fixes at round 108k/107.5k; then watch the reaction.
• Invalidator: re-take > 110 286 and hold.
C) Short-squeeze (acceleration up)
• Trigger: break and hold > 113 222 (Donch-55 Mid) or fast "V" return > 114.0–114.6 (HVN / KC-Upper zone) with a decrease in OI and an increase in OBV.
• Goals: 114–116 HVN → 115 112 (POC) → 117 884 → by inertia to 120 964 (VAH).
• Invalidator: fake breakdown and return < 112.3.
⸻
Tactics (example of logic)
• Impulse long (by base): after closing > 110 856. Partial fixation at 111 230, main — at 112.27/112.42; possible take-profit up to 113 222. Stop — under 110 286 (or under the minimum of the candle-recap) with a buffer of 0.5×ATR ≈ 570$.
• Reversal long (conservative): from BB/KC-Lower 110.3–110.4 only when demand reacts (RSI/MFI↑, CMF→0/+, hist. MACD shrinks). Targets: 111.2 → 112.3/112.4.
• Contra-trend short: on rejection 112.3/112.4 → 113.2 at RSI<50, hist. MACD↓, OI ROC+ — targets: 111.2 → 110.3; stop — over 113.4–113.6.
• Squeeze tactics: when reteking > 113.2 and OI falls — trailing by aVWAP(60d)/EMA20, targets 114–116 → 115.1 (POC).
⸻
Briefly: what to expect
The basic setup is a technical rotation to the middle (111.2 → 112.3/112.4), but it will only be activated after the recap > 110.3–110.9.
• Confirm the recap — a move to 112–113.2 is likely, and if strong, to HVN/POC 114–115.1.
• Breakthrough of 108.56 on the rising OI/falling OBV — continuation downwards with an extension of ~1×ATR.

Corrections Are Temporary, Bullish Trend Is NotWhile the price is correcting now, it's important to remember this is likely just a healthy consolidation before the next move up. The overall trend is still bullish, with higher highs being made over time, even through corrections.
So, don't let short-term dips cloud your judgment. Focus on the long-term trend, as these corrections can present opportunities to accumulate at key support levels.
Stay tuned for more updates
#PEACE ✌

BITCOIN DAILY CHARTTHE DAILY chart just broke a daily support and the close will be continues sell into current demand at 107.4336
if sellers continue to sell they will definitely come to 100-99k demand floor of the bullish flag pattern, it was our previous supply and could become our current demand on probability
shortly below that zone will be a clean BAR ( BREAK AND RETEST ZONE ) as illustrated on the chart for clarity and context.
my last demand which could be adjusted will be in the zone of 88k-90k before the rain.
note ;trading is 100% probability ,pls manage your risk.
GOODLUCK
#BITCOIN #BTCUSDT

$BTC More bleeding to come. Will cross SMA200BTC is in a downward channel and is going from SMA50 to SMA200 (down!). We'll see what happens, but Fridays it's typically softer and over the weekend less upside (if there is any at this point). Expect to drop and consolidate around SMA200 low 100k, and could cross 100k very soon. CBOE:MSTZ CBOE:UVIX are nice "insurance" policies right now :)

BITCOINBITCOIN, after break of a daily demand floor ,we are seeing that sellers are holding the market and i think they will continue to sell into the the bullish flag breakout supply roof as a new demand floor.
i will give buy sell position soon.
#bitcoin #btc

Bitcoin: What's Next?My Philosophy & Approach
My foundation is the pure chart. I don't consider news or outside opinions, as I see them as secondary. All primary information is already in the price. Of course, no one can give a 100% forecast. The crypto market can fall sharply just as it can rise sharply. This uncertainty must be accepted as the norm. This is why I work from risk, not from expectations.
General Market Sentiment & BINANCE:BTCUSDT.P Analysis
In my opinion, a bearish sentiment prevails in the market. After its drop, Bitcoin isn't having a deep correction but is re-testing the level where the decline stopped, which is a sign of seller pressure. Currently, the price is grinding the 111,959.5 level, but I don't see a strong reaction from buyers even on false breakouts. This indicates their weakness. Although the trading zone of Sept 3-10 creates an obstacle, I am still leaning towards a further decline.
Asset Selection Criteria in Current Conditions
After high volatility comes a dangerous time, so I am especially careful in selecting assets based on two criteria:
Strength Against the Market: Assets that are rising despite the general fall. This indicates the presence of a large buyer.
A Clear Stop: Assets that, after a sharp decline, stopped precisely at a level where large capital absorbed all sales.

#BTC/USDT THE ONLY BITCOIN CHART YOU NEED!BTC : Almost There!
BTC is currently following the trajectory shown in my last chart. It took some time, but it’s playing out exactly as expected. Sooner or later, a bounce is coming — there’s no reason to panic unless we break below $103.5K, which is the key support level.
You need to understand that only when money moves out of BTC and big-cap alts will THE MID AND THE SMALL CAPS will have their time to shine. And sooner or later, you'll realise all this happened for good if you played it right. Even if not, many opportunities are coming ahead.
You’ll see this happen soon.
MY MESSAGE TO YOU ALL:
If you've been in crypto for a few years, you know this moment: it’s when the market is on the brink of a big move.
Be patient, it won’t happen overnight, but sooner or later, it will.
If you're currently in the red, take it as a lesson. It happens to the best of us. I've had four positions stopped out, too. It could have been worse if I hadn’t had a STOP LOSS in place.
The silver lining? I can re-enter at a better price.
A lesson I’ve learned over the years: STOP LOSS is a life-saver.
Stay strong and don’t give up right before the big opportunity we’ve all been waiting for.
Opportunities are ahead, manage your risks and remember to take a break, touch some grass. I’m with you.
I'll drop more charts shortly.
Stay strong, folks.
WAGMI!
Do hit the like button, and if you have any doubts, questions, or chart requests, drop them in the comments.
Thank you
#PEACE

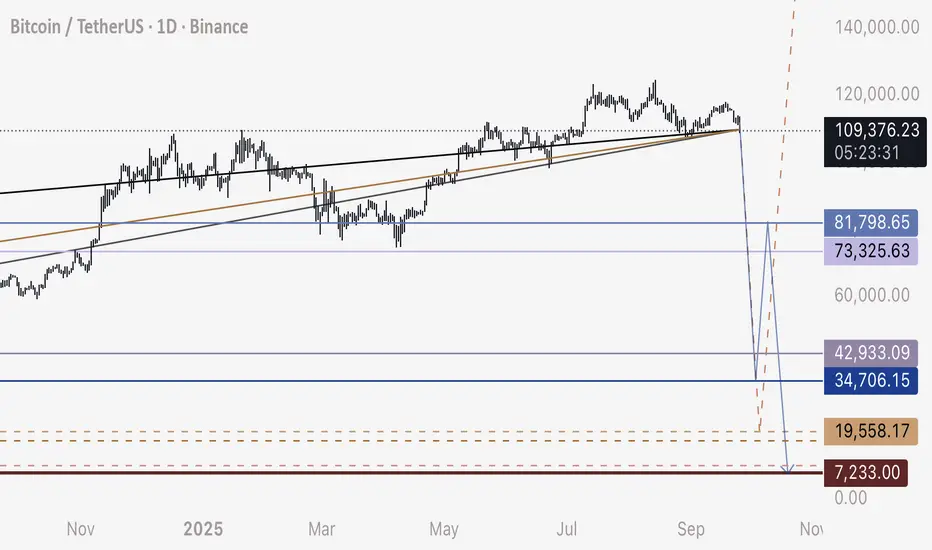
Bitcoin Short Update - Updated Targets and Corrective MoveHi all,
Short update on my BTC short - with updated numbers and anticipated zig zag correction.
I’m updating frequently because this drop will happen extremely fast. Only those who are prepared before hand will be able to take advantage.
110,000 to 35,000
35,000 to 81,000
81,000 to 8,000
Take profit roughly 5,000 below or above each respective pivot point.
Best of luck and thanks to those who support my ideas.
Bitcoin Drops Below $108.6K — What’s Next?
Bitcoin was holding near $115K, but now it's fallen below the $108.6K level. The next support is around $105K. If that breaks, we could see further downside toward $100K.
To turn bullish again, Bitcoin needs to reclaim $112K as support. If that happens, it could retest $115K–$120K.
#PEACE

Bitcoin, what's next?The market needs more FOMO. Right now, people are scared to buy, there’s no hype, so the price needs to rise. But before that, a sudden 10-15% drop could happen, and the market would recover quickly as fear fades. (Keep your eyes on fan tokens)

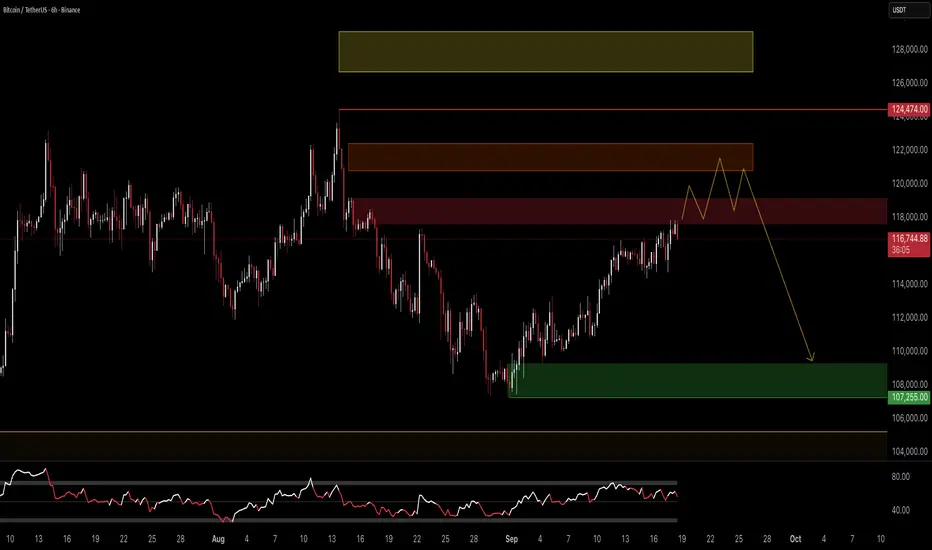
Bitcoin | Short | 6Hrs This technical analysis is for informational and educational purposes only. It does not constitute financial advice. Remember to always research and consult with a professional before making investment decisions. Good luck! 📈💼🚀
BTC 25.09.25I'm looking for an accumulation in this area to turn the distribution from last week into a bigger one that takes out the extreme liquidity. BTC already had an accumulation here that hit it's target, distributed and deviated the low again. If this is intended to be a bigger accumulation it will need more time to develop. I'm waiting for model 2 POI's to get created and confirmation/invalidations of this idea. Confluence via USDT.D would be nice.

BtcusdtIf 108 can’t hold then more pain will come . Market in fear mode I think this support holds for a bounce rsi on the small timeframes is getting oversold . I think we are in a downtrend channel so if it breaks down buy at bottom

Can't say I didn't warn you! BTC and VIXI hate to say it, but it will be worse than I thought! I've been telling folks to watch out as history repeats itself and the market is way too hot esp. in this crappy environment. There is more room to bleed. If you have a position, take the inverse like this second! CBOE:UVIX CBOE:MSTZ $ BTCZ could be nice plays

Bitcoin Setup: Eyeing CME Gap at $113KBitcoin( BINANCE:BTCUSDT ) is currently trading in a Heavy Support zone($112,000-$105,800) and near the Support zone($110,920-$109,900), Support lines, Potential Reversal Zone(PRZ) , and Cumulative Long Liquidation Leverage($110,430-$109,660).
In terms of Elliott Wave theory, Bitcoin seems to have completed a microwave 5, the reason for today's drop was the correction in the SPX500 index( SP:SPX ) and the release of US indices(Final GDP q/q, Unemployment Claims).
Also, we can see the Regular Divergence(RD+) between Consecutive Valleys.
I expect Bitcoin to move back above 100_EMA(Daily) because the breakout volume was not enough, and attack the Resistance lines. If the Resistance lines are broken we can expect the CME Gap($113,380-$113,275) to fill.
First Target: $112,600
Second Target: $113,280
Stop Loss(SL): $109,280
Cumulative Short Liquidation Leverage: $114,866-$113,720
Please respect each other's ideas and express them politely if you agree or disagree.
Bitcoin Analysis (BTCUSDT), 1-hour time frame.
Be sure to follow the updated ideas.
Do not forget to put a Stop loss for your positions (For every position you want to open).
Please follow your strategy and updates; this is just my Idea, and I will gladly see your ideas in this post.
Please do not forget the ✅' like '✅ button 🙏😊 & Share it with your friends; thanks, and Trade safe.

$BTC Bearish Short-Term (September 25, 2025)BINANCE:BTCUSDT
CRYPTOCAP:BTC Bearish Momentum with Potential Short-Term Bounce
Overall Price Trend: The price has dropped from highs around 118,000 USDT at the start of the period, now reaching about 109,000-110,000 USDT. This is evident from the red (bearish) candlesticks at the end of the chart, with a strong drop in recent hours. There's a series of red signals indicating selling pressure.
Ichimoku Cloud:The price is fully below the cloud, which is a strong bearish signal—suggesting the downtrend is dominant.
The Tenkan-sen (red line) and Kijun-sen (blue line) have crossed bearishly (red below blue), and the cloud is thick and reddish (bearish). The Kijun-sen is declining, confirming the downward momentum.
RSI (Relative Strength Index): In the bottom panel, RSI has fallen to low levels around 24 (oversold—over-sold), then recovered slightly to 30-40. This shows the market is fatigued from selling, but there's no strong rebound signal yet. An RSI below 30 usually warns of a potential bounce, but in this bearish context, it could just be temporary relief.
Volume and Momentum: From the candlesticks, volume appears high on the red drops, reinforcing strong selling. No clear signs of broken support (around 109k looks like a possible zone, but it's being tested).
Analysis Summary: The chart is Bearish overall. Downward momentum dominates, with the oversold RSI potentially leading to short-term relief, but not a major reversal.Forecast Until Tomorrow (September 26, 2025):Based on the 2H chart, the bearish trend may continue in the coming hours, but with a small chance of rebound due to the oversold RSI.
Here are the possible scenarios:Base Scenario (Bearish, 70% probability): Price could test lower levels around 107,000-108,000 USDT if selling persists (especially if the cloud remains resistant). This would happen without a positive Ichimoku crossover or a strong green candle.
Alternative Scenario (Mild Bullish, 30% probability): A short-term bounce to 111,000-112,000 USDT, if RSI climbs above 40 and price breaks the Tenkan-sen. This would be temporary, without changing the broader bearish trend.
To monitor, watch key levels: Support at 109k, resistance at 112k.

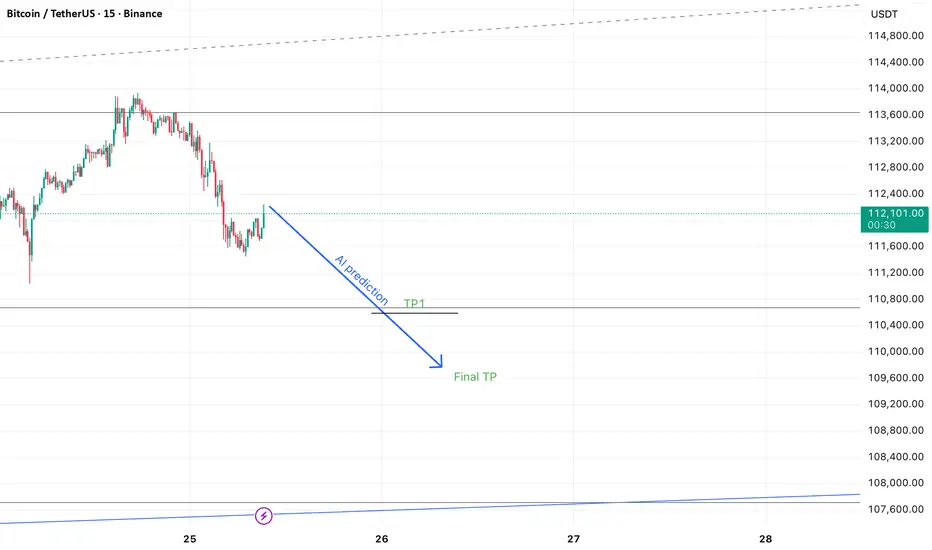
Deep Learning Model for 24-Hour BTC Price PredictionHi everyone,
I’ve developed a deep learning AI model designed to predict BTC's price movement over the next 24 hours on the 15-minute timeframe.
It’s important to note that this model does not directly provide exact entry points for trades. Instead, it indicates the likely direction of the market, meaning you’ll still need basic trading knowledge to apply it effectively.
After testing it over the course of one month, I achieved a success rate of around 90% in my trades when using the model as part of my strategy.
The model was trained using the following features:
Time-related: Hour, DayOfWeek
Price & volume lags: Close_lag_1, Close_lag_2, Close_lag_4, Close_lag_8, Close_lag_12, Volume_lag_1, Volume_lag_2, Volume_lag_4, Volume_lag_8, Volume_lag_12
Moving averages & statistics: MA_4, Std_4, Dist_MA_4, MA_16, Std_16, Dist_MA_16, MA_48, Std_48, Dist_MA_48, MA_96, Std_96, Dist_MA_96
Technical indicators: Return_log, MACD, RSI
Hourly Forecast for the Next 24 Hours
2025-09-25 10:00:00+00:00 111550.165640
2025-09-25 11:00:00+00:00 111376.971911
2025-09-25 12:00:00+00:00 111228.010503
2025-09-25 13:00:00+00:00 111113.808253
2025-09-25 14:00:00+00:00 111015.461229
2025-09-25 15:00:00+00:00 110924.218881
2025-09-25 16:00:00+00:00 110836.693056
2025-09-25 17:00:00+00:00 110752.812431
2025-09-25 18:00:00+00:00 110671.121547
2025-09-25 19:00:00+00:00 110589.284377
2025-09-25 20:00:00+00:00 110507.299785
2025-09-25 21:00:00+00:00 110426.231097
2025-09-25 22:00:00+00:00 110347.648529
2025-09-25 23:00:00+00:00 110272.293736
2025-09-26 00:00:00+00:00 110200.252059
2025-09-26 01:00:00+00:00 110128.568457
2025-09-26 02:00:00+00:00 110076.551644
2025-09-26 03:00:00+00:00 110033.237232
2025-09-26 04:00:00+00:00 109989.062884
2025-09-26 05:00:00+00:00 109942.853975
2025-09-26 06:00:00+00:00 109895.090788
2025-09-26 07:00:00+00:00 109846.533566
2025-09-26 08:00:00+00:00 109797.842122
$BTC Bearish Short-Term (September 24, 2025)BINANCE:BTCUSDT
Summary of Price Action:
Recent Movement: In the last 24 hours, BTC has dropped by about 0.5% - 0.9%, reaching $112,479 this morning (UTC). This follows a slight recovery from $107,200 on September 23, but it's now retesting support at $112,000. In your 2H chart, we see a series of red candles (bearish) indicating selling pressure, with trading volume increasing during the decline, confirming seller interest.
Key Levels:Support: $112,000 (immediate level, tested today) and $110,000 - $107,200 as a stronger lower zone. If $112,000 breaks, we could see a drop toward $109,000.
Resistance: $115,000 - $117,000 (strong level with recent rejections). A break above $117,000 would signal recovery toward $120,000.
Volume and Liquidity: 24-hour volume is around $52 billion, with large liquidations ($1.7 billion in the last 24 hours), mostly long (bullish) positions. This shows smaller traders suffering from bearish pressure.
MACD Indicator Analysis :
In the chart you sent, the MACD line (blue) is slightly above the signal line (orange), but the histogram is turning negative (red bars growing). This indicates a bearish divergence – the price is weakening while momentum is losing strength. MACD is below the zero line, confirming a weak short-term trend. RSI (at similar levels) is around 44-55, signaling lightly oversold, but still without strong buy signals.
Overall Trend:
Bearish Short-Term, Bullish Long-Term
Short-Term (Today/Next Day): Bearish. The price is consolidating in a bearish channel, with predictions for further downside toward $110,000 - $107,000 today or tomorrow, due to fear sentiment (Fear & Greed Index at 43) and pressure from liquidations. This matches your chart, where we see a potential inverse "head and shoulders" pattern (but still uncertain). Avoid immediate buys – wait for confirmation below $112,000 for shorts or above $115,000 for longs.

BTC at Key Level: 110k Break or Bounce?Bitcoin is testing the 110,000 support zone after a strong bearish move.
🔹 If price closes below 110k → next downside targets are 108k – 106k.
🔹 Short-term bounce is possible towards 113k – 114k, but trend remains bearish unless we reclaim 116k+.
⚡️Key focus: Watch the reaction at 110k — it will decide the next big move.
