BTC daily chartThis is my analysis for BTC,it is on the daily chart, no need to panic, this is a very healthy correction.
BTCUSDT.3L trade ideas

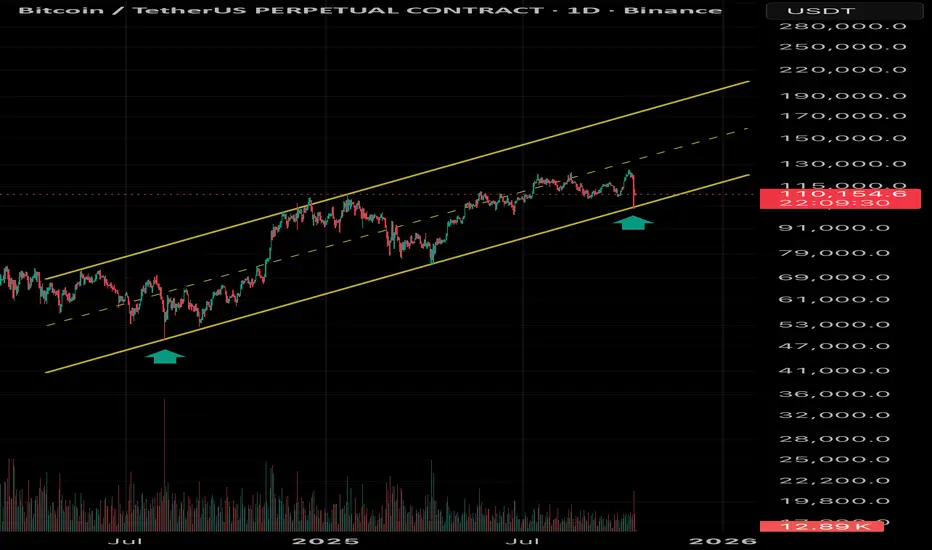
BTCUSD – Testing the Channel Support | Key Decision Zone AheadBitcoin has just touched the lower boundary of its long-term ascending channel.
If this support holds, the next major target could be the upper channel zone near $190K–$210K.
However, a confirmed breakdown below this trendline would likely mark the beginning of a multi-year downtrend, ending the current bullish structure.
Key Levels:
• Support: $108K–$110K
• Resistance: $190K–$210K
BTCUSDT: Trend in 4-H time frameThe color levels are very accurate levels of support and resistance in different time frames.
A strong move requires a correction to major support and we have to wait for their reaction in these areas.
So, Please pay special attention to the very accurate trend, colored levels, and you must know that SETUP is very sensitive.
BEST,
MT

Hmmm BitcoinfulBe careful. Bitcoin may have reached heavy resistance. If so, price may drop as low as the strong support. Time will tell.
My previous prediction on crypto as a whole is quite bullish but bear season may be in. I think especially if Bitcoin breaks below $107,000

TradeCityPro | Bitcoin Daily Analysis #187👋 Welcome to TradeCity Pro!
Let’s go over Bitcoin’s analysis — today, Bitcoin has recorded a new ATH. Let’s review the market conditions together.
📅 Daily Timeframe
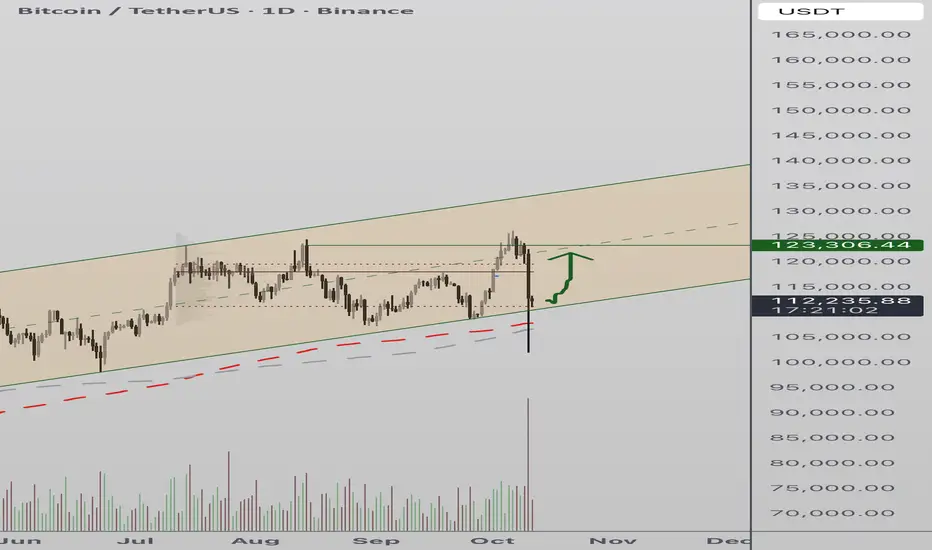
In the daily timeframe, Bitcoin is moving inside an ascending channel with a steady upward slope.
⭐ After a corrective move from the top of the box, the price made a fake breakdown of the channel’s bottom and then, with the bullish momentum that followed, moved upward and managed to set a new ATH.
✔️ During the correction, the volume was decreasing, but after the price was supported at the key support zone and the fake breakdown occurred, buying volume entered the market.
✨ The main confirmation of the bullish continuation could be taken after breaking above 117056. Currently, the next confirmation trigger is a price stabilization above 123433.
💥 In my opinion, since RSI is getting rejected from the 70 level and the price has reached a strong resistance zone, there’s a high chance that the market will range below this resistance for a few days to test it.
🧩 At the moment, the main RSI resistance level seems to be 75.38 — if this level breaks, the main market momentum could start, leading to a sharp move upward.
📊 It’s completely normal for the trend to show weakness after reaching an ATH, because this level is Bitcoin’s largest supply zone. These wicks hitting the resistance zone don’t necessarily mean trend weakness — it’s typical for the price to form such candles when testing its all-time high.
🔑 What really matters is how the price reacts in the next few attempts at this zone, which will tell us whether we have an actual trend weakness or not.
💫 Right now, the most important support Bitcoin has built is around 107000. If a bearish move begins, the first confirmation of a downtrend will be breaking this area. However, the main confirmation of a full bearish reversal would be the break of 100961.
🎲 Overall, since the price is currently at the top of the market, finding precise triggers on Bitcoin is difficult. But considering Bitcoin dominance has the potential to drop, altcoins could provide excellent trading setups in the coming days if that dominance decline begins.
❌ Disclaimer ❌
Trading futures is highly risky and dangerous. If you're not an expert, these triggers may not be suitable for you. You should first learn risk and capital management. You can also use the educational content from this channel.
Finally, these triggers reflect my personal opinions on price action, and the market may move completely against this analysis. So, do your own research before opening any position.

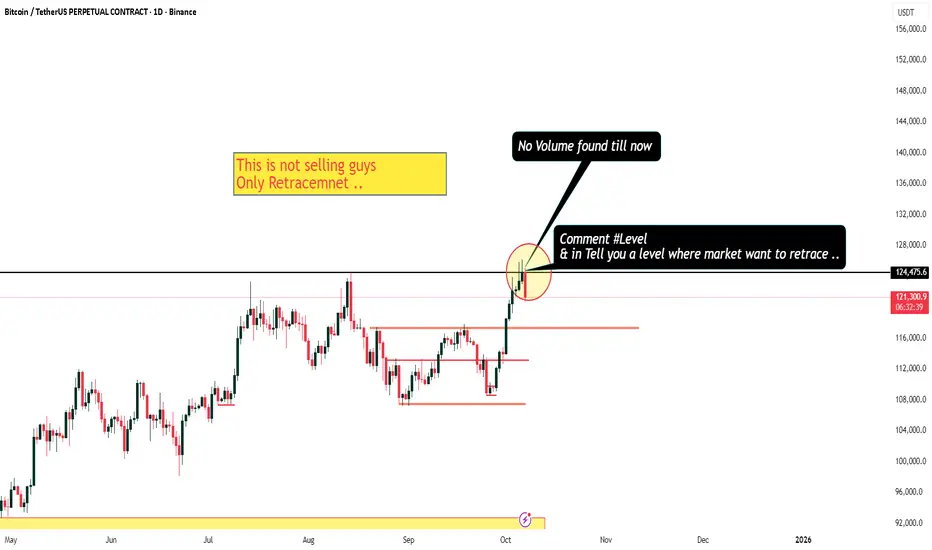
Chekout my marked & Level for Next move #BitcoinHello trader's
Here is next some analysis for bitcoin move
Not till i found that much liquidity for selling
it's only a retrcement ..
#BITCOIN SUNDAY ANALYSIS $BTC the daily and monthly charts are#BITCOIN SUNDAY ANALYSIS
CRYPTOCAP:BTC the daily and monthly charts are now confirming that view. Bitcoin is trading around 123K, right at the upper resistance zone that has triggered every major correction since 2018.
🔸 Weekly Chart View:
BTC has once again touched the long-term trendline that has acted as a selling for every bull cycle top (2018, 2021, and now 2025). Each red arrow marks a rejection, and this latest test looks no different. Until we see a clean weekly close above this trendline, the risk of another major pullback remains high.
🔸 Daily Chart View:
On the lower timeframe, price is trading inside the green supply box between 110K and 125K, the same area that rejected BTC multiple times this year. Structure remains weak, holding below 125K still high chances of big correction.
And it’s not just the trendline or resistance we’re also seeing typical top signals: overly bullish headlines, extreme optimism, and calls for “1M BTC soon.” These usually show up near market tops, not bottoms.
📉 My Trade:
I’m still holding my shorts. All limit orders are filled and my average entry is around 122K. I’ll share updates if I make any changes or close the position.
📌 Downside Targets:
105K → 100K → 95K → 90K

TradeCityPro | Bitcoin Daily Analysis #194👋 Welcome to TradeCity Pro!
Let’s analyze Bitcoin today, the market has calmed down a bit, and we can perform some analysis.
⏳ 1-Hour Timeframe
In the 1-hour timeframe, Bitcoin has reached a support level around $109,000 and has shown a reaction to this level.
⭐ After the heavy drop that occurred two days ago, the open interest and market volume have decreased significantly, which clearly indicates that market participants are currently indecisive.
✨ Yesterday, the price reacted to the support zone on Bitcoin, and a significant resistance was created around $112,420, which it has now reached again.
💥 The RSI oscillator has finally moved out of the Oversell zone, and it’s currently below the 50 level.
🧮 Although there’s still fear and a bearish momentum in the market, breaking the $112,420 resistance could be a very risky long trigger.
✔️ Personally, I’m waiting and observing. However, for those who like to open positions every day, breaking this resistance is the only long trigger I can provide.
💡 For a short position, we could enter after the price breaks below the level. I’m passing on this position for now and will wait for a confirmation to search for a short trigger after the price stabilizes below this zone.
❌ Disclaimer ❌
Trading futures is highly risky and dangerous. If you're not an expert, these triggers may not be suitable for you. You should first learn risk and capital management. You can also use the educational content from this channel.
Finally, these triggers reflect my personal opinions on price action, and the market may move completely against this analysis. So, do your own research before opening any position.

TradeCityPro | Bitcoin Daily Analysis #195👋 Welcome to TradeCity Pro!
Let’s move on to Bitcoin analysis. Yesterday, price started an upward move, so let’s see what triggers we have today.
⌛️ 1-Hour Timeframe
Yesterday, price found support at our key zone and also activated the 112,420 risk trigger we had identified.
✨ If you opened a position, it’s not a bad time to take profits, since this was a risky setup, and such positions should be managed quickly.
🧮 Currently, a resistance high has formed around 115,698. If this level breaks, price could continue its upward movement.
💫 As long as price stays above 112,420, this trigger remains active and can be used to open positions.
✔️ For shorts, I personally won’t be taking any until price breaks below 107,000 and stabilizes under that zone.
❌ Disclaimer ❌
Trading futures is highly risky and dangerous. If you're not an expert, these triggers may not be suitable for you. You should first learn risk and capital management. You can also use the educational content from this channel.
Finally, these triggers reflect my personal opinions on price action, and the market may move completely against this analysis. So, do your own research before opening any position.

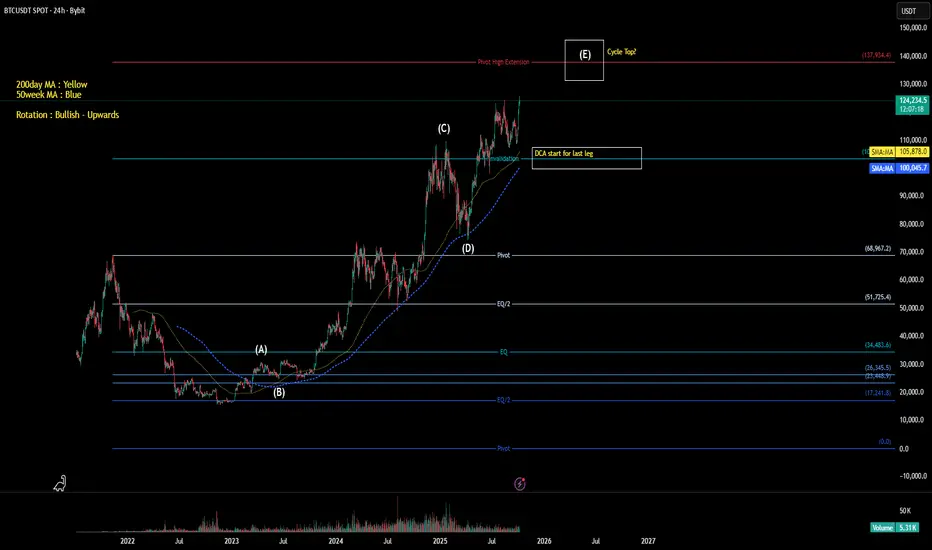
BTC Cycle Target 136–155K | Dominance, Alts, and Strategy Map🔹 Elliott Wave Outlook
According to my Elliott Wave projections, the current Bitcoin cycle is expected to end around 136K–137K.
Historically, past cycles showed an 8–10% deviation, which extends the possible top range to 136K–155K.
🔹 Q4 / Santa Rally View
For a short-term window (Q4 / Santa period), altcoins could outperform Bitcoin — but selectively.
There are over 35 million altcoins, and liquidity cannot support them all.
Focus on:
Strong market structure
Historical trend data
Consistent hold above the 200MA
Only a few alts will actually capture capital rotation.
🔹 Bitcoin Dominance Watch
BTC.D could rise toward 60–62% before a major shift.
Until that happens → no rush for broad alt exposure.
Patience will give better entries.
🔹 Strategy Zone
If Bitcoin holds its bullish structure, a pullback toward 95K–105K would be an excellent long-term buy zone.
If structure breaks, hold your current positions and hedge when you spot local weakness or reversal patterns.
⚠️ As always — this is not financial advice. Manage risk and stay adaptive.
BTCUSD NEW OUTLOOK According to H1 analysis gold market running in buying pressure from last few days now market almost at RESISTANCE LEVEL market will soon touch the resistance level and it will falling soon
you have good chance to go sell from resistance level dont be greedy
TRADE AT YOUR OWN RSK
REGARD ALBERT

Bitcoin Reclaims Channel Support After Sharp Liquidity CascadeBitcoin recently experienced a sharp correction, sweeping through major swing lows in a widespread liquidity cascade. Despite the heavy drawdown, the market has shown early signs of recovery, with price action reclaiming the lower boundary of the trading channel. This development could set the stage for a short-term relief rally — provided the reclaimed level holds as support.
Key Technical Points:
- Channel Reclaim: Price has recovered the lower boundary of the trading channel after a liquidity sweep.
- Fresh Structure: The current rebound remains early-stage and requires further confirmation through consolidation.
- Relief Rally Potential: Sustained support above the channel low could lead to a bullish rotation toward higher levels.
Following the liquidation-driven drop, Bitcoin has stabilized above the channel’s lower limit — a critical technical threshold for directional bias. This region now acts as a pivot between continuation lower or recovery toward the mid-range. Market structure suggests that post-liquidation consolidations often trigger countertrend rallies as selling pressure exhausts and new buyers step in.
For this scenario to unfold, Bitcoin must continue closing candles above the reclaimed level while volume and momentum gradually improve. A sustained defense of this area could push price action higher into mid-range targets, signaling the beginning of a broader recovery. However, if the market fails to maintain this base, another sweep of recent lows could follow before a more stable reversal forms.
Complete system for Day & Swing TradersHey whats up traders,
Today Im going reveal simple but effective way to analyze and trade any markets - Stocks, Indices, Forex and Crypto. This thing works on everything because it's based on liquidity manipulations.
It's 100% mechanical structured aproach with fixed targets and defined. So unlike traders who trade various patterns and have on charts different patterns and diagonal subjective lines, you can backtest it and measure its and yours execution performance to get your statistical data for Risk Reward and Winning Ratio.
‼️Once you obtain such data from data sample large enough you will also solve biggest trading problems - FEAR, GREED and OVERTRADING. Why ?
📊 Because if you know you win rate is 60 - 70 % trades with RR 2.3 with aprox. 4 trades in a month per instrument, why would you then do following?
Try to look for trade every day when there is not your setup.
Fear open next trade after few losses?
Open huge gamble trade if you know 30% of trades can be loss
Try to hold for unrealistic target if you know most of your trades hit 2.5 RR
Try to pass prop challenge in one trade ?
... and many more psychological and undisciplined mistakes which discretional pattern traders without EDGE and statistical data about their strategy are doing.
🧠 Having mechanical system with backtested data is your EDGE.
💪 That is what makes you DISCIPLINED TRADER.
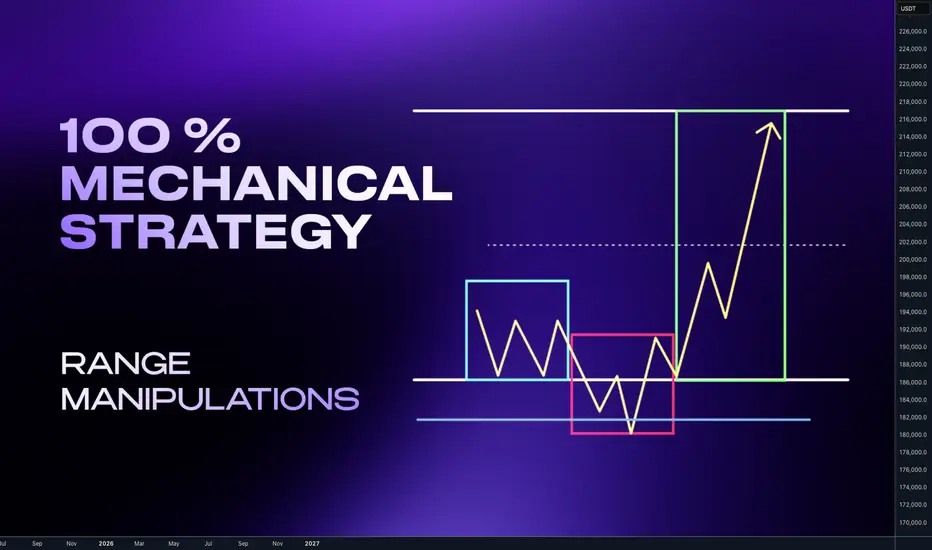
🧩 Basic Concept
Im looking for the fake break out of the range. Whether we call it manipulation or Stop hunt. It really doesn't matter. The idea is that once big candle is created it creates fomo and break out traders are entering continuation. I trade against them.
📍Bullish continuation setups
Model 1 - Entry after manipulation - 50% target
Model 2 - Entry on pullback on level between 61.8 - 80% pullback
📍Bearish Continuation setups
Model 1 - Entry after manipulation - 50% target
Model 2 - Entry on pullback on level between 61.8 - 80% pullback
🧩 Manipulation phase
is key for this concept. Without it happening, institutional move cant happen. Why ? Market makers are not looking to stop hunt our stop losses. They dont care about your or mine stop losses even if we trade 100 lots. Most of the brokers are B-Book anyway. But they are seeking the liquidity and they are placed above the highs and lows. You dont even need to read order book or book map to know it. To understand liqudity better read this post below
Now you understand after the liquidity was swept. Big players have guns loaded and the move can start. This is what we want to participate. But !! What I have just shown you are patterns. Without adding them in to the right context with the market they will not have highest winning ratio. You must be selective. Basically you want to:
📍Down Trend - Trade Stop hunts above the highs
📍Up Trend - Trade Stop Hunt below the lows
In other words we want be buying lows and selling highs. 🧪 How to do it I explained in this post below 📍 Top- Down analysis
Before we go to the refined entries we must understand top down analysis and what to look for on the charts. Never start with LTF. You always must go with top Down analysis.
🧩 TOP Down analysis
HTF Timeframe for the trend
ITF - Timeframe - Ranges and Key Levels
LTF - Timeframe Profiling and entries
Once we analyze the trend define our range on our timeframe we are looking for manipulation before we go to entries remember this:
🧪Range is mostly created close the key level. If any candle close above the range - Its makes it invalid.
🧪We want see and trade wicks above the range, there you are looking for LTF entry.
📍 Bearish Scenario - (ITF view ) Price should not have candle close above the range on the same timeframe otherwise setup is invalidated and new range created. 📍 Bearish Scenario - (LTF view) - price (yellow has structured movements and should be crating AMD profiles on the edge of the range. We need to drop to LTF to read the structure. 📍 Bullish Scenario ITF view - Price should not have candle close below the range on the same timeframe otherwise setup is invalidated and new range created. 📍 Bullish Scenario - (LTF view) - price (yellow) has structured movements and should be crating AMD profiles on the edge of the range. We need to drop to LTF to read the structure. ‼️Note that Im always referring to the key level. It's called key level , because it's key for the success of the setup. Without it it will work only sometimes. This element must be part of the setup. I personally like the Order Block in other word Supply / Demand zone.
🧪 I have explained Order block in the post below Before we go to trade setup let's clarify timeframes again. Price is fractal you can basically trade this on any timeframes, but you still need to keep structure of 3 Timeframes.
🧩 Timeframe Alignments
🧪Short Term Trading
Trend - Monthly - Directional draw on liquidity
RangeS - Weekly - Stop hunts
AMD Profiles / Entries - H4/H1
🧪Swing Trading
Trend - Weekly - Directional draw on liquidity
Range - Daily - Stop hunts
AMD Profiles / Entries - H1/M15
🧪Day trading
Trend - Daily - Directional draw on liquidity
Range - H4 - Stop Hunts
AMD Profiles / Entries - M15/ M5
🧪Scalping
Trend - H4 - Directional draw on liquidity
Range - H1 - Stop hunts
AMD Profiles / Entries - M5/M1
🔥I recommend to trade daily and weekly ranges. Im not saying Day trading and Scalping is impossible. But Im sure none of us started trading for being isolated nerd behind the PC whole day stressing yourself about every minute. You want live social live and enjoy the freedom which trading can give you and mainly Daily and weekly ranges are higher probability.
🧩 AMD- Accumulation Manipulation Distribution
This is happening on the markets over and over. Everyone who trades profitably use it and if not they are not continuous about using it but they use it is what is necessary to move the market. And we want see It on the Edge of the range with confluence of the key level.
Bitcoin Breaks $123K Resistance as Bulls Target $133K Bitcoin has reclaimed the critical $123,000 resistance level, confirming renewed acceptance in its upper trading channel. This breakout paves the way for a possible rotation toward the $133,000 macro target.
Bitcoin continues to lead broader market sentiment, acting as the benchmark for overall bullish momentum. Following weeks of range consolidation, the decisive move above $123K signals strength and increasing demand among market participants.
Key Technical Points
- Breakout Level: $123,000 reclaimed on daily close, confirming channel acceptance.
- Target Objective: $133,000 represents the next structural resistance zone.
- Market Context: Rising open interest and healthy funding rates support sustainable momentum.
The $123,000 level was previously a high-timeframe resistance acting as a ceiling for several weeks. The recent bullish breakout now flips this level into support, signaling the start of a potential expansion phase within Bitcoin’s larger ascending channel.
Market participation metrics confirm the breakout’s legitimacy. Both open interest and spot volume have increased in tandem, showing that the move is supported by genuine buying activity rather than short-term speculation. On the daily timeframe, consecutive bullish closes above $123K reinforce structural strength, while the channel high near $133K remains the next logical technical magnet.
Additionally, Bitcoin’s dominance has stabilized, suggesting that capital rotation may follow toward major altcoins once BTC reaches its upper target region.
What to Expect in the Coming Price Action
As long as Bitcoin holds above $123K, the next technical rotation toward $133K remains the most probable scenario. Sustained bullish structure and volume support could open the path for another all-time-high challenge in the medium term.

Teacup Chart Pattern — Brewing Bullish MomentumSup, legends! Shall we tea it up? ☕
Today, we’re not just talking about your morning cuppa. We’re diving into something traders get excited about — the Teacup Chart Pattern. Just like a perfect brew, this pattern takes time to form, and knowing how to spot it can make your trading experience much smoother.
What Is the Teacup Chart Pattern?
The teacup chart pattern is a bullish continuation setup that resembles the shape of a tea cup when plotted on a price chart. It typically forms after an extended uptrend, signaling a consolidation phase before the asset resumes its upward trajectory.
Key characteristics of the tea cup pattern include:
A rounded bottom that reflects a gradual shift from selling pressure to buying support.
A slight pullback, known as the "handle," which represents a brief pause or shakeout before the next move.
A breakout above the resistance line at the cup’s rim, often accompanied by strong trading volume.
Anatomy of the Teacup and Handle Pattern
To apply teacup pattern trading effectively, traders must understand the structure:
The Cup – This is the rounded consolidation. It can take several weeks or months to form, depending on the timeframe. A smoother curve is generally considered stronger than a sharp V-shaped recovery.
The Handle – Following the cup’s formation, price action typically retraces slightly, creating a downward or sideways movement. This handle reflects short-term profit-taking and helps “reset” market sentiment.
The Breakout – Once the handle is complete, a breakout above the cup’s rim confirms the tea cup trading pattern and signals renewed bullish momentum.
Trading the Teacup Pattern
When approaching tea cup pattern trading, consider the following strategies:
Entry Point : A common entry is at the breakout above the rim of the cup, once volume confirms the move.
Stop Loss Placement : Traders usually place stops slightly below the handle’s low to minimize downside risk.
Target Projection : The potential price target can be estimated by measuring the depth of the cup and projecting it upward from the breakout point.
Why the Teacup Trading Pattern Works?
The teacup trading pattern embodies market psychology. The rounded cup reflects gradual accumulation, while the handle signals a controlled pullback that shakes out weak hands. When the breakout occurs, it often triggers a surge of buying pressure from both breakout traders and those re-entering the market.
For crypto traders, the tea cup chart pattern is particularly valuable because digital assets are prone to sharp moves. Recognizing this structure early can provide an edge in catching strong upside momentum.
Common Mistakes in Teacup Pattern Trading
Even experienced traders can misinterpret the teacup chart pattern. Some common pitfalls include:
Mistaking a sharp V-shaped rebound for a valid cup formation.
Entering too early, before the handle completes.
Ignoring volume confirmation, which often validates the breakout’s strength.
Patience and discipline are critical in successfully applying the tea cup pattern trading strategy.
Final Thoughts
The teacup and handle pattern is one of those OG bullish setups in crypto that just works when you read it right. Think of it as the market taking a chill before the next leg up. You spot the rounded cup, wait out that handle fake-out, and when volume kicks in — that’s your green light.
With crypto’s crazy volatility, the teacup trading pattern can be a solid way to catch continuation moves and ride some serious momentum. Just don’t ape in blind — always stack confirmations. Watch the volume, line it up with MAs or momentum tools, and filter out the noise. The pattern’s strong, but context is king if you don’t wanna get trapped in a fake breakout.

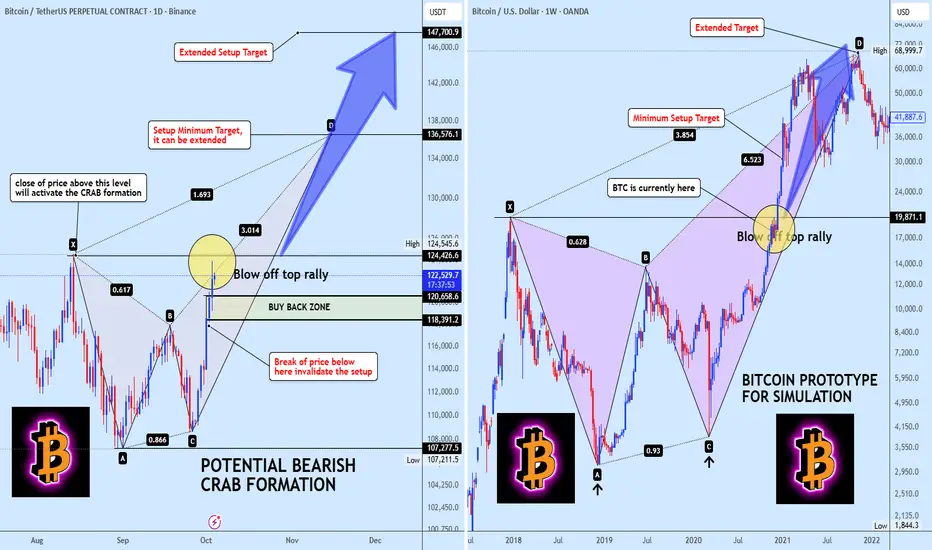
BTC's 2021 Playbook is Back Are You Ready for the Final Rally?History doesn't repeat itself, but it often rhymes. And right now, Bitcoin is composing a symphony we've heard before, one that ended in a PARABOLIC EXPLOSION.
We're looking at a potential BEARISH CRAB PATTERN on the daily chart, and it's a near perfect mirror of the 2017-2021 prototype that launched us to the last cycle top. Buckle up.
The Simple Breakdown:
1. THE ACTIVATION TRIGGER: A daily close ABOVE $124,545. This is the launch button.
2. THE BUY THE DIP ZONE: $118k to $120k. Any dip here could be a gift before the rip.
3. THE FAIL SAFE: A daily close BELOW $107k invalidates the setup. This is our line in the sand.
THE TARGETS:
1. Minimum Target: $136,576
2. Extended Target: $147,700-$160k
The Ghost of Cycles Past (Right Chart):
Look at the 2017-2021 prototype. The C to D leg wasn't just a rally; it was a BLOW OFF TOP of historic proportions. It delivered the targets and then some before exhaustion set in.
The current structure is screaming that we could be at the same inflection point.
This isn't just another pattern. This is a cyclical blueprint suggesting Bitcoin is gearing up for the FINAL, EXPLOSIVE LEG of this cycle.
If this Crab confirms, we are targeting the $136K to $147K+ zone as the potential cycle peak. This is where liquidity floods in and volatility goes vertical.
A Word of Caution:
Always trade with a plan. The invalidation level at $107K is crucial. A break below there means the setup is broken, and we must re-assess.
The takeaway? All eyes on the $124.5K breakout. This could be the start of the grand finale.
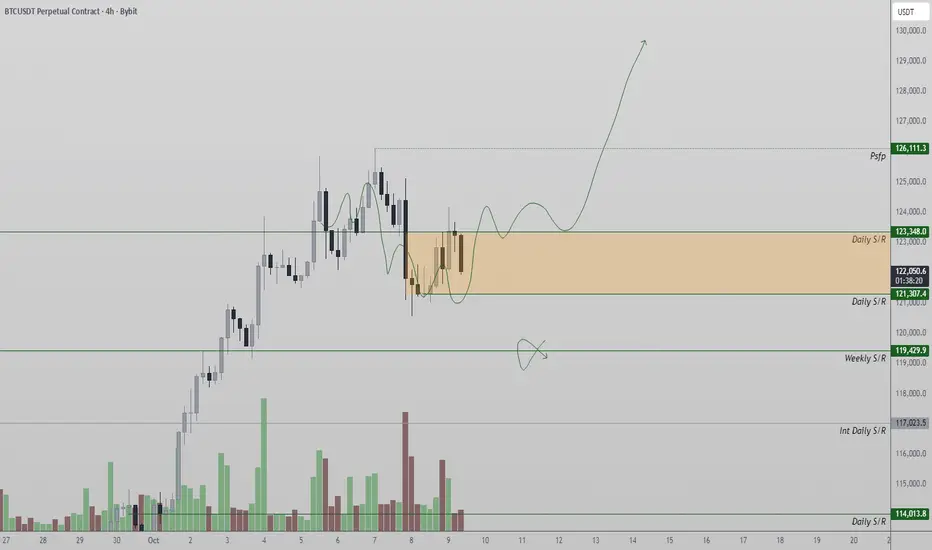
Bitcoin Holds Key Range Levels as Bulls Eye ContinuationBitcoin continues to trade between two key levels at $123,348 and $121,307, with a breakout or breakdown likely to dictate the next major move.
Price action remains tightly range-bound between these zones after multiple rejections and retests. A reclaim of $123,348 would signal continuation toward new highs, while a drop below $121,307 could invite a deeper corrective phase.
The $119,000 level serves as a crucial support where liquidity is building, aligning with prior demand zones. Structurally, Bitcoin’s broader trend remains bullish, and the ongoing pullback appears corrective rather than a reversal. As long as price holds above the $119,000 region, buyers maintain control of the trend.
What to Expect:
Sustained strength above the $121,000 level would support an eventual push toward new highs, while losing it could extend the correction before another bullish rotation forms.
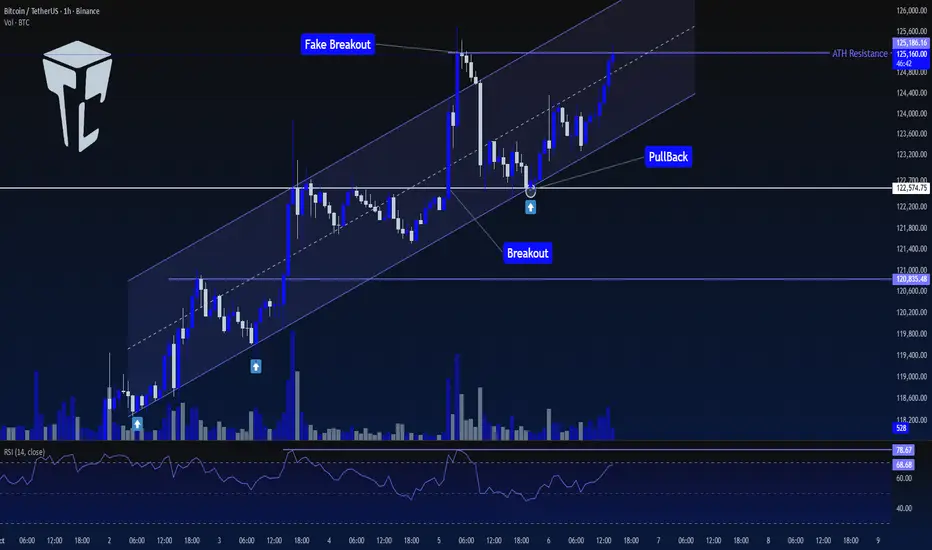
TradeCityPro | Bitcoin Daily Analysis #188👋 Welcome to TradeCity Pro!
Let’s move on to the Bitcoin analysis. Today, after pulling back to its previous resistance, Bitcoin is ready to start its next move.
⏳ 1-Hour Timeframe
On the 1-hour timeframe, Bitcoin continues its upward trend. Yesterday, after a pullback to the 122574 area and support from the channel’s bottom, it is once again ready to begin its next leg upward.
✨ The top formed at 125186 is Bitcoin’s new ATH resistance, and breaking this level would lead to further bullish continuation.
✅ Today, if this level breaks, we can have a long position on Bitcoin. If you already have an open position, there’s no need to re-enter at this point — it’s better to look for opportunities in other coins.
🎲 Since Bitcoin’s dominance trend is generally declining, if the next bullish leg begins, altcoins could also become attractive options. Therefore, it’s best to hold one position on Bitcoin and another on selected altcoins.
❌ Disclaimer ❌
Trading futures is highly risky and dangerous. If you're not an expert, these triggers may not be suitable for you. You should first learn risk and capital management. You can also use the educational content from this channel.
Finally, these triggers reflect my personal opinions on price action, and the market may move completely against this analysis. So, do your own research before opening any position.
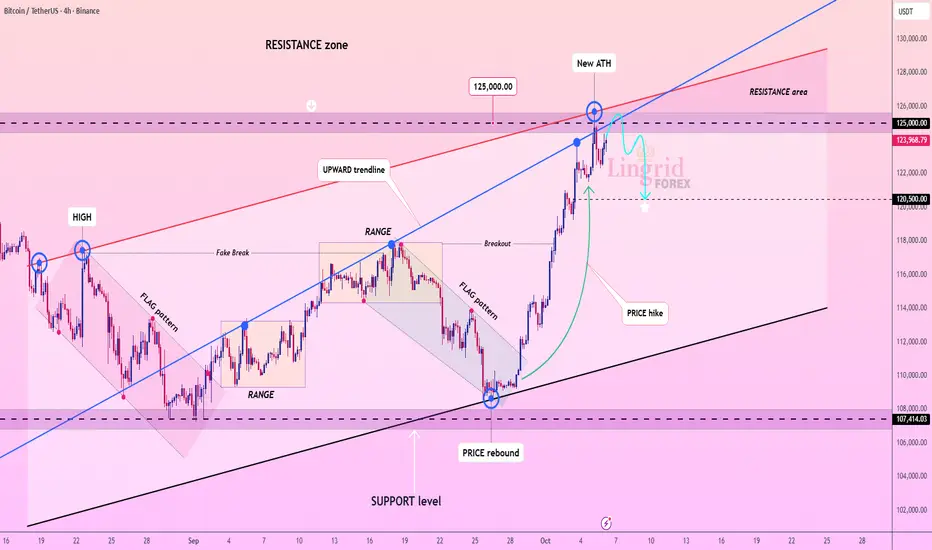
Lingrid | BTCUSDT Round Number Rejection Pullback ExpectedThe price perfectly fulfilled my previous idea . BINANCE:BTCUSDT is facing rejection near the 125,000 resistance after reaching a new all-time high. Price action shows exhaustion at the top boundary of the rising channel with early signs of retracement. A close below 123,000 may confirm a deeper correction toward the 120,000 support zone. Momentum suggests sellers are attempting to take control following the extended bullish rally.
⚠️ Risks:
A sustained move above 125,000 could invalidate the bearish setup.
Strong institutional buying or ETF inflows may renew bullish momentum.
Softer U.S. economic data could weaken the dollar, supporting crypto recovery.
If this idea resonates with you or you have your own opinion, traders, hit the comments. I’m excited to read your thoughts!
BTCUSD | Daily Structure Analysis
Overview :
After breaking the last daily resistance and completing a correction on the weekly timeframe, Bitcoin is now trading below the 124,000 level.
If the price manages to break above 124,500, it could continue its bullish wave toward 127,500, and later 132,700, completing the upward structure.
📈 Resistance Levels:
🔺 124,500 — Key Level
🔺 127,500
🔺 132,500
📉 Support Levels:
🟩 117,700
🟩 114,500
🟩 107,300 — Key Level
🧠 Analytical Note:
A breakout and retest (pullback) of any key level could define the next directional move — whether bullish or bearish.
Currently, the market is testing a strong resistance area, and the reaction here will likely determine next week’s direction.
💬 What’s your outlook on Bitcoin?
Do you think BTC needs a short-term correction before continuing higher?
مرور کلی:
قیمت بیت کوین پس از شکست آخرین مقاومت در تایم فریم روزانه و تکمیل اصلاح در تایم فریم هفتگی، اکنون زیر سقف 124,000 دلار قرار دارد.
در صورتی که قیمت بتواند مقاومت 124,500 را با قدرت بشکند، احتمال حرکت صعودی تا نواحی 127,500 و سپس 132,700 وجود دارد و میتواند موج صعودی فعلی خود را تکمیل کند.
📈 نواحی مقاومت (Resistance Levels):
🔻 124,500 — Key Level
🔻 127,500
🔻 132,500
📉 نواحی حمایت (Support Levels):
🔰 117,700
🔰 114,500
🔰 107,300 — Key Level
🧠 نکته تحلیلی:
شکست هر یک از نواحی کلیدی و بازگشت (پولبک) به آن ها میتواند مسیر حرکت بعدی بازار را مشخص کند؛ چه در جهت صعودی و چه نزولی.
در حال حاضر بازار زیر ناحیهی مقاومتی کلیدی قرار دارد و واکنش قیمت به این سطح میتواند جهت هفته ی آینده را تعیین کند.
💬 نظر شما چیست؟
به نظر شما بیتکوین پیش از ادامه ی حرکت، نیاز به یک استراحت کوتاه ندارد؟

This year's target: Around 133889.92
Hello, traders!
Follow me to get the latest information quickly.
Have a great day.
-------------------------------------
(BTCUSDT 1W chart)
The price has been rising above the HA-High indicator, forming a step-up trend.
You can see that the upward movement of the step-up trend is slowing down.
The key question is whether the price can rise above the right Fibonacci level 2.618 (133889.92), which is considered this year's target.
If it shows further upward movement, it could rise to around the right Fibonacci level 3 (151018.77).
Even so, it must ultimately break above the HA-High ~ DOM (60) range on the 1W chart. Therefore, we need to see if the price can rise above the 116259.91-119086.64 range and maintain its upward momentum.
If it fails to rise, it will eventually touch the M-Signal indicator on the 1M chart again.
From a long-term perspective, the price must remain above the 69000-73499.86 level to maintain the uptrend.
Therefore, we must first confirm support near the first, second, and third levels.
-
(1D chart)
The 116259.91-119086.64 range is the resistance zone on the 1W chart.
If the price rises above this range, the 120760.81-124658.54 range, which is the resistance zone on the 1D chart, awaits.
Therefore, the 116529.91-124658.54 range should ultimately be considered the resistance zone.
To determine whether this range is important, you should examine the movements of auxiliary indicators such as StochRSI, On-By-Signal (OBV), and TC (Trend Check).
To break above this important range and continue the uptrend,
1. The StochRSI indicator must be trending upward. Ideally, it should not be in the overbought zone.
2. The On-By-Signal (OBV) indicator must be trending upward. If possible, it should remain above the High Line.
3. The TC (Trend Check) indicator should show an upward trend. If possible, it should remain above the 0 level.
It's important to meet the above conditions when breaking above the resistance zone of 116529.91-124658.54.
If not, there's a high chance of failing to break above the resistance zone.
-----------------------------------------------------
The HA-Low and HA-High indicators included in this chart are designed for trading on Heikin-Ashi charts.
Therefore, a basic trading strategy can be utilized: buy near the DOM (-60) ~ HA-Low range and sell near the HA-High ~ DOM (60) range.
However, if the price rises from the HA-High to DOM(60) range, it is likely to exhibit a step-like upward trend. If the price falls from the DOM(-60) to HA-Low range, it is likely to exhibit a step-like downward trend.
Therefore, the basic trading strategy should be a segmented trading approach.
We can see that the HA-High to DOM(60) range, i.e., the resistance zone, is likely to form, and then a pullback is likely to occur as it attempts to break above it.
Auxiliary indicators (StochRSI, OBV, TC) indicate the strength needed to rise again from a pullback, or a downward trend.
Although the 110644.40 level still serves as weak support, the DOM(-60) level has been identified.
For the 110644.40 level to function as support, it must hold for at least three days.
Therefore, during this period of volatility, we need to monitor whether the DOM (-60) indicator holds at 110644.40 after October 14th (October 13th-15th).
This is because if the price fails to break above the resistance zone of 116259.91-124658.54, the 110644.40 level could serve as support.
-
I believe the bull market is likely to continue until this year.
If it rises further, the upward trend could continue through the first quarter of 2026.
However, a major bear market is expected in 2026.
Therefore, we need to finish the year on a good note.
-
Thank you for reading.
I wish you successful trading.
--------------------------------------------------
- This is an explanation of the big picture.
(3-year bull market, 1-year bear market pattern)
I will explain in more detail when the bear market begins.
------------------------------------------------------

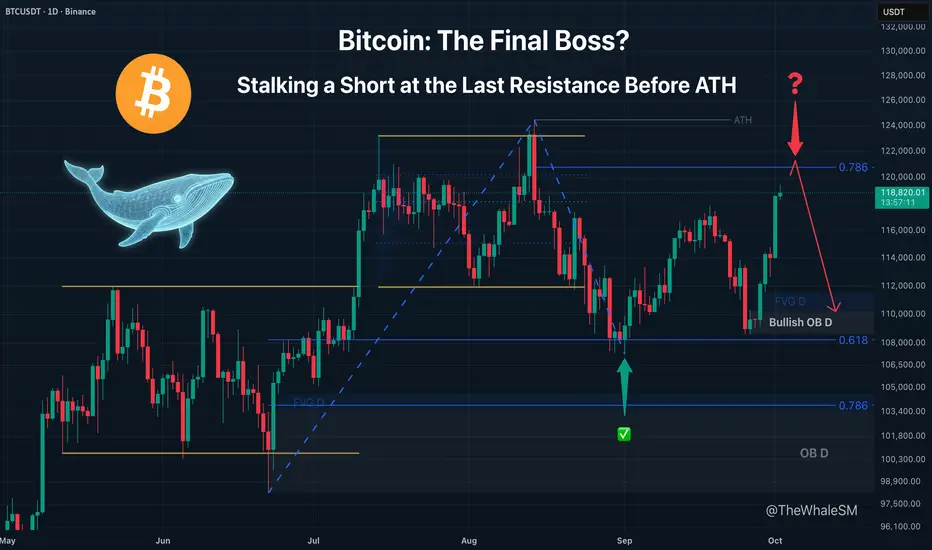
BTC: New ATH or One More Correction? The 78.6% Level DecidesIn every great story, there is a final challenge before the ultimate prize. For Bitcoin, that moment is now. The price is approaching the last major line of resistance that stands between the current price and a new All-Time High. This analysis breaks down that critical level and the tactical, counter-trend opportunity it may present.
Bitcoin is continuing its uptrend after the correction to the 61.8% Fib level, which I showed in the trade idea " Bitcoin's Tumble: How Deep Does the Rabbit Hole Go? ", and is now approaching a very important level that will determine whether a new ATH will be formed or if the asset will correct further before that.
This is the 78.6% Fib level - the last resistance level from which a short can be considered.
Conditions for the Short Setup:
🔑 POI: 78.6% Fibonacci Retracement Level
🔎 ENTRY CONDITIONS: The price must find acceptance below the 78.6% level. Since this is a daily structure, this may require daily candle bodies closing below the level for confirmation.
🎯 MINIMUM TARGET: Bullish Daily Order Block below.
❌ INVALIDATION: A confirmed break and hold above the 78.6% level. A break here would signal a probable move to a new ATH.
~~~~~~~~~~~~~~~~~~~~~~~~~~~~~~~~~~~~~~~~~~~~~~~~~~~~~~~~~~~~~~~~~
The principles and conditions for forming the manipulation zones I show in this trade idea are detailed in my educational publication, which was chosen by TradingView for the "Editor's Picks" category and received a huge amount of positive feedback from this insightful trading community. To better understand the logic I've used here and the general principles of price movement in most markets from the perspective of institutional capital, I highly recommend checking out this guide if you haven't already. 👇
P.S. This is not a prediction of the exact price direction. It is a description of high-probability setups that become valid only if specific conditions are met when the price reaches the marked POI. If the conditions are not met, the setups are invalid. No setup has a 100% success rate, so if you decide to use this trade idea, always apply a stop-loss and proper risk management. Trade smart.
~~~~~~~~~~~~~~~~~~~~~~~~~~~~~~~~~~~~~~~~~~~~~~~~~~~~~~~~~~~~~~~~~
If you found this analysis helpful, support it with a Boost! 🚀
Have a question or your own view on this idea? Share it in the comments. 💬
► Follow me on TradingView for timely updates on THIS idea (entry, targets & live trade management) and not to miss my next detailed breakdown.
~~~~~~~~~~~~~~~~~~~~~~~~~~~~~~~~~~~~~~~~~~~~~~~~~~~~~~~~~~~~~~~~~
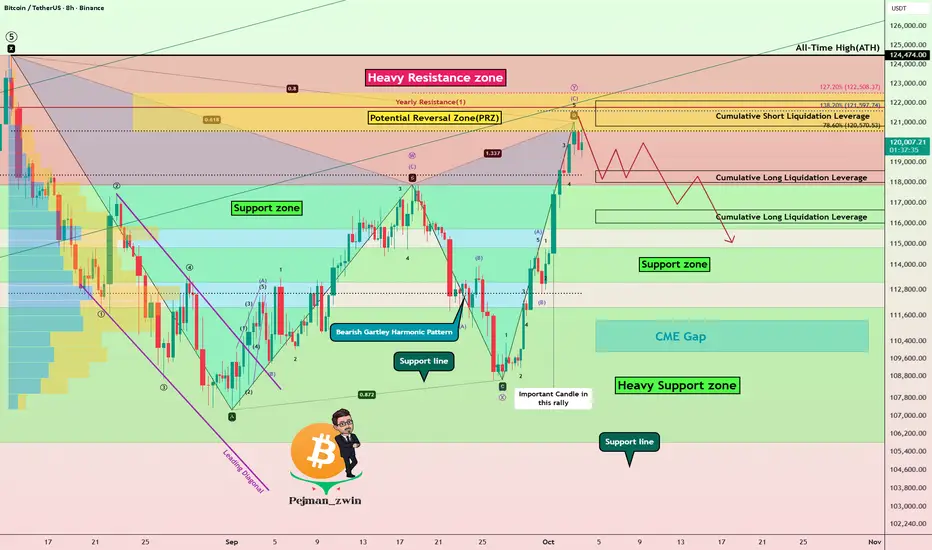
Elliott Wave + Gartley Harmonic: Why Bitcoin May Correct Soon!?Bitcoin( BINANCE:BTCUSDT ) has shown strong bullish momentum over the past week, climbing nearly +10% and testing key resistance zones . Several fundamental and technical factors fueled this rally.
Key Drivers of the Rise:
ETF inflows – Significant net inflows into spot Bitcoin ETFs boosted demand.
Macro uncertainty – U.S. government shutdown risk and weaker job data supported risk assets.
Monetary policy – Expectations of softer Fed policy improved market sentiment.
Derivatives impact – Options expiry, high OI, and short squeezes added upward pressure.
Exchange outflows – Lower BTC supply on exchanges signaled accumulation.
Positive sentiment – “Uptober” narrative and bullish analyst targets lifted confidence.
-------------------------------------------
Now, if we look at the Bitcoin chart in the above timeframes from a technical analysis perspective , we can see the following:
First of all, let me say that the rally that Bitcoin has had over the past 7 days has NOT been accompanied by high volume, and this is not good news for Bitcoin to create a new All-Time High(ATH) .
Bitcoin is entering a Heavy Resistance zone($124,474(ATH)-$117,900) and is moving near the Potential Reversal Zone (PRZ) and Cumulative Short Liquidation Leverage($122,120-$120,823) .
In terms of Elliott Wave theory , Bitcoin appears to be completing a microwave C of the main wave Y . One of the reasons I saw the waves as corrective , other than the microwaves, was the low volume of Bitcoin in the past 7-day rally .
If we look at the Bitcoin chart from a pattern perspective , the important Bearish Gartley Harmonic Pattern is also well and standardly defined on the chart, such that point D in the PRZ can be completed. The Gartley Harmonic Pattern is the most important pattern among the harmonic patterns .
I DO NOT expect a new ATH formation for Bitcoin in this rally due to the above reasons, and I expect it to at least decline to the Support zone($114,820-$113,180) .
Note: Important prices to watch for if Bitcoin reverses (in order of importance of volume): $118,400-$112,700
Note: You should note that these days, Bitcoin has a higher correlation with the SPX500( SP:SPX ) index than before, so if there is a sudden movement in Bitcoin, one of the reasons could be a sudden movement in the SPX500.
Educational Tip : The volume of each candle is considered to be the identity and credibility of that candle, and you can find these candles with the help of volume candle charts.
Cumulative Long Liquidation Leverage: $118,583-$118,000
Cumulative Long Liquidation Leverage: $116,652-$116,000
CME Gap: $111,355-$109,915
Stop Loss(SL): $125,00(Worst)
Please respect each other's ideas and express them politely if you agree or disagree.
Bitcoin Analysis (BTCUSDT), 8-hour time frame.
Be sure to follow the updated ideas.
Do not forget to put a Stop loss for your positions (For every position you want to open).
Please follow your strategy and updates; this is just my Idea, and I will gladly see your ideas in this post.
Please do not forget the ✅' like '✅ button 🙏😊 & Share it with your friends; thanks, and Trade safe.