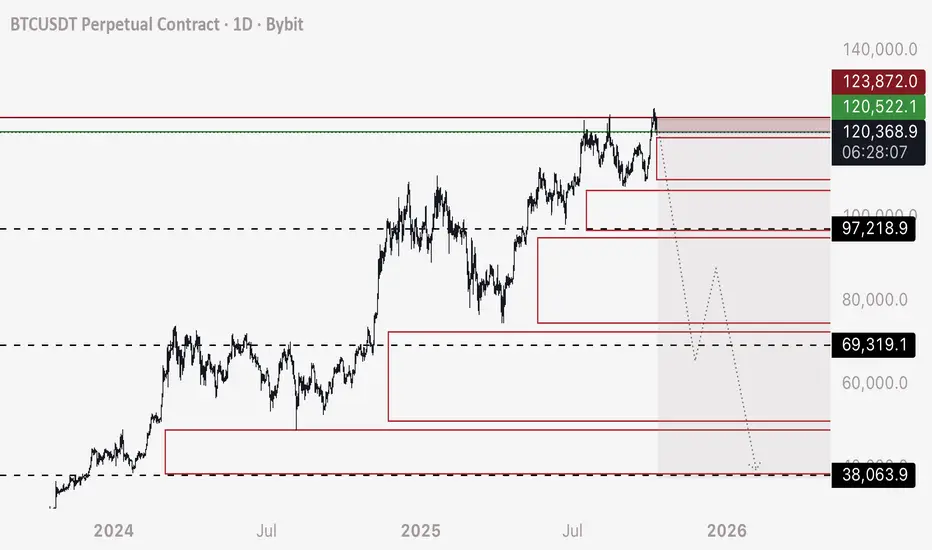
BTC - Short a Stop Hunt and Stay on the Right SideI’m breaking my larger idea down into multiple trades, now that others are opening up to the reality that it’s possible.
These order blocks shown are filled with long position stop losses, leveraged sell orders that only fill when price crosses over - and will set off like a chain reaction.
This will create a very fast drop IE Stop Hunt - and we can take advantage of it.
TRADE 1 - SHORT
Entry - 120,200 to 120,500
Stop Loss - 123,800 (although I don’t see Bitcoin rising back above 121,000 before this trade completes)
Target 1 - 97,250 (Close 25% of trade)
Target 2 - 69,400 (Close 50% of trade)
Target 3 - 38,100 (Close 40-90% of trade as it’s possible we continue to drop and don’t retrace from here to 90,000 appx)
I’ll be logging this trade.
All the best and buckle in.
- DD
BTCUSDT.3L trade ideas
Don't worry.I can reminde previous wave that happened in the pervous cycle . Thats seems me the last movment dosent happen yet
BTC/USD ANALYSISBitcoin is currently sitting in a strong demand zone, a beautiful area that could trigger a new ATH (All-Time High).
According to my analysis, we’re now in the final wave of wave 5 in the Elliott Wave structure.
This phase could mark the end of the bullish cycle, with one last strong push to a new high before a major correction takes place.
🎯 Likely scenario:
Short to mid-term bullish continuation
New ATH possible from this zone
Then a significant drop once wave 5 completes
🕰️ Patience and risk management — the last wave often traps the market.

Symmetry <Danger Zones>BTC follow Symmetry
just wait for entry signal
Price symmetry refers to comparing the size of past and current price movements to identify balance or repeating patterns.
It assumes that the market tends to make similar upward and downward moves in terms of price distance (such as wave length or correction size).
Analysts measure previous price swings and compare them with the current move to identify potential reversal or continuation points.

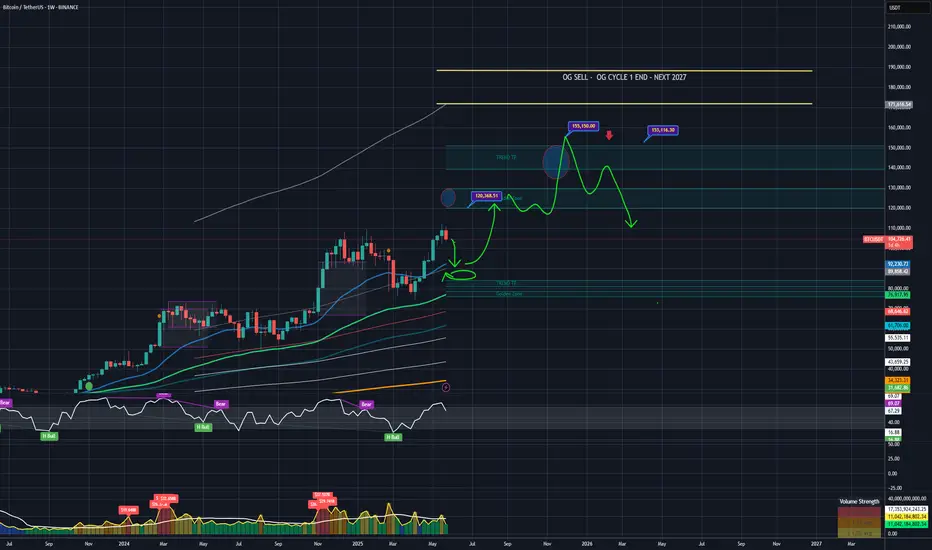
LAST OG CYCLE - 2025 - Oct-Dec - 2026 - Jan-MarchMajor Update
BLITZ BULL -BY OG
OCT - 200K
NOV - 230K
DEC - 250K
AVG - 2025 - 220K BTC
AVG - 2026- Q1 - 275-330K BTC
Enjoy!

BTC - Short - 3 Wave Correction Bitcoin Short signal with a lower entry for those that didn’t catch the last top.
3 simple targets.
Entry - 111,900-112,000
Stop Loss - 116,400
Target 1 - 85,000
Target 2 - 36,000
Target 3 - 10,000
Buckle in.
- DD

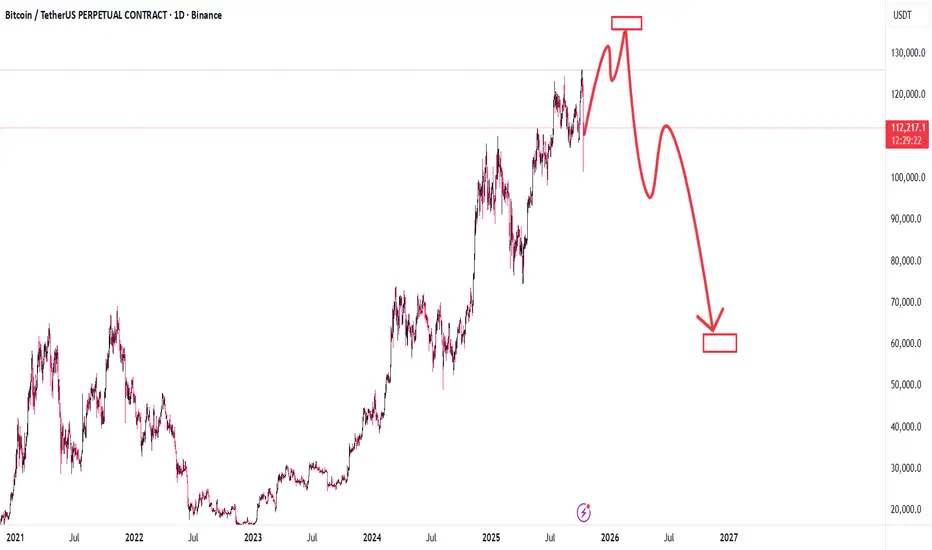
11/10/2025 BITCOIN On Going Ending Of Cycle 🔹 Market Outlook & Personal Warning
I’m seeing the end of a diagonal wave for this current cycle.
Don’t FOMO just because another big piece of news is coming out.
To avoid long-term risks that may be hard to handle,
I strongly suggest those who have already made a decent profit
to start scaling out gradually and reduce exposure.
In my view, the $131,000 – $144,000 range could mark the final ATH of this cycle.
After that, we might enter a major correction phase toward $40,000 —
it may sound impossible to some, but time will tell,
regardless of how positive the current fundamentals may appear.
Some may think I’m crazy or overly cautious — and that’s fine.
I’ve been through two full BTC cycles since 2017,
and I sincerely hope you won’t experience what many did back then.
This post may trigger mixed reactions,
but I have no personal gain from sharing this outlook.
I’m simply offering a friendly warning
to help others avoid potential massive losses before it’s too late.
Stay safe, stay rational —
Good luck to everyone out there.

BTCUSD NEXT POSSIBLE MOVE Bitcoin is consolidating near a strong support zone, showing signs of accumulation. If the price continues to respect this area, a bullish move can be expected ahead.
Structure remains positive as long as price holds above support — buyers may soon take control.

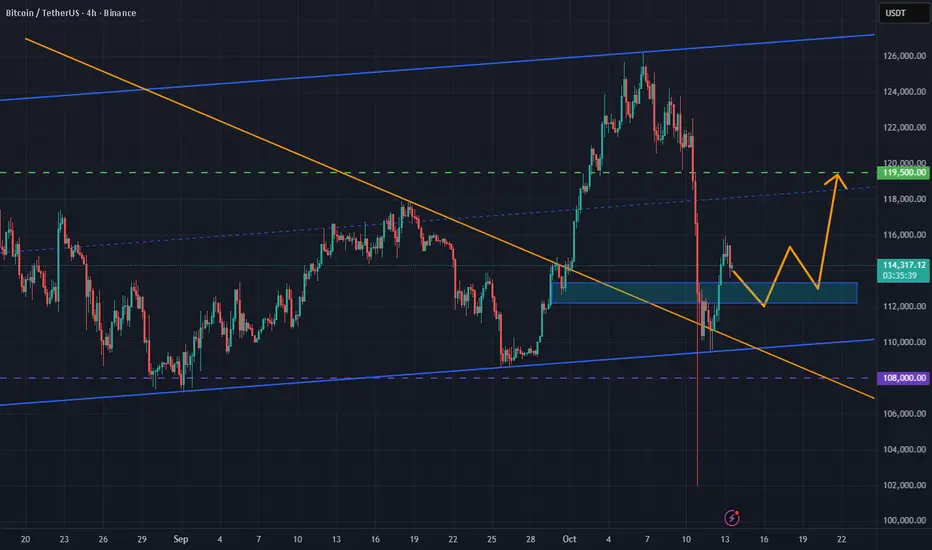
BTC Game Plan - DTB ModelBTC Game Plan – DTB Model
📊 Market Sentiment
After the sharp 10/10 crash triggered by Trump’s announcement of up to 100% tariffs on Chinese imports, risk assets — especially altcoins — faced massive liquidation, with some dropping over 80%.
As of 12/10, headlines indicate that Trump may reach out to President Xi, with Vice President Vance clarifying the statement. The market reacted bullishly, showing a strong rebound.
However, sentiment remains neutral, as volatility persists and geopolitical uncertainty continues to influence short-term direction.
📈 Technical Analysis
BTC retraced into the HTF Demand Zone, running the daily swing liquidity inside it.
Additionally, price retested the bearish trendline, confirming it as a key technical pivot.
Currently, BTC is attempting to recover toward the equilibrium (0.5 Fibonacci) of the recent decline.
📘 Model to be used – Demand to Trendline Break (DTB Model)
1-Identify HTF trend and valid demand zones.
2-Wait for liquidity sweep inside demand for energy confirmation.
3-Watch for price recovery toward equilibrium (0.5 fib).
4-Confirm with a strong close above bearish trendline and equilibrium for entry signal.
📌 Game Plan
I’ll be waiting for BTC to break and close above the 0.5 Fibonacci (equilibrium) and the orange bearish trendline. That will be the first confirmation that the bearish phase may end, and momentum may shift to the upside.
🎯 Setup Trigger
Daily strong close above the orange bearish trendline and 0.5 Fibonacci equilibrium level.
📋 Trade Management
Stoploss: Below $107,500 (protecting capital is more important than chasing profits)
Target: $126,300 (near previous all-time highs)
💬 Like, follow, and comment if this breakdown supports your trading! More setups and market insights coming soon — stay connected!
⚠️ Disclaimer: This content is for informational and educational purposes only and does not constitute financial, investment, or trading advice. Always DYOR before making any financial decisions.

BTC USD reversal BTC showing sign of reversal entry TS on a higher time frame , but and wil be a risky trade so entering on a lower quantity

OG CYCLES - NOV 2025 - 2026 FEBOG CYCLE 1 - 132 300 - 155 200 / 2025 NOV - 2026 FEB
OG CYCLE 2 - 250 000 - 302 300 / 2027 Last cycle / Focus BTC only
BTC/USDT:Sharp Rebound Signals Recovery Within ConsolidationRageBTC/USDT bounced strongly from the 102,100 support level following a flash crash, indicating renewed buying interest near structural lows. The pair continues to trade within a broad consolidation range, with 119,500 serving as a key resistance target.
A sustained break above the trendline could confirm recovery momentum toward the all-time high at 125,000. The recent flash crash may have cleared out weak hands, paving the way for market stabilization and potential re-accumulation.
BITCOIN COME BACK TO 125.000 Lets Gooo Hey ,
After A Big Crash In Crypto We Follow Now Our Technical Analysis And Market Structure And We Have A Find A Bullish Bitcoin Setup For Longterm Holding
Buy Reason : QM
Buy Zone : 112.937 to 112.091
Target Old High : BSL
Hope You Gpt The Trade And Understand It

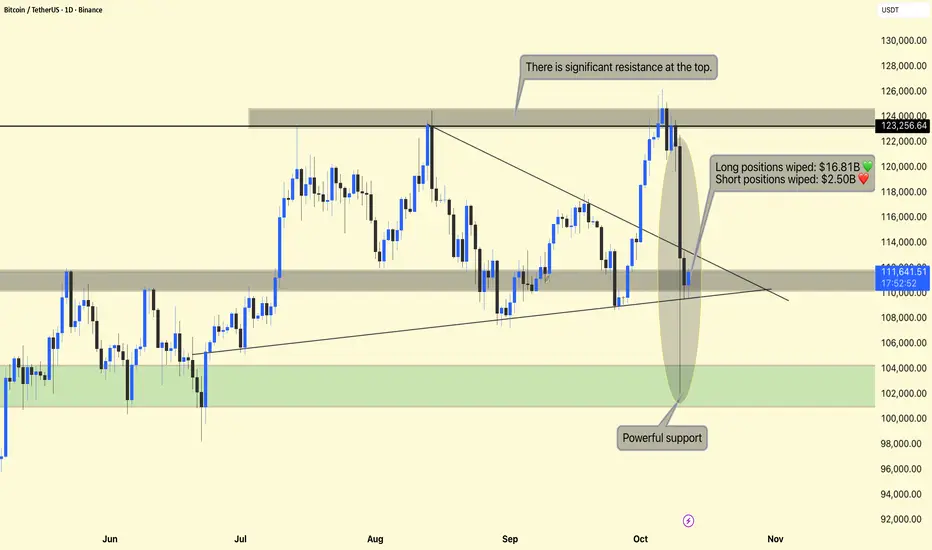
Bitcoin (BTC/USDT) – Daily Chart Analysis !!Bitcoin (BTC/USDT)
The chart shows a sharp correction from the $124,000 resistance zone, followed by a major liquidation event that wiped out:
Long positions: $16.81B
Short positions: $2.50B
This represents one of the most volatile 24-hour periods in recent months — aligning with the Fear & Greed Index drop to Extreme Fear (24).
$123,000 – $124,000 Major Resistance Strong supply area — multiple rejections in past rallies.
$111,000 – $110,000 Current Support Zone Price is currently consolidating here after the crash.
$102,000 – $104,000 Powerful Support Historical accumulation zone — where buyers previously stepped in aggressively.
Resistance Rejection
At the top of the range ($123,000–$124,000), BTC encountered heavy resistance, triggering large-scale profit-taking and the liquidation of overleveraged long positions.
This area has acted as a strong rejection zone several times since August, indicating sellers are defending it aggressively.
Breakdown and Liquidations
After the breakdown of the descending triangle, cascading liquidations forced a steep drop.
This led to a high-volume candle (highlighted area) where:
Liquidity was cleared both above and below key support levels.
Market sentiment flipped rapidly from Greed → Extreme Fear.
This kind of liquidation sweep often signals a short-term capitulation — a flush before possible recovery.
Support & Market Structure
Price bounced from near $110,000, a previous structure support level.
If BTC maintains above $110,000, it may attempt to stabilize and retest mid-range resistance around $115,000–$116,000.
However, if price breaks below $110,000, we could see a retest of the $102,000–$104,000 demand zone, which is marked as “Powerful Support” — a key area where long-term buyers might re-enter.
DYOR | NFA
BITCOIN !!!Hello friends
Given the good decline we had, a good opportunity was provided to buy at good prices with capital and risk management and in steps and move to the specified goals.
There was good liquidity at the bottom that was collected, now we can expect a good growth.
*Trade safely with us*

BITCOIN BTCUSDTThe bitcoin daily loss is pat of trading strategy,gain and losses is what comes with trading any instrument.
Macroeconomic Jitters Intensify Crypto Volatility as Global risk sentiment turned sharply negative after the U.S. announced new 100% tariffs on Chinese tech imports, reigniting fears of a prolonged trade conflict.
the current crypto downturn reflects a complex mix of macroeconomic headwinds, leveraged liquidations, and cooling sentiment after record-breaking highs.
key demand floor is 100,067 break and close sell into next demand structure.
#bitcoin #btc

BTC - How Manipulation Works and How to Detect It I subscribe to premium solely for the multi second time frames, time frames that you may think are useless.
What if I told you this is the ONLY true way to detect manipulation?
HOW MANIPULATION WORKS
It’s a lot more subtle than you think.
The main driver of what moves the price of Bitcoin is the adverse orders from derivatives and leveraged positions. These orders being stop loss orders and liquidation orders.
In essence, it’s traders own decisions and orders, that cause price to move in an opposite direction.
You may have heard people say “Do the Opposite” or “Contrarian Trader”. What they mean is, the market seems to move in the opposite direction as the majority sentiment. Even the fear and greed index is used to convey this principal.
However there’s a true and technical way of understanding this.
As bitcoins price moves and consolidates SLOWLY and STEADILY in one direction, this extended period of time allows traders to enter leveraged positions in that same direction that’s moving price slowly up or slowly down.
Consequently, these trades are leaving opposite direction orders of a larger magnitude, such as stop loss orders for the “entire leveraged position size”. For example, Trader Bob uses $100 to inject liquidity into a long position, and opts to use 80x because of his confidence in Bitcoin moving up. Trader Bob then sets a stop loss order which “sells” his position and closes 100% of his leveraged position size. Trader Bob sets BELOW the current price a sell order for $8,000 - 80x his original $100 injected.
MANIPULATION comes in two distinct parts.
1) Price is held stable, to ACCUMULATE and ATTRACT more of the orders (long or short) - which the market makers and exchanges know is ACTUALLY creating more propellant and energy that will move price in the opposite way.
As an example, if Bitcoin is at 100,000 and the market makers and exchanges know there’s a mass amount of liquidity to reclaim at 80,000 - they will do a series of manipulations to get price to that level.
A) They will hold price steady while looking like Bitcoin is about to keep moving up. This attracts more longs with different leverage and stop loss orders creeping closer to 80,000
B) They will drop price slowly, and rise back quickly. The slow drop allows time for traders to work down the price scale those stop losses and liquidations, and the fast rise ensures they are left in tact and price won’t move low enough to trigger off the chain reaction.
SUMMARY OF 1)
Price is manipulation by being KEPT or STABLE from setting off the chain reaction of stop loss orders, which offering time to get traders to place more of these orders.
NOTE THAT Market Makers don’t place their own trades. They accommodate leveraging traders. That said, they do want their money back - so they want traders to place trades in the losing direction, while simultaneously having their own stop loss orders set a chain reaction that takes price to the level they want.
2) Price is PUSHED or FORCED into the chain reaction of stop loss orders and liquidation orders.
This is the manipulation that forces price, however we can understand the mechanics fully and understand the intentions.
Manipulators (hidden providers of liquidity) will place icebergs or many small orders, which generate large volume in small time intervals, and force bitcoin into the series of orders.
It is then the traders own adverse orders that automatically fulfill the price movement.
SUMMARY OF 2)
Price manipulation is initially forcing price into a series of stop loss orders and liquidation orders, and it’s possible to detect this.
USING THE 5 SECOND TIMEFRAME TO DETECT MANIPULATION
1) Add the basic VOLUME indicator to your chart
NOTE - Suggest using Binance BTC chart
2) Note the Volume moving average - which is shown as a Bitcoin Amount transacted each 5 second interval. This is commonly 0-2 BTC transacted per 5 second.
3) Observe each candle volume coming in. The time frame is small enough that you can see if it’s a buy or sell, very seldomly mixed buys / sells. This also serves as an alternative Order Book.
4) Watch for abnormally large volume transactions on the 5 second candles. It’s not out of the ordinary to spot a 5 second candle that contains 500 BTC bought or sold.
THIS is CERTAINLY the price manipulation that forces price into a sequence of stop loss orders.
5) Use that buy or sell manipulation volume candle as a que to understand the intention of where price is going to be forced.
THE WRAP UP
I hope to assist you all with understanding that the Bitcoin chart is very much INTENTIONAL and can be treated as a STRATEGIC BUSINESS due to the market cap being dominated by leveraging liquidity and few players who control it.
Love and luck to all,
- DD
Positive Market - BTC Continues to Find New ATHBTCUSD Analysis
Bitcoin is currently testing the upper boundary of a long-term ascending channel, where price has previously faced rejection several times (as shown by the red arrows).
The market recently completed a strong rally toward 124K, aligning with the 1.618 Fibonacci extension (123,609) — a significant resistance zone that triggered selling pressure.
Key observations:
• Resistance area: Around 124K–125K, aligning with the upper channel line — potential for short-term correction.
• Support zones: The first support lies near 118,100, followed by 115,000–115,500, both acting as Fibonacci retracement zones.
• Possible scenarios:
1. Price may retrace toward 118K–115K to gather liquidity before another push upward.
2. If the market holds above 123K, a breakout toward 132K–133K could be confirmed.
Overall, momentum remains bullish, but the current zone requires caution — a short-term pullback is likely before the next major move.

End of Bull run - Phase E We Are Approaching the End of the Bull Run
We can see that we are reaching the final stage of the current bull run, based on several technical and structural signals.
According to Wyckoff analysis, we are now in Phase E, where the distribution process usually begins.
We’ve witnessed massive liquidations right at the top — a classic sign of exhaustion.
I’ve drawn two yellow lines extended to the top of the chart: these represent the distance between the previous bull-run top and the last one.
I’ve copied and projected that same length forward, and once again, the market aligns almost perfectly — the move is complete.
Mathematics don’t lie.
The crypto cycle is driven by math, and this chart clearly illustrates that rhythm.
In my opinion, it may be time to start closing positions after this automatic rally —
(not financial advice, just an educational illustration).
Do your own research, trade responsibly, and keep an eye on the charts.
Happy trading,
Rafjs

BTCUSDT – ABC Correction Hey traders 👋
Bitcoin might be setting up for a strong move downwards after completing what appears to be a 5-wave impulse structure on the higher timeframe.
There’s also a clear RSI bearish divergence, suggesting that bullish momentum is fading and a correction could be near.
I’m currently expecting a medium-term ABC corrective phase, though it’s still uncertain whether it will develop as a classic zig-zag or a flat/flag-type correction.
🎯 Trade Plan (Short Setup)
- Entry Zone: 112,000 – 118,000 USDT
- Stop Loss: above 125,000 USDT
- Take Profit 1: 75,000 USDT
- Take Profit 2: 52,000 USDT
- Final Target (Wave C): around 43,000 USDT
⚡ Notes:
If BTC breaks below the previous wave 4 area with strong momentum, that would add more confirmation to the corrective scenario. However, if the market maintains higher lows, we could still see an extended B-wave or even a continuation of the uptrend.
📘 Reminder:
This is not financial advice — always DYOR and manage your risk properly.

#BTC Update | 12.10.2025🚨 #BTC Update | 12.10.2025 🚨
Bitcoin had a massive drop, making a deep wick near the 100K zone — a true disaster day for many traders with huge liquidations across the market 😬💥
As I mentioned in my previous analysis, once BTC lost the support at Arrow #1 and #2, the bullish momentum weakened, opening the door for a deeper retracement on the weekly timeframe.
📉 The weekly retracement zone was marked around 104,669, and guess what? — on Friday’s wick, price tapped it perfectly. 🎯
Now, the focus shifts to Arrow #3 and #4 — once the price breaks above these levels, we can look to re-enter buy positions confidently. ✅
Remember, on the bigger timeframes, the overall structure remains bullish, so this pullback could just be a healthy correction before the next leg up. 🚀
I expect a strong recovery move after Monday, which could confirm the breakout.
Next up 👉 I’ll post the #BTC.D and #ETH analysis, so stay connected, stay patient, and trade smart! 💪🔥
#Bitcoin #Crypto #Trading #BTCAnalysis #SwingTrade

#BITCOIN ANALYSIS I have been warning you for the last 45 days #BITCOIN ANALYSIS
I have been warning you for the last 45 days that a big dump was coming and now it’s playing out exactly. Bitcoin has already dumped around $20K and is now trading near 112K, right at the major resistance zone that has triggered every big correction since 2018.
A small bounce to 115K–116K is possible, but after that I expect another leg down toward 100K, and potentially lower to 90K.
I’m still holding my 50% short position. If anything changes or I close my position, I’ll update you. Remember I mentioned earlier that if BTC went back to 125K–128K, I would add more shorts and that plan hasn’t changed.
Till Monday, I expect some volatility, but Monday’s price action will give a clearer direction.
🔸 Weekly:
BTC touched the long-term trendline again → clear rejection happened.
👉 Until we get a weekly close above 125K, the risk of a major pullback stays high.
BITSTAMP:BTCUSD
🔸 Daily:
Price is inside the 110K–125K supply zone. Structure is weak.
If price breaks and resists below 110K, then 100K is the next target.
📊 My Trade:
✅ First target 105K hit
Holding 50% shorts, expecting a bounce to 115K, then lower.
📌 Downside Targets: 105K ✅ → 100K → 95K → 90K

What if...?A rising wedge pattern in the final stages makes sense to me. We've been trading up only since 2023 and past cycles always end before everyone keep waiting for the "last leg up" to sell. Why this time should be any different?
