BTC in the next 2-3 weeksEvery time a big crash created a large wick with a small body, it occurred at the 0.232 fib level.
BTCUSDT.3L trade ideas

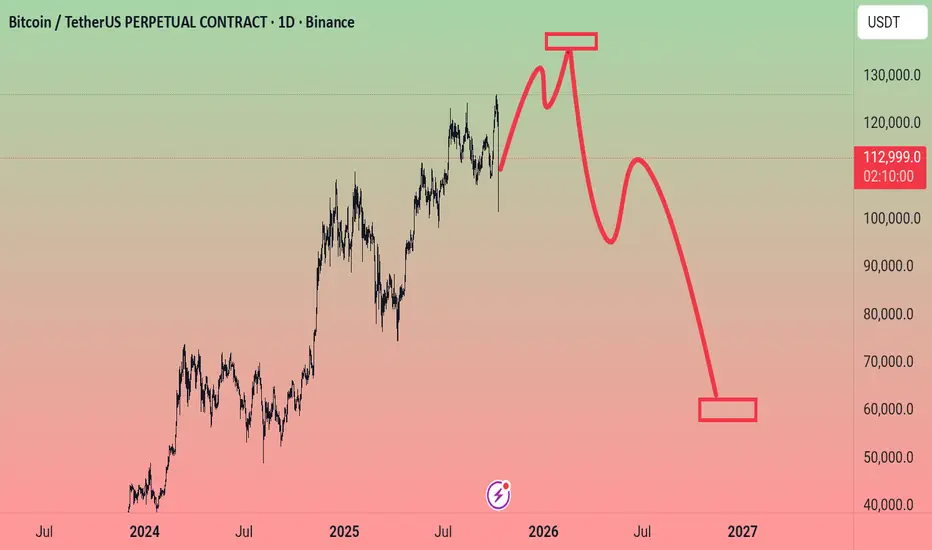
Bear market cycle scenarioPump into end of october, 120-140k target. Dump into march 2026, sentiment low, alts bleeding. Sideways till 10/2027, sentiment dead, alts dead, last cycle new coins as layer2 OP, ARB, and so on bled hard. Optimal buying oportunity.

IS the bull MARKET OVER! My next tradeIn this space, you’ll find my long-term outlook on Bitcoin 🪙 — helping you see the bigger picture of what’s been happening in the market over the past week 📉📈
🔥 You’ll get insight into:
🔑 Key levels to watch for your trading or investing strategy
💡 The next profitable trade to position yourself for
🧭 A clear perspective on where Bitcoin could be headed next
Yes, we’ve seen a crazy drop 😱 — but this is not the time to panic.
It’s time to pause, think, and plan your next move 🧠💪
🎥 Watch the full video for my detailed breakdown and upcoming trade setups! 🚀
Is the #BTC bull market still here?📊Is the #BTC bull market still here?💬
🧠From a structural perspective, the weekly and monthly charts remain bullish, the bullish trend remains intact, and the bullish target range (132k-175k) is still within reach, so don't be too pessimistic.
➡️This type of high-leverage liquidation event isn't the first time. Similar structures occurred on December 5th, 2024, and January 3rd, 2024. If you look back at the market, you'll see that we always hit new highs after liquidating most of the high leverage.
➡️Interestingly, history is similar; the only difference is the price and volatility!
⚠️Note: We shouldn't blindly pursue similar events. We should always maintain a respectful attitude and strictly manage risks. Survival is more important than anything else!
🤜If you like my analysis, please like 💖 and share 💬
BITGET:BTCUSDT.P

As a trader , I expect for 130000 fk dollor I can reminde previous wave that happened in the pervous cycle . Thats seems me the last movment dosent happen yet 😃
Trades for today Tuesday 10/7 BTC shortTrades for today Tuesday 10/7 BTC short....Using PAR, Pd highs and lows and divergences.

BTC HOLDS LEVELS FOR MORE..BTC/USDT — Main Trend Holds Strong at $112K, Confirmation Near
Bitcoin is currently trading just below the low time frame zone around $124.5K, showing slight resistance before a potential confirmation breakout. Despite this minor pullback, the main trend remains firmly intact around $112K, which continues to act as the key structural support.
⚙️ Main trend updated to $112K: This level defines Bitcoin’s long-term bullish structure — as long as BTC stays above it, momentum remains positive.
📉 Below low time frame: BTC is temporarily consolidating under local resistance, but proximity to this level suggests a potential re-test and confirmation soon.
🚀 Upside target: Once the low time frame confirms, Bitcoin could aim for the next resistance zone near $132K.
Technical Outlook:
🟢 Main Trend (Support): $112K
🟡 Low Time Frame Resistance: $124.5K
🎯 Next Target: $132K (upon confirmation)
Summary:
BTC remains structurally bullish above the $112K main trend. While still slightly below the short-term confirmation zone, it’s positioned well for a potential continuation — provided support holds and price regains momentum above $124.5K.
📊 Bias: Cautiously Bullish
📈 Key Levels: Support $112K | Resistance $124.5K | Target $132K

BTCUSDT Forming Bullish MomentumBTCUSDT is currently showing strong signs of accumulation after a healthy market correction. The price action is consolidating above a key demand zone, indicating that buyers are actively defending this level. This structure often suggests the potential formation of a bullish reversal pattern, setting the stage for an upward continuation in the coming sessions. With Bitcoin maintaining solid support around this range, the market looks primed for a rebound that could extend into a 60% to 70%+ gain as sentiment strengthens.
Volume activity remains steady, reflecting consistent interest from both retail and institutional traders. Historically, these accumulation phases often precede powerful bullish rallies, especially when combined with high liquidity and growing demand. If Bitcoin successfully breaks above near-term resistance, the next impulsive wave could drive prices toward key psychological levels, further reinforcing its long-term uptrend.
Investors are closely monitoring BTCUSDT as it continues to build momentum within this crucial zone. A confirmed bullish breakout could trigger renewed buying activity and attract fresh capital inflows, making it one of the most watched setups in the current crypto market.
✅ Show your support by hitting the like button and
✅ Leaving a comment below! (What is You opinion about this Coin)
Your feedback and engagement keep me inspired to share more insightful market analysis with you!

Bitcoin (BTC), End of Cycle Season Based on Cycle DurationBINANCE:BTCUSDT
Bitcoin appears to have already formed its peak within the current bullish cycle and may now be preparing for a correction.
Alternatively, if BTC makes another attempt to reach a new all-time high within October, that period could mark the final peak of this cycle.
Looking at historical data, Bitcoin has shown a repeating pattern —
an uptrend lasting approximately 3 years and 11 months (1,065 days) from the bottom,
followed by a downtrend of about 1 year (365 days) from the peak.
During down cycles, the cycle low has typically formed between the EMA 50 and EMA 100.
Backtesting monthly charts shows that Bitcoin often breaks below the EMA 50, finds support above the EMA 100, and then breaks through the Ichimoku Cloud, signaling the start of a new bullish cycle.
Become an early follower and be part of the journey.🚀
I am Korean and I used Google Translate.

$BINANCE:BTCUSDT BINANCE:BTCUSDT
30min hollows
After a spectacular price drop of 16% - 17% over 8 hours on 30 minutes timeframe chart...
We can say that a downward parallel channel has been formed, from which since the price came out of the channel, this signaled the beginning of the consolidation phase, that is the stabilization of the price.
The stabilization rate ranges between 4%.
So using the Fibonacci retracement sequence, we can see the Support and Resistance areas forming.
So there is this condition:
If the price is within the support point and breaks it downwards, this means that the market trend will be downward.
Respectively, if the price enters the resistance point and then breaks it, we can say that we have an upward market trend.
and then the resistance point will become the support point.
Good Luck
#CryptoHellas team

126K is like a wall!With Bitcoin clinging to the upper end of its daily range, the chart offers a mix of bullish afterglow and bearish skepticism. Traders are watching key support and resistance levels as the market teeters on the brink of a breakout or breakdown.
Bitcoin remains in a post-uptrend pause following its recent breakout above $126,000. While the macro trend is bullish, price action is cooling, with two consecutive indecisive candlesticks suggesting momentum may be fading.
A pullback to the $122,000–$121,000 range could offer an attractive long-term setup—assuming bulls emerge with volume. Resistance still lurks around $126,000–$127,000, and without a strong catalyst, upside is likely to be limited in the short term. For now, this looks like a market taking a breather.
If you're following the trend, bulls still have the upper hand. Every major moving average, from the 10-day to the 200-day, is firmly in buy mode, and price action is consolidating above key support levels—not breaking down below them. A rebound from the $124,000 area could trigger another push towards $126,000 or higher, especially if volume picks up again. For now, this pullback is a breather, not a breakdown. I still believe $120,000 is a key level!!! A decisive break below $120,000 could open a trap door to $110,000—or even lower.

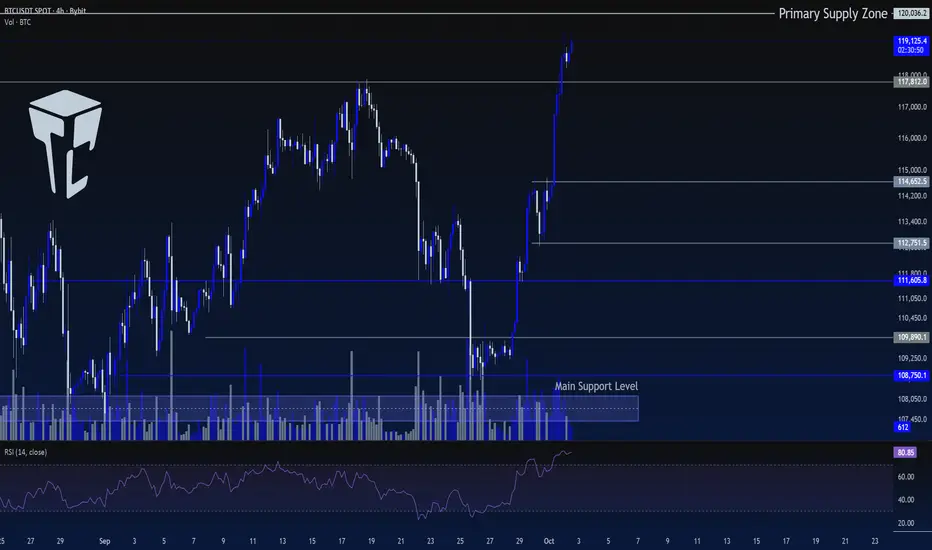
TradeCityPro | Bitcoin Daily Analysis #186👋 Welcome to TradeCity Pro!
Let’s move on to Bitcoin analysis. Bitcoin is still pushing upward, so let’s review the market conditions together.
⌛️ 4-Hour Timeframe
Yesterday, Bitcoin reached the next resistance level at 117,812.
🔍 On the lower timeframes, there was a small rejection from this zone, but on the 4-hour chart, price managed to hold above it and is now moving toward the 120,036 level.
🔔 Given the strong buying power and the heavy volume in the market, I believe the probability of continuation to the upside is very high, and price could push to even higher zones.
💥However, the RSI oscillator is currently deep in the overbought zone, sitting around 80. That’s quite an extreme level, and a correction in RSI is almost certain soon.
✔️ This doesn’t necessarily mean the uptrend is over. Price can still continue upward while RSI corrects.
⚡️ As long as RSI remains above 70 and stays in overbought territory, I expect the bullish leg to continue. Once RSI stabilizes below 70, price may enter a corrective phase.
⭐ In that case, we can look for long triggers during the price correction to catch the next bullish wave.
📊 If Bitcoin keeps rallying, the next zone to watch as a potential trigger will be 120,036. A reaction at this level could give us a new long setup.
💫 That said, on the first touch of 120,036, I personally won’t be opening a position—even if it breaks. I’ll wait for more structure to form before making an entry.
❌ Disclaimer ❌
Trading futures is highly risky and dangerous. If you're not an expert, these triggers may not be suitable for you. You should first learn risk and capital management. You can also use the educational content from this channel.
Finally, these triggers reflect my personal opinions on price action, and the market may move completely against this analysis. So, do your own research before opening any position.
DXY, EUR/USD, GBP/USD, and Bitcoin Daily Analysis for 09/10/2025Today episode i have simplify the next day bias and what to look out for in price. well explained and with high accuracy

Bitcoin btc 4h
The main target of the analysis is a decline to the $98,000 zone.
If price takes the opposite path and closes above $126,500 on the 4-hour chart, the bearish analysis is invalidated and price is expected to rise toward the $141,700–$142,000 zone.

BTC – Bearish Setup Developing on 4H#Bitcoin is showing good volume, but on the 4H timeframe, price action is forming a harmonic pattern along with a clear bearish divergence on the indicators.
These are early signals of potential downside. However, for a strong bearish confirmation, I will wait for a break of the key support level.
On the retest of that broken support, I’ll be looking for a short entry with proper risk management.
Reminder: Always trade with discipline and use proper SL/TP to manage risk.
What do you think?
Will #BTC respect this harmonic pattern or surprise us with another bullish push?
Share your thoughts in the comments & don’t forget to follow for more real-time setups and trade ideas.
#BTC #Bitcoin #Crypto #CryptoTrading #CryptoAnalysis #BTCUSD #HarmonicPattern #BearishDivergence #PriceAction #TradingSetup #CryptoCommunity


BTCUSDTHello Traders! 👋
What are your thoughts on Bitcoin?
Bitcoin continues to move within a valid ascending channel. After a recent correction, price successfully broke above the descending trendline and reclaimed a key resistance area.
Currently, the previous high near the 120,000 level is acting as a resistance barrier. A short-term pullback toward the broken structure is expected. If this area holds as support, the price is likely to resume its upward move and attempt to break the previous high.
As long as the price holds above the support zone and the bottom of the ascending channel — and does not break below the previous low — this bullish scenario remains valid.
The medium-term outlook remains positive, and pullbacks may offer new buying opportunities.
What do you think? Will Bitcoin break above the previous high, or is a deeper correction ahead?
Don’t forget to like and share your thoughts in the comments! ❤️

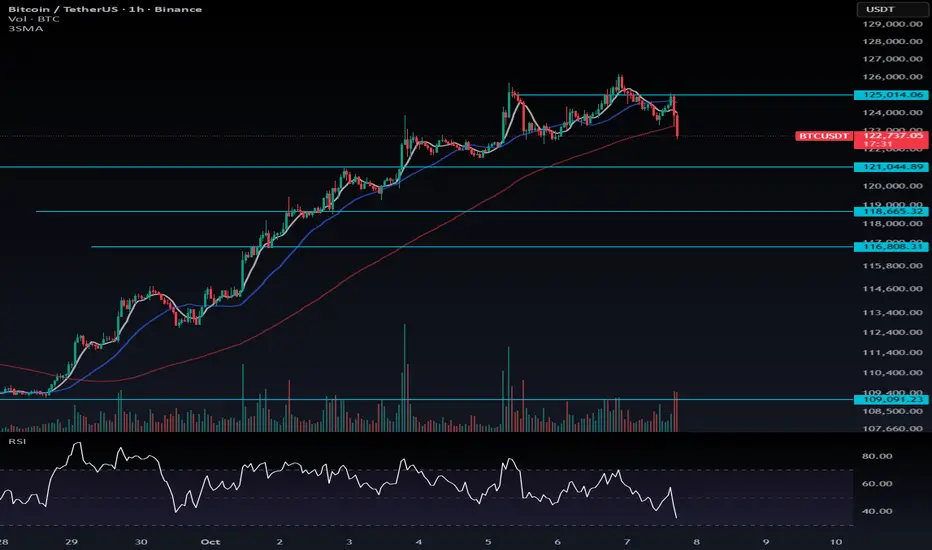
Bitcoin Correction Outlook: Healthy Pullbacks and Key LevelsDon’t fear a Bitcoin correction — embrace it. As I’ve mentioned before, a healthy trend requires both upward moves and corrections. The longer the correction takes to occur, the more powerful and volatile it can be, often accompanied by large candles.
🔹 Key Levels to Watch:
121,000: Maintaining above this level is bullish. Even if BTC dips below and fakes a breakdown, it can still be a positive sign.
Next supports: 118,665 and 116,808.
📈 Trading Note:
Above 125,000, consider long positions.
If BTC Dominance drops during a breakout, shift your focus to altcoins.
For now, observe the market carefully and wait for the right setup — patience is key.
BTCUSDT BULLISH -Was shocked when the market crashed; but its a good thing for me because the market completed a move that i thought that it would take a week or weeks.
-After the crash i looked for a neqw zone that i can enter as i saw that i missed the opportunity to enter when it touched the zone that i need.
-Im looking for a long position as ive seen a confirmation & im waiting for the push.
-Im looking for the market to go back to the entry zone & then push up.
-Lets see how this goes.

BTCUSDT — Possible Rejection from Channel ResistanceBitcoin is currently testing the upper boundary of the linear regression channel near the $114,500–$115,000 resistance zone.
The Stochastic Oscillator is showing overbought conditions, suggesting a potential short-term pullback.
A rejection from this level could send BTC back toward the midline or lower channel support near $113,000–$112,300.
However, a confirmed breakout above $115,700 would invalidate the bearish bias and open room for continuation higher.
🔹 Timeframe: 15m
🔹 Indicator: Linear Regression Channel, Stochastic (10,3,3)
🔹 Exchange: Binance
#BTCUSDT #Bitcoin #TechnicalAnalysis #Scalping #PriceAction #CryptoTrading

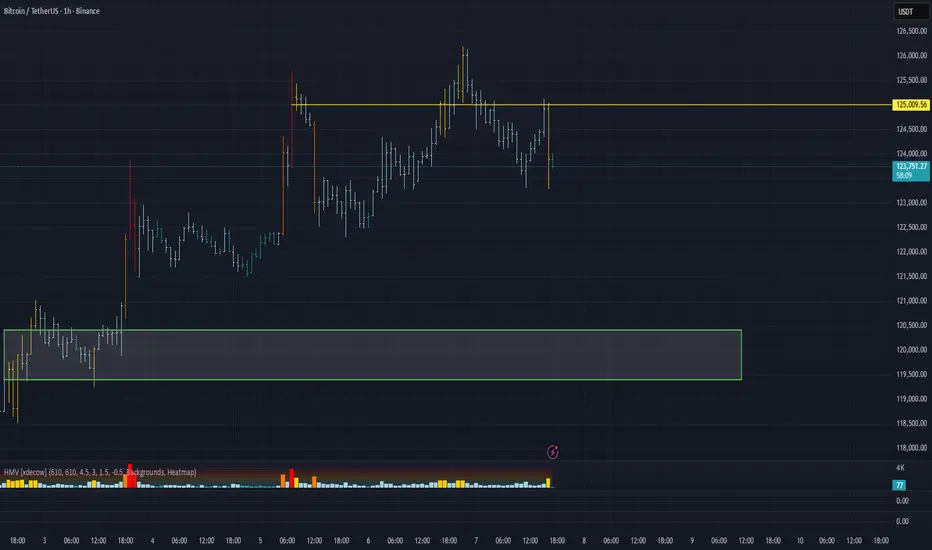
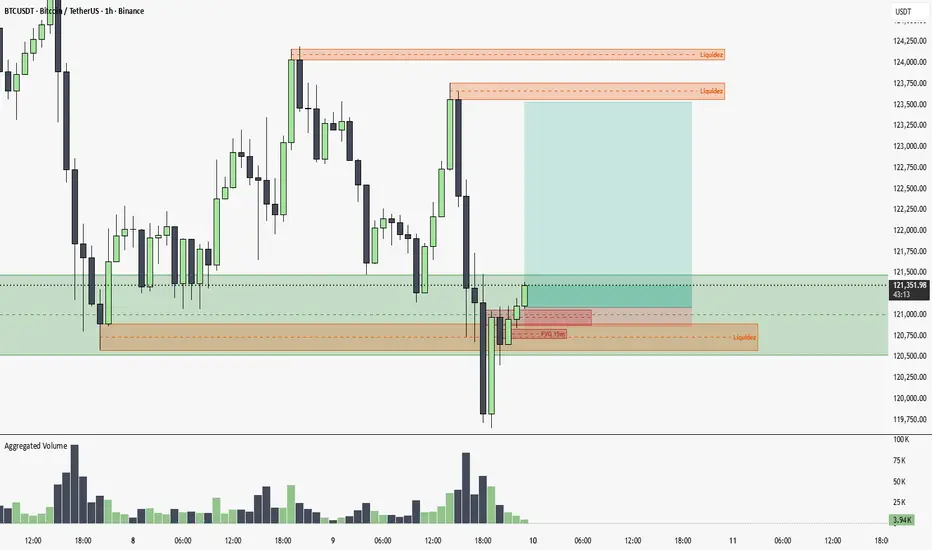
Up until the next liquidity levelThe price has broken through a liquidity level, hunted stops, and bounced back, creating a manipulation. As a target, we have the next liquidity level, and if it breaks that, the PO3 level.
Hello everyoneI came back! :3
I will make new analysis and will generate new analysis for you.
but don't forget the warnings!
BTC/USDT Analysis. Correction Likely
Hello everyone! This is CryptoRobotics trader-analyst with the daily market analysis.
Yesterday, Bitcoin followed our scenario, but with a slight deviation: we tested $125,000 (cluster anomalies) and retested the ATH, after which a correction followed.
At the moment, we have retested this level and received a fairly strong reaction. We expect a correction with targets at $120,000 and $116,000, or, if selling pressure is insufficient, the development of a prolonged sideways movement to accumulate liquidity for the next upward move.
Buy Zones:
$120,400–$119,400 (sales absorption)
$116,700–$115,000 (pushing volumes, strong graphical imbalance)
$112,500–$111,500 (mirror zone, volume anomalies)
$110,000–$108,800 (strong sales absorption)
This publication is not financial advice.