Bitcoin - 66k in 2026 (but first a pump - watch this!)Bitcoin has been going down drastically, as I expected many, many weeks in advance. But this is not the end of the crash! We will see lower prices in 2026, specifically 66k and possibly 50k later in Q3 2026. This is my long-term vision, but in the short term I think Bitcoin should go up to retest the previous long-term trendline and the previous falling wedge pattern at 97k! Usually after a breakout/breakdown, we want to see a retest. These retests are very important because they give us a chance to sell Bitcoin at a better price and also to short Bitcoin on the futures market.
Bitcoin did some pretty crazy movements in the past weeks, regardless of the seasonality patterns. Statistically Bitcoin is extremely strong in October and November—but this time it was the opposite. Even though seasonality patterns are helpful, you always need to look for more indicators and fundamentals. Moonboys that were screaming for 200k and 500k got liquidated, and soon they will disappear from the market for good. I have been trading for almost 10 years, and I have experienced many crypto crashes, and the moonboys are always here at the top. When I was bearish at 120k, everyone was screaming in the comment section and even spitting on my bearish predictions.
So my plan for the next Bitcoin movements is as follows: First, Bitcoin should retest the 97k level (this will take some time). After that we should see another big leg to the downside to 66k.
Write a comment with your altcoin + hit the like button, and I will make an analysis for you in response. Trading is not hard if you have a good coach! This is not a trade setup, as there is no stop-loss or profit target. I share my trades privately. Thank you, and I wish you successful trades!
Trade ideas

How to build Discipline & Structured Trading HabitsDiscipline is not something you rely on in the moment; it is something you build through habits that remove emotional decision-making from your trading process.
1. Define Rules Before You Trade
Traders without predefined rules rely on emotion. Traders with rules rely on structure.
Clearly define your entry criteria, risk per trade, maximum daily loss, and exit strategy.
When these rules exist before the session starts, you eliminate most impulsive behaviors.
2. Limit Your Daily Decisions
Every decision drains mental energy. The more choices you make, the weaker your discipline becomes.
Reduce the number of markets you watch, the number of setups you take, and the amount of chart time you expose yourself to.
Fewer decisions lead to higher-quality decisions.
3. Use a Pre-Session Checklist
A checklist forces you into a disciplined routine. It can include:
• Reviewing your trading plan
• Checking upcoming news releases
• Confirming your bias or market conditions
• Ensuring your risk settings are correct
The act of going through the checklist prepares your mind to follow structure.
4. Implement a Hard Stop for the Day
One of the fastest ways to lose discipline is to trade while emotional.
Set a maximum daily drawdown. Once it is hit, the session ends. No exceptions.
This protects both your capital and your psychology.
5. Track Your Rule Breaks
Most traders only track wins and losses. Disciplined traders also track deviations.
Write down every time you break a rule, why it happened, and how you plan to prevent it next time.
Over time, this builds awareness and accountability.
6. Delay Impulsive Actions
If you feel the urge to jump into a trade that does not fit your plan, delay the action by 30 to 60 seconds.
Impulses lose power quickly. By introducing a pause, you give your rational mind time to regain control.
7. Keep Your Environment Clean
Distractions destroy discipline.
Silence notifications, close irrelevant tabs, and avoid multitasking.
A clean trading environment supports clean decisions.
8. End Each Session With a Routine
A consistent end-of-day routine reinforces discipline. Examples:
• Rating your discipline on a scale from 1 to 10
• Reviewing whether you followed your rules
• Logging emotional triggers
Ending the day with structure makes it easier to begin the next one with structure.
Conclusion
Discipline is not built through motivation but through habits that create consistent behavior. A structured trading routine removes uncertainty, minimizes emotional influence, and helps you operate like a professional rather than a reactive participant.
Saylor’s Master Plan at Risk? MSCI Drops the HammerMSCI May Exclude Crypto-Heavy Companies: What It Means for MicroStrategy and the Market
MSCI recently published a proposal that could dramatically reshape how global indices treat companies with large crypto exposure.
According to the framework, companies holding more than 50% of their market capitalization in digital assets may be excluded from national and international indices.
This sounds technical - but the consequences are huge.
What This Means in Practice
If the rule is implemented, companies like MicroStrategy, Bitfarms, Marathon, Hut8, Coinbase, or any firm holding a large percentage of crypto on their balance sheet, may:
be excluded from major indices,
lose exposure to institutional investors,
be off-limits for pension funds, insurers and conservative hedge funds,
face reduced liquidity and forced selling.
This is not a small development.
This is a structural shift.
🧩 Why MicroStrategy Is the Most Exposed
MicroStrategy’s business model has been extremely straightforward:
issue new shares
raise debt (including convertible notes)
use the proceeds to buy Bitcoin
rising BTC → rising MSTR
rising MSTR → more borrowing capacity
A perpetual loop.
But if MSTR gets excluded from key indices, the loop breaks:
passive funds must sell
institutional investors face compliance risk
liquidity dries up
volatility increases
borrowing costs rise
And remember:
MicroStrategy currently trades below the fair value of its Bitcoin holdings.
A forced outflow amplifies the structural imbalance.
⚠️ Why Institutions Bought MicroStrategy Instead of Bitcoin
Many funds legally cannot buy Bitcoin.
They also cannot buy high-risk crypto exchange stocks like Coinbase.
But they can buy:
reputable corporate debt
convertible notes
equity from a listed U.S. corporation
Michael Saylor gave them a regulatory loophole:
“Want Bitcoin exposure? Buy my convertible debt.
If BTC rises, convert the notes into shares.”
This workaround is now cracking.
Convertible Debt Holders Are in a Tough Spot
If MSTR is excluded from indices:
index funds sell → share price drops
falling price → convertible notes lose value
institutions holding the debt face losses
the balance sheet risk increases
This is why regulatory decisions matter so much.
Insider Selling: VP of Bitcoin at MicroStrategy Sells ~$19.7M Worth of Stock
The timing is… interesting.
Started selling on September 18
Sold options-based shares in multiple lots
Continued selling until November 14
Total realized profit: ~$19.69M
Selling into regulatory uncertainty is not random behavior.
It’s a signal.
Key Takeaways
1. MSCI’s proposal changes the rules:
companies with >50% crypto exposure may become “non-indexable”.
2. MicroStrategy’s core model—borrowing to buy BTC—depends on institutional inflows.
Index exclusion disrupts it.
3. Convertible note investors may face severe pressure.
4. Insider selling suggests internal awareness of structural risk.
5. If MSTR is removed from indices, forced selling could create significant downside pressure.
📉 Conclusion
MicroStrategy has long been a “Bitcoin ETF before ETFs existed”.
Institutions bought MSTR because they couldn’t buy BTC directly.
But now:
Bitcoin ETFs exist,
regulations are tightening,
index providers are updating risk frameworks.
MicroStrategy may become a victim of its own success strategy.
Best regards EXCAVO

Bitcoin - Approaching the Make or Break ZoneBitcoin continues to bleed lower after multiple liquidity sweeps, and the decline is beginning to compress into a more controlled down move. The chart shows a clear shift in sentiment after the all time high sweep, then another daily sweep that helped close both the daily and 4H imbalance. Since losing the mid range zone and treating it as resistance, the market has been trending toward the next major area of interest.
Consolidation Structure
The structure is currently defined by a clean series of lower highs combined with sharp impulsive down legs. These moves are driven by liquidity grabs followed by displacement, which fits the narrative of a market hunting demand. The previously supportive gray zone has now flipped into resistance, confirming that the current trend remains heavy until a deeper demand zone is reached.
Key Support Zone and Expectations
The most important area beneath price sits around the seventy two thousand to seventy five thousand range, which is the closest meaningful support left on the higher time frame. This zone has been untested since the last major accumulation phase, and as long as price reaches it with a clean move, the reaction can form the base for a bullish leg. If this zone fails to hold, the next meaningful support sits deeper, and the downside extension could accelerate before any recovery starts.
Bullish Scenario
If Bitcoin reaches the seventy two thousand to seventy five thousand range and prints a clear rejection with displacement back upward, the market can set the foundation for a strong bullish bounce. Ideally, we see a final liquidity sweep beneath that range, followed by a sharp market structure shift on the lower time frames. That would open the door for a sustained recovery toward the mid range inefficiencies left behind during the selloff.
Bearish Scenario
If the key zone does not hold, the current support gives way and the market moves into a much deeper discount. That would shift the bias toward continuation lower, targeting untouched liquidity pools further down. In this scenario, any attempt to bounce would likely be corrective rather than the start of a true reversal.
Conclusion
I expect Bitcoin to deliver a meaningful bullish bounce once the seventy two thousand to seventy five thousand zone is tapped, as long as the level holds cleanly. If it fails, the decline continues into a deeper support, but the higher time frame idea remains that the next strong reaction will come from that region. Until then, patience is key while the market completes the move into higher time frame demand.
___________________________________
Thanks for your support!
If you found this idea helpful or learned something new, drop a like 👍 and leave a comment, I’d love to hear your thoughts! 🚀

INTERVIEW: Hope phase - EXCAVO’s View 25/11/25
1. Do you believe the bear market has already begun? If yes - from what moment?
Yes. The bear market started in November 2025.
My cyclicality chart shows it clearly: not a single scenario points to continued upside.
Every chart I posted on TradingView confirms the trend reversal.
2. What was the main signal confirming the reversal?
The 153rd week of Bitcoin’s growth — a historic exhaustion point that almost always marks the end of a cycle.
3. What BTC levels are critical for the downside scenario?
The key horizontal level is $74,000.
At minimum, I expect a clean wick below it.
4. What fundamental factors accelerated the bear market?
A massive overbought environment.
The 2-year AI bubble pushed valuations far above fair value.
The market became overheated — even though AI is here to stay.
5. Technical factors confirming the decline?
We’re dropping without any real reason.
Any small headline triggers selling.
October 11 wasn’t about Trump — it was a whale manipulation on big exchanges.
That’s how late-stage cycles behave.
6. Why did most traders fail to see this reversal?
— Short memory
— Conditioned for 3 years to “buy every dip”
— No exit plan
— No clear framework
— And of course: they weren’t following EXCAVO 😉
7. Where could BTC go in the coming weeks?
First: liquidation of short positions.
We may even spike up to $94,000.
But that would be a trap before continuation downward.
In December, I expect the formation of one of the cycle bottoms.
8. Which scenario seems more likely — panic drop or step-by-step bleed?
Most likely: a step-by-step bleed.
9. Is a fake bounce possible before further decline?
Yes. I already mentioned it: a short squeeze → then a big drop.
Practical Part
10. What are you personally doing in this market?
I’m waiting.
Observing.
Studying.
You don’t need to be in a trade every day.
Overtrading destroyed more traders than any correction.
11. What should beginners do now?
Exactly what professionals do: wait for their entry point.
We’re hunters in the bushes — we shoot only when the target is close.
12. What should traders revise in their strategy right now?
— Understand where we are in the macro cycle
— Identify what’s working
— Remove what’s not
— Accept that the bear market will be long and exhausting
Right now we’re in the hope phase.
Disappointment is ahead.
Best regards EXCAVO
If you have any questions, feel free to ask. In the next post, I can do another interview based on the questions you leave under this one.
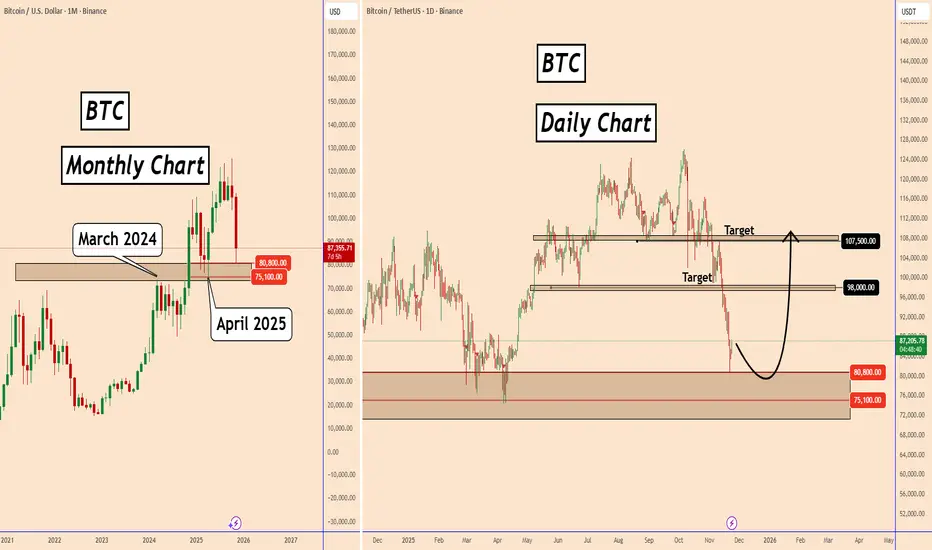
BTC at Key Support Zone - Bullish Setup in Progress?BTC at Key Support Zone - Bullish Setup in Progress?
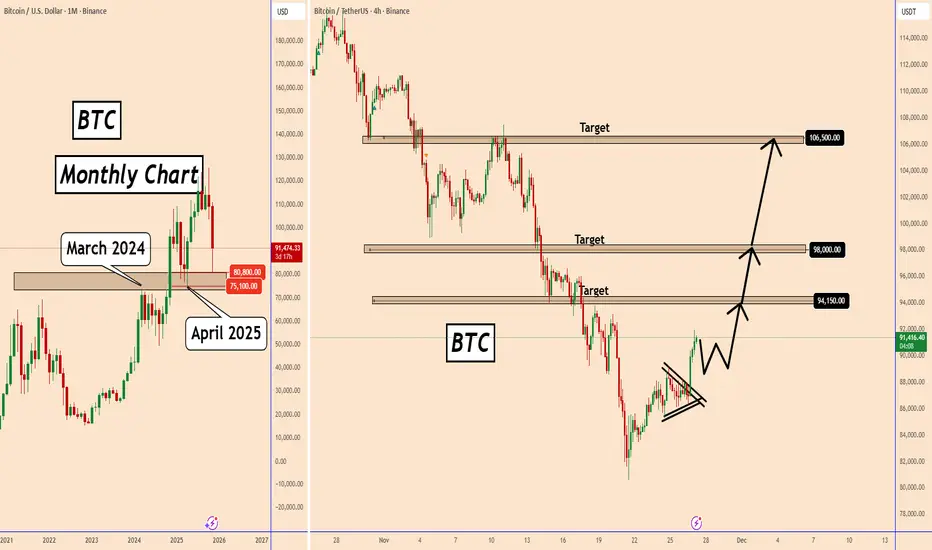
Bitcoin has reached a major long-term support zone between 75,100 – 80,800, an area that previously acted as strong support in March 2024 and April 2025 on the monthly timeframe. The current monthly candle is testing this zone again, suggesting that buyers may step in to defend this historically important level.
On the daily chart, BTC has formed a sharp decline toward this support area, but the recent reaction indicates early signs of accumulation. If buyers continue to hold this zone, a mid-term recovery could develop.
As long as the 75,100 support holds, BTC maintains strong potential for a medium-term rebound. However, a clean break below this zone would invalidate the bullish outlook and expose deeper downside.
Key Levels to Watch:
Support: 75,100 – 80,800
Target 1: 98,000
Target 2: 107,500
You may find more details in the chart!
Thank you and Good Luck!
❤️PS: Please support with a like or comment if you find this analysis useful for your trading day❤️
Bitcoin is falling via the Descending channel As observed in typical market behavior, a descending channel often emerges as a corrective structure following significant upward movements—precisely the pattern currently visible on the Bitcoin chart. This channel reflects a near-term consolidation phase, allowing the market to absorb previous gains and establish a new equilibrium.
A decisive breakout above the upper boundary of this channel, particularly when supported by increasing volume, would signal the resumption of the primary bullish trend. In such a scenario, a renewal of upward momentum could propel the market toward new all-time highs, aligning with the broader bullish market structure.
DISCLAIMER: ((trade based on your own decision))
<<press like👍 if you enjoy💚

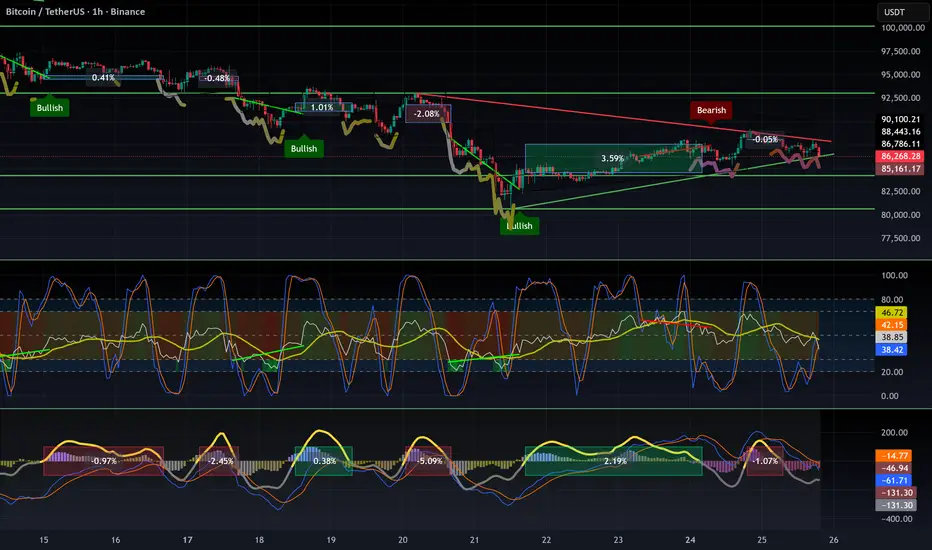
Bitcoin - Can the bulls break resistance?Bitcoin continues to stagnate after a strong sell-off. Market structure remains weak, and trading volume is declining as price keeps moving sideways within a tight range. Traders are uncertain about the next move, and both bulls and bears currently lack conviction. Overall sentiment is cool, with most attention focused on nearby resistance zones. Many eyes are on how BTC reacts to the current consolidation area.
4H Bearish FVG
Just above the current price lies a clear bearish 4-hour Fair Value Gap (FVG). This zone now acts as strong resistance. When BTC retests this area, a rejection is the most likely scenario. Only a breakout with strong volume would give bulls something to lean on. As long as this FVG holds, further downside remains the path of least resistance.
1H Timeframe
The 1-hour timeframe shows ongoing consolidation and repeated struggles with the local 1H bearish FVG. Every attempt to break through this area is immediately rejected. As a result, the probability of BTC breaking to the downside increases, which would allow the market to collect the liquidity resting below. Bears are expected to keep defending this zone until the market breaks through with conviction. Consolidation may continue as long as the support level holds, but the underlying downside risk remains significant.
Conclusion
BTC remains technically pressured as long as there is no convincing breakout above the 4H FVG. The current range is vulnerable to a downward break, especially with weak volume and persistent resistance structures. Traders would be wise to wait for clearer signals or a new trend on higher timeframes before committing to a direction.

Bitcoin - H1 Breakout Alert – Bulls Taking Control!BTC/USDT - Bitcoin has officially broken its descending trendline and completed a successful retest from the demand zone. This shift signals a potential momentum reversal, with buyers stepping in aggressively after weeks of corrective price action. BINANCE:BTCUSDT
🔍 Technical Overview
✔️ Clean trendline breakout on H1 timeframe
✔️ Strong retest at demand zone → buyers defended perfectly
✔️ Price now trading above the trendline, indicating bullish structure
✔️ First target: $95,000 (psychological level + key resistance)
✔️ Second target: $100,000 (major psychological level)
If bullish pressure continues, liquidity grabs above these zones could fuel an extended move.
📊 Fundamental Insight
Institutional interest rises, especially around accumulation zones
ETF inflows remain positive, boosting overall sentiment
#BTC #Bitcoin #BTCUSDT #Crypto #CryptoTrading #BitcoinAnalysis #TradingSetup #Breakout #TrendlineBreakout #PriceAction #TechnicalAnalysis #Binance #CryptoMarket #Bullish
💬 Support the Idea
If you found this analysis useful,
👉 Please LIKE 👍 and COMMENT 💬
Your support helps me share more setups daily!
⚠️ Disclaimer
This analysis is for educational purposes only.
Not financial advice. Always manage risk (1–2% per trade) and follow your trading plan.

Bitcoin’s 125k Dream or 80k Nightmare, Who Wins This GameAre you buying the top at 125k and panicking at 80k
Ever wondered why someone else always takes the profit
Let’s uncover who wins this long term Bitcoin survival match
Hello✌️
Spend 3 minutes ⏰ reading this educational material.
🎯 Analytical Insight on Bitcoin:
In my view, Bitcoin usually drops around the New Year and Christmas, and this has happened almost every year. This is normal because people are buying during this time. So we might see another small drop. But this time, unlike before, Bitcoin may not go into a long multi-year “winter.” It could bounce back to higher levels, or even new highs, much faster than in the past.
Now , let's dive into the educational section,
🌋 The Real Nature of Bitcoin
Bitcoin rewards those who understand the market’s true behavior
It acts like digital hard money with massive upside potential
Higher risk than gold yes but the payoff can be life changing
Without knowledge risk becomes panic and panic becomes loss
🏛 Hard Money vs Fiat Traps
Fiat money constantly loses value through inflation silently
People ignoring inflation stay trapped in financial decline
Bitcoin exists to protect wealth from this invisible theft
📈 Ten Years of Proof
Buying small every month would have changed your net worth
Hype buyers get wrecked but consistent buyers get rewarded
History shows deep crashes but even higher recoveries
Every major dip eventually turned into new all time highs
🏆 The Two Traits of Real Winners
First understand fiat is designed to inflate forever
Second stay consistent for years not weeks or months
Long term players always get the long term rewards
😰 Who Loses This Game
Those who see price only not the asset’s purpose
Those with hype not strategy fall at every dip
Oversized positions amplify fear and destroy accounts
🎭 Fear and Greed Control Weak Hands
Greed at the top creates bad entries no patience
Fear during crashes triggers the worst possible exits
Market simply transfers money from emotional to patient traders
🛠 Tools of TradingView for Smarter Bitcoin Plans
Set price alerts to avoid decisions made in panic
Volume Profile reveals where strong hands accumulated Bitcoin
Supply and demand zones highlight high probability reactions
Multiple timeframes prevent tunnel vision during volatility
Summary
Understand the game stay consistent and Bitcoin can serve you
Inflation won’t stop but your wealth doesn’t have to shrink
Three Key Recommendations
Think in decades not in daily candles to stay rational
Use DCA and never invest more than your true capacity
Protect emotions first because the market pays the calm ones
✨ Need a little love!
We pour love into every post your support keeps us inspired! 💛 Don’t be shy, we’d love to hear from you on comments. Big thank s, Mad Whale 🐋
📜Please make sure to do your own research before investing, and review the disclaimer provided at the end of each post.

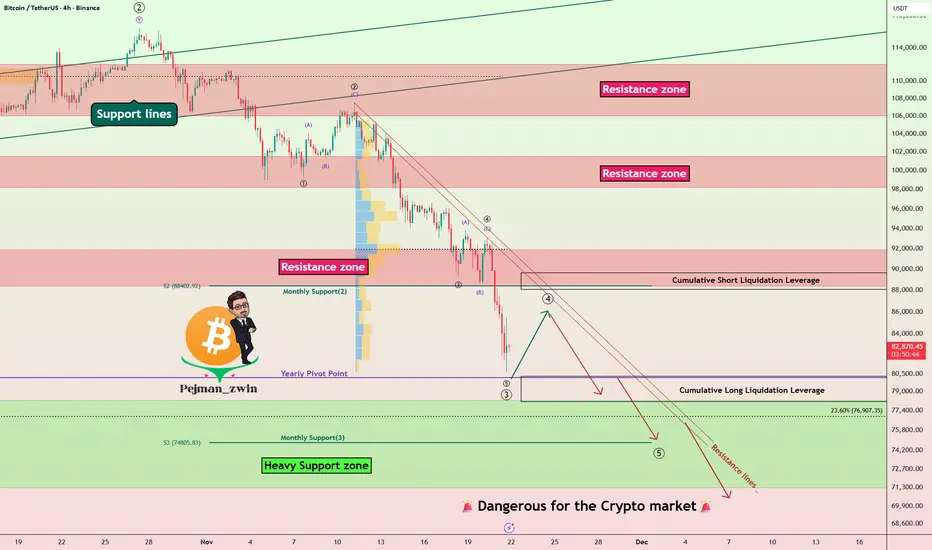
Bitcoin Hits Heavy Support Zone — Is the Next Big Crash Coming?Recently, Bitcoin ( BINANCE:BTCUSDT ) experienced another decline of over -10%, largely due to the sudden drop in the S&P 500( SP:SPX ). As I mentioned in previous ideas, in recent weeks, Bitcoin and the crypto market, especially Bitcoin, have shown a strong correlation with U.S. indices, particularly the S&P 500. This means that even technically sound analyses for Bitcoin can fail if we don’t consider these external factors, which is quite normal. Therefore, it’s crucial to incorporate all parameters—news, fundamentals, on-chain data, and relevant indices—to get an accurate Bitcoin analysis. This complexity can make things a bit challenging.
Over the past ten days, Bitcoin has swiftly broken through several support levels. Many factors have contributed to Bitcoin’s decline recently, but it’s now approaching a heavy support zone($78,300-$71,280). This zone is crucial because if Bitcoin loses it, we could see even larger declines, affecting altcoins as well. Altcoins, in general, haven’t matched Bitcoin’s gains in recent months, so a significant drop in Bitcoin could lead to severe losses for them. It’s essential to manage your investments carefully and stay alert.
From an Elliott Wave perspective, the recent decline suggests that Bitcoin might be in the midst of a five-wave downward, which isn’t positive news. There’s a chance that the heavy support zone($78,300-$71,280) might be breached. However, considering that weekends typically have lower trading volumes, it’s less likely that the support will break in the next couple of days. Still, we must remain vigilant and prepared for any scenario.
In terms of Elliott Waves, it seems Bitcoin has completed its main wave 3, and we might be looking at the completion of the wave 4 over the weekend, with another push towards the heavy support zone($78,300-$71,280) at the start of next week.
Also, the USDT.D% ( CRYPTOCAP:USDT.D ) chart looks bullish, which could not be good news for Bitcoin.
I expect that after a brief rebound, Bitcoin will resume its decline and test the heavy support zone($78,300-$71,280) again.
Cumulative Short Liquidation Leverage: $89,642-$88,079
Cumulative Long Liquidation Leverage: $80,263-$78,131
First Target: $78,523
Second Target: $75,123
Stop Loss(SL): $92,123(Worst)
Points may shift as the market evolves
Note: The S&P 500 also might face downward pressure in the coming days, which could further impact Bitcoin’s support levels. It’s essential to manage your investments carefully and wait for strong reversal signals in higher timeframes. You might miss out on some short-term gains, but it will allow for more confident entries later on.
Note: Tensions between the U.S. and Venezuela are escalating day by day. Should these tensions intensify to the point of direct confrontation, it could act as a trigger for another Bitcoin decline. It’s important to keep this in mind.
Note: Additionally, there have been some suspicious transfers involving the Mt. Gox exchange recently. It’s worth monitoring these developments closely.
💡 Please respect each other's opinions and express agreement or disagreement politely.
📌Bitcoin Analysis (BTCUSDT), 4-hour time frame.
🛑 Always set a Stop Loss(SL) for every position you open.
✅ This is just my idea; I’d love to see your thoughts too!
🔥 If you find it helpful, please BOOST this post and share it with your friends.
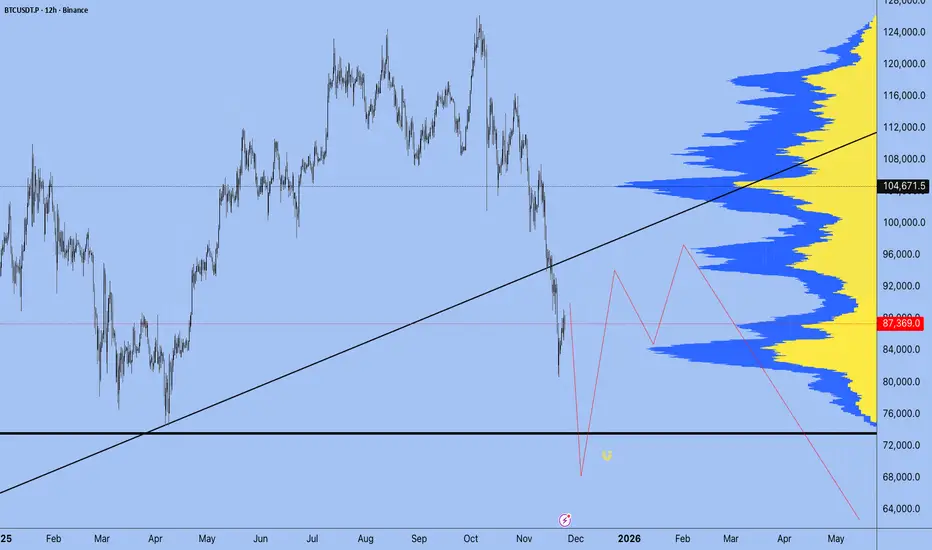
Why This Time Is Not Different — BTC Could Still Drop >50%Bitcoin is moving into a phase where long-term cycles matter more than whatever the market narrative happens to be this week.
And if you look at those cycles, one thing becomes clear: BTC has never avoided a major drop after making a new ATH.
1. The timing keeps repeating — almost to the day
Every big drawdown in Bitcoin’s history has lasted almost exactly the same amount of time:
Cycle 1: 371 days
Cycle 2: 378 days
Cycle 3: 378 days again
That kind of symmetry doesn’t happen by accident.
It’s a pattern driven by liquidity, leverage, miner economics and investor behavior.
Right now, BINANCE:BTCUSDT is lining up with that same timing structure once more.
2. The size of corrections is falling… but still huge
Past drawdowns:
–83%
–77%
The market is more mature now — more liquidity, more derivatives depth, more institutional money — so the volatility is naturally lower.
But “lower volatility” in Bitcoin still means:
👉 –50% to –70% corrections
And a drop in that range would land BTC somewhere around $40k–$50k, which is consistent with the historical pattern.
3. Market maturity doesn’t erase Bitcoin’s cycles
Even with ETFs, institutional flows, and a stronger market structure, BTC still reacts to:
leverage resets
liquidity tightening
miner selling pressure
sentiment washouts
These things don’t disappear just because the market grows.
4. What the full cycle is pointing to
If the cycle keeps rhyming with the past:
Potential bottom: roughly late 2026, at the end of another ~370–380 day drawdown
Next peak: around 2028
Long-term target: $120k–$150k+
The rhythm remains the same:
big drop → long consolidation → explosive recovery.
Takeaway
This time isn’t different.
Even in a more “institutional” Bitcoin, the cycles still point to a >50% reset before the next major expansion.

Understanding Discipline in TradingWelcome back everyone to another post. In today’s article we will dive deeper into the 3 keys of Trading success! As attached below.
Today we will be reviewing the Key “DISCIPLINE”
Just like risk management and Psychology this is also a difficult skill to maintain.
In the modern world it’s considered a skill now, because most of society doesn’t have any discipline in any field.
Let’s get started.
Definition:
When it comes to Trading Discipline. Trading Discipline means one user has the mental ability ( strength ) to follow their system. Their Trading Plan, risk management and maintain their psychology regardless of what events happen.
Trading Discipline separates profitable traders from the gamblers.
(Below I have attached the article Trader or Gambler as it relates to this post, make sure to give it a read!)
Discipline ensures that the user makes the right decisions based on strategy and logic instead of FOMO, ego and greed.
It is not just about following rules though. Discipline relates to the outside world of cultivating habits, mindsets and self-control too.
1) Understanding Trading Discipline
Firstly, you must truly grasp what it actually means. Most individual traders confuse it with stubbornness. They think it’s about holding on to trades or forcing a system. In reality, it’s only about consistency and self-control! Simple right?
Example:
Imagine, you have a system. A trading plan. It has the 1% rule where you don’t risk more than 1% of your account per trade. Understanding discipline means you must know why that rule is in place. It’s too protected your capital! Not breaking it after a few losses just to catch up.
Real Life Analogy:
A professional runner trains every day. They do it even when they are sad, tired, unhappy and unmotivated. This is discipline. Discipline drives long term results. Discipline is continuing it no matter what the current situation is.
2) Implementing Trading Discipline
The process of implementation is nothing complicated. It’s only turning knowledge into action. Knowing about it won’t do anything, you must maintain the effort of consistently applying it to each step in your system.
How to implement it:
- Follow your plan: Before each trading day starts, read out your system and tell yourself you will follow it. Even if no set ups appear, you will still succeed because you followed your plan.
- Set risk rules: Apply proper risk management and lot management so you don’t cave into fear. Apply the 1:3 Rule or 1:4 Rule.
- JOURNAL your TRADES Damn it: Record every trade, your reasoning, and whether you actually followed your rules. Don’t just add a screen shot and nothing else. YOU won’t succeed if you don’t journal your trades properly.
Example:
A novice trader may plan to place an entry when price is at $50 and exit at $55 with a 2% risk per trade. Even if it dips to price $48, they hold to the stop loss accepting the loss instead of moving it and hoping it “recovers”
Real Life analogy:
Think of it as budgeting every day, or for a holiday, or your next maccas run. You set a weekly budget plan and stick to it. Even when tempted by special deals, sticking to your budget allows for long term financial health to take place. Just like risk management but with real life.
3) Maintaining Trading Discipline
Discipline can’t act overnight, it’s the process of small steps working your way up to solid consistency over time. Even when feelings run high – discipline isn’t one time. It’s daily practice.
Some strategies are:
- Reviewing your previous trades daily or at the end of each week during a market close. Assess your wins and losses.
- Build up emotional awareness, be aware of what fear, greed and overconfident emotions take place.
- Reward yourself to the rules of your system, not just profitable outcomes.
If you reward yourself for not trading in one day because not a single set up appeared, you were still successful because you didn’t “force” a set up and take a gamble.
Example:
A trader might experience 3 losses in the first hour of the day, even if they were all A++ set ups. Instead of revenge trading, he sticks to his plan, accepts the L and leaves the charts for the rest of the day to reset mentally and gain a win in another field, eg – Gym.
Real-life analogy:
By maintaining a healthy lifestyle, you must apply the same approach. You don’t stop exercising after a few days off. Discipline keeps you aligned even when your motivation and mental strength fades.
4) Adapting without breaking your Discipline
Long story short, Markets move, Markets change, Markets can and WILL evolve.
Traders must adapt. Not just allows their system to adapt, but their psychological mindset of discipline.
Adapting can be confusing but it can be done by:
- Don’t switch up new strategies, adjust your current system slightly then back test and forward test it on demo accounts. Eg Paper trading.
- Update your trading system based on data and monthly results, not emotions.
- Avoid making sudden changes right after losses.
Example:
Let’s say a forex strat no longer works due to low volume and volatility. A strict trader tests adjustments in their demo accounts, then incorporates them into the plan after they have received positive data from tests.
Real-life analogy:
A chef might change his recipe based on a specific ingredient availability but will not ignore the core cooking principles. It’s about adapting strategically, not impulsively.
5) Reinforcing Discipline Through mindset and daily life.
Discipline in the trading field is just amplified by the discipline process outside of trading. It follows the exact same process. Daily habits and mindset directly impact one’s trading performance.
To reinforce discipline, you can:
- Maintain routines: Wake up at consistent times. Don’t wake up at 3:00am to “grind” if you do that, you’re stupid – you’ll burn yourself out and make the process harder.
Plan your day and review goals. Eg do a brain dump every morning, write down or type out all ideas, thoughts and emotions and sort it out.
- Practice mental training: People suggest doing personal journaling or meditation. Just go for a walk in the morning for 5 minutes. First thing in the morning, feel the fresh breeze, air, sunlight and nature. You simulate the mind and body in a natural way allowing for you to think clearly and train your mind.
- Change your environment: surround yourself with work dogs, people who are strict on routines, self-improvement, self-development, individuals who don’t slack off.
Example:
Traders who can control their time well, exercise, eat healthy can maintain their stress in trading better than one who does not focus on outside habits.
Real-life analogy:
A school student who studies consistently every day and night rather than squishing it all in before exams perform better. Just like a trader who can maintain structured habits inside and outside of the market.
Conclusion:
Trading discipline is more than following rules, it’s a mindset and a lifestyle, it relates to the world outside of trading. Just like psychology, if you can’t master it outside, you won’t master it inside.
It's about understanding your own weaknesses and adjusting the system to hold structured rules that will allow it to be more easily achievable for yourself.
Remember, trading is not sunshine and rainbows.
It’s about building a system and following it. It is the hardest way to make “ easy ” money.
To find out what the other 2 keys are, review the 3 posts below where I explain the 3 keys to trading success, and go deeper into each of them!

Bitcoin: Final Pump Before the Fall?Over the past five to six days, Bitcoin ( BINANCE:BTCUSDT ) has been attempting to recover from previous weekly declines, and it still appears to be in a corrective phase. This analysis builds on my previous idea, and if you’d like a deeper look at Bitcoin’s mid-term chart, you can check out the 4-hour timeframe in that previous analysis .
Now, a key point for Bitcoin traders is that, despite the recent rally in the S&P 500 ( SP:SPX ) over the past few days, Bitcoin hasn’t been able to keep pace. While it had a good correlation with the S&P 500 in the past, it didn’t experience a similar upward movement this time. Therefore, once the S&P 500 corrects, we may also see Bitcoin resume its downward trend.
Currently, Bitcoin seems to be near a resistance zone($92,200-$88,400) and Cumulative Short Liquidation Leverage($91,570-$89,660). It also appears to be forming an ascending channel over the past few days, indicating a corrective structure.
From an Elliott Wave perspective, Bitcoin seems to be completing microwave C of the microwave Y of the main wave 4, and we can expect this corrective phase to end soon, leading to another downward move. A break of the lower line of the ascending channel would confirm the end of this Wave 4.
I expect that after the Cumulative Short Liquidation Leverage($91,570-$89,660), Bitcoin will resume its decline and move towards the Support zone($86,200-$85,130).
Cumulative Long Liquidation Leverage: $86,000-$85,000
Cumulative Long Liquidation Leverage: $83,249-$81,840
Cumulative Long Liquidation Leverage: $80,263-$78,131
First Target: $86,290
Second Target: $83,800
Stop Loss(SL): $92,229
Points may shift as the market evolves
Note: At lower price levels, Bitcoin’s price includes several Cumulative Short Liquidation Leverages, each potentially causing further price drops. However, if the S&P 500 starts another correction, these levels may break more easily.
Note: Overall, trading in crypto has become a bit challenging lately, with less volatility, so it’s wise to be cautious and manage your capital carefully.
Note: If Bitcoin breaks through the resistance zone($92,200-$88,400) around $92,229, we can expect a renewed upward trend and hope for a bullish movement.
💡 Please respect each other's opinions and express agreement or disagreement politely.
📌Bitcoin Analysis (BTCUSDT), 1-hour time frame.
🛑 Always set a Stop Loss(SL) for every position you open.
✅ This is just my idea; I’d love to see your thoughts too!
🔥 If you find it helpful, please BOOST this post and share it with your friends.

The beginning of Bitcoin’s next drop could coincide with end QTveryone thinks the market pumps after QT policies end…
But look at early July — first the market dropped sharply. The same thing could get triggered in December and repeat the previous pattern.

Bitcoin recovers rise again moveBitcoin is showing signs of bullish consolidation after a prolonged decline into key support. Based on the current range structure, the market may be preparing for an upward move.
The recovery aligns with broader market sentiment, as U.S. stock indices recorded their fourth consecutive session of gains, driven by expectations of potential Federal Reserve interest-rate cuts.
From a technical perspective, if Bitcoin can hold bullish momentum and secure a 4H candle close above the 90,000 level, it would strengthen the case for continuation to the upside. After the recent long fall, price may look to retest overhead resistance in the 98,000 – 105,000 zone.
You may find more details in the chart.
Trade wisely best of Luck buddies.
Ps; support with like and comments for better analysis thanks for supporting.

Final 2025 Forecast for BTCUSDT 24th November 2025 (Updated)Same idea as previous post, just zoomed in to see the potential gyrations towards to move towards ~$128k and hopefully beyond ✌️
1. Friday session dip to around ~$81k
2. Pump to around ~$87k over the weekend
3. Dump down to ~$80k for Monday Trap
4. Black Friday Pump to ~$89k
5. Max Pain Dump to ~$75k-$79k
6. Final pump to ~$128k to end the cycle
If we are lucky and price pullbacks from ~$128k and then exceeds it. Here are the targets I would be looking at;
Target #1 $140k-$145k,
Target #2 $170k-$175k
Target #3 $200k-$205k
This of course could be 100% wrong so remember (as always) to ruthlessly ✂️ cut your losers when wrong, and hold ✊ onto your winners when right.
--
I might also add, come early December 1st - 5th the following celestial events will take place which support the run up to $128k (and possibly beyond);
1. Super Full Moon (“Cold Moon”) 🌖
• On December 4, 2025, there’s a nearly full moon (~98% illuminated). 
• This will be a supermoon, meaning the Moon appears slightly larger and brighter than average. 
• The Moon is in Taurus, and near the Pleiades (M45) — Taurus is represented no other than the Bull.
Supermoons correlate with:
• spikes in emotion
• increased speculative behavior
• temporary liquidity expansions
• bigger candles (up OR down)
A near-super full moon tends to:
• mark volatility apexes
• precede relief rallies
• create short-term “energy reversals”
2. Moon–Jupiter conjunction (Dec 7) — traditionally expansive 🌖
Jupiter is symbolically linked with:
• expansion
• optimism
• big moves
• risk-on thinking
• growth
• speculation
When the Moon (sentiment) aligns with Jupiter (expansion), it often coincides with:
• higher risk appetite
• FOMO
• bullish short-term flows
In Summary;
1. Moon–Jupiter conjunction (Dec 7) → Expansive, optimistic, risk-on symbolism
2. Super Full Moon (Dec 4) → Volatility peak → Reversal → Upward burst

BTC - Bulls Watching the Channel Support!📈Bitcoin remains overall bullish, trading cleanly inside its rising channel. Each dip toward the lower bound has acted as a strong springboard for the next impulsive move, showing clear demand from buyers.
⚔️As BTC approaches the lower trendline of the channel and the green demand zone, we will be looking for trend-following longs. This confluence area has held multiple times and continues to act as a key decision point for market structure.
🏹As long as BTC remains above this zone , the bullish scenario remains intact, and another push toward higher highs becomes the most likely outcome. Only a break below the demand zone would weaken the bullish outlook.
Now it’s all about the retest… will the bulls defend structure once again? 🤔
⚠️ Disclaimer: This is not financial advice. Always do your own research and manage risk properly.
📚 Stick to your trading plan regarding entries, risk, and management.
Good luck! 🍀
All Strategies Are Good; If Managed Properly!
~Richard Nasr

BTC: The Bitcoin bounce is not a trend reversal🚫 The Bitcoin bounce is not a trend reversal
Here’s why the current move looks more like a liquidity trap than a real bullish reversal:
- Momentum is lagging — the rebound isn’t supported by strength.
- Liquidity spikes look engineered to squeeze short positions rather than coming from genuine buyers.
- ETFs are selling while BTC is pumping → classic exit liquidity behaviour.
- We remain in a bearish trend, and the current flag pattern is on the verge of breaking. Statistically, these patterns break down, with targets equal to the size of the previous leg.
- Price is rising while volume is falling → this is a hidden bearish divergence on volume.
🎯 What I’m seeing
It looks like many institutions were caught off guard by the depth of this downtrend, and now they’re trying to reduce exposure.
They appear to be engineering a bounce to attract retail FOMO, allowing them to exit with smaller losses — a classic liquidity extraction move.
As I’ve mentioned several times already:
👉 The primary trend remains bearish until Q2 2026, though we should expect bounces and manipulative moves along the way.
⚠️ My advice
Don’t deploy all your capital into a fake FOMO rally and become the institutions’ exit liquidity.
Wait for a proper bottom confirmation, such as:
A W pattern, followed by a successful retest with a higher low.
❌ Invalidation
This analysis becomes invalid only if the current pattern breaks upward with strong volume.
DYOR
BTC at Key Support Zone - Bullish Setup in Progress? - UPDATEBTC at Key Support Zone - Bullish Setup in Progress? - UPDATE
Bitcoin has reached a major long-term support zone between 75,100 – 80,800, an area that previously acted as strong support in March 2024 and April 2025 on the monthly timeframe.
Currently, BTC reacted as we expected from our previous analysis and has already reached 92000.
Yesterday, during the European evening, the price broke out of the triangle pattern and started the upward movement.
A small pause is possible before BTC moves further.
I would not be surprised if this is the beginning of another upward wave, at least towards our targets, or if it can retest the all-time high price zone.
The retest of the monthly 75100 - 80800 zone was very important for the bulls to join BTC at a better price.
Key targets:
94150
98000
106500
You may find more details in the chart!
Thank you and Good Luck!
❤️PS: Please support with a like or comment if you find this analysis useful for your trading day❤️
BTCUSDT: Bullish Push to 98500?BINANCE:BTCUSDT is eyeing a bullish reversal on the 4-hour chart , with price rebounding from a broken level near cumulative long liquidation, converging with a potential entry zone that could trigger upside momentum if buyers defend against further dips. This setup suggests a recovery opportunity after recent pullback, targeting higher resistance levels with excellent risk-reward.🔥
Entry between 87500–88500 for a long position (entry at current levels with proper risk management is recommended). Targets at 95000 (first), 98500 (second). Set a stop loss at a close below 85000 , yielding a risk-reward ratio up to 1:3 overall. Monitor for confirmation via a bullish candle close above entry with rising volume, leveraging Bitcoin's resilience post-correction.🌟
Fundamentally , Bitcoin is consolidating around $89,000 in late November 2025 after a sharp retreat from its all-time high of $126,000, driven by fading momentum and institutional caution amid a 15%(from top) October decline contrary to historical patterns. Despite dipping below $85,000 recently (trough at ~$80,553), fundamentals remain strong with institutional investors holding steady, reduced Fed rate cut expectations supporting USD strength, and long-term forecasts eyeing upside to $240,000 driven by macro asset behavior and cycle highs. Bitcoin correlates with the S&P 500 , and recently we've seen growth in the S&P 500. 💡
📝 Trade Setup
🎯 Entry (Long):
87,500 – 88,500
(Entry at current levels with proper risk management is also valid)
🎯 Targets:
• 95,000 (first)
• 98,500 (second)
❌ Stop Loss:
• 4H close below 85,000
⚖️ Risk-to-Reward:
• Up to 1:3 on full run
👇 Share your thoughts below! 👇

BITCOIN → Retest of the 94,000 zone of interest...BINANCE:BTCUSDT.P is rebounding from its interim low of 80,000. However, it is still too early to talk about a bull market, as a countertrend correction is forming under the current circumstances.
Globally, Bitcoin is in a downtrend, with the zone of interest for a countertrend correction being 94,000-95,000. The market structure is bearish, and a retest of the break-even zone could trigger a downward movement within the trend.
After a strong liquidation to 80K, the market is forming a pullback, which is a basic phenomenon. There is no confirmation of a trend reversal yet, and the fundamental background is neutral, without clear support. Various analytical services suggest that the market is in a cleansing phase and has so far only liquidated short-term traders, reaching a cumulative average break-even price. A classic pullback. Technically, the zone of interest or magnet for the medium-term market is 75K (on the daily timeframe).
Resistance levels: 93,000, 94,000, 97,300
Support levels: 89,000, 86,000
In the current situation: a bearish trend, weak purchasing power, and a weak fundamental background, I consider a pullback to be the primary reaction to the 93-94K zone. However, the market is not constant, and if support appears (news or other drivers) and Bitcoin manages to stay above 95K, then growth can be expected.
Sincerely, R. Linda!

$BTC USDT 2D NEW CHART UPDATECRYPTOCAP:BTC USDT 2D NEW CHART UPDATE ✅
📌The fall that started with the CRYPTOCAP:BTC rising wedge breakout is still ongoing.
📌It has completed all the targets in my previous analysis.
📌 CRYPTOCAP:BTC could see a bullish reversal from the limits I have marked below (70k - 73k), if that happens, CRYPTOCAP:BTC will cross the 100K mark again 🔥🚀
