Lingrid | BTCUSDT Consolidation Period Following CorrectionBINANCE:BTCUSDT remains under heavy pressure after a sharp rebound from 102K met resistance near the 114K–115K zone. The market continues to respect its downward structure within the broad descending channel, suggesting sellers are still in control. A rejection around the trendline could confirm a new bearish leg toward 107.5K or even 102K if weakness accelerates. Overall momentum favors further downside as lower highs keep forming under resistance.
⚠️ Risks:
Sudden bullish breakout above 115K could invalidate the bearish channel.
Positive macro news or ETF inflows could trigger short-term recovery.
Oversold market conditions may lead to a temporary corrective bounce.
If this idea resonates with you or you have your own opinion, traders, hit the comments. I’m excited to read your thoughts!
Trade ideas

The bitcoin below 110K is cheap !!DO NOT MISS!!As previously outlined, Bitcoin remains within a confirmed bullish market structure that, according to our analysis, has not yet concluded. From a valuation perspective, the current price zone represents a significant accumulation opportunity, trading at levels we consider to be highly attractive within the broader macro uptrend.
Critically, the region below $110,000 aligns with historically significant on-chain support zones. These levels are widely monitored as potential accumulation territories by large-scale investors, often referred to as 'whales.' Market microstructure analysis suggests that these entities are likely to continue building long positions within this value area, providing substantial underlying bid support.
This period of institutional accumulation is typically a precursor to the next leg of the bullish trend. The primary technical objective following this consolidation phase is a sustained breakout above the $140,000 resistance level, which would confirm the resumption of the dominant upward impulse.
DISCLAIMER: ((trade based on your own decision))
<<press like👍 if you enjoy💚

23/10/2025 Bitcoin BEAR TRAP PATTERN bantuBTC/USDT 4H – Potential Bear Trap Setup
Bitcoin is currently consolidating after a sharp drop from the $116K region. The structure suggests a potential bear trap before a strong bullish continuation.
Key Highlights:
Minor Break of Structure (BoS) around $109K indicates weakening bearish momentum.
Buy Zone: $101,100 – $102,100 (strong demand area and liquidity grab zone).
Possible bullish reversal expected from this zone.
First target at the Fair Value Gap (FVG) between $115,600 – $116,900.
If FVG breaks, extended targets lie between $130,000 – $144,000.
Trading Plan:
Wait for price reaction or confirmation inside the buy zone Under $102.000.
Enter after structure shift or BOS on lower timeframe.
Take profits at $115K – $117K, extend towards $130K+.
Stop loss below $90,000 for invalidation.
Summary:
This setup represents a potential “Bitcoin Bear Trap” scenario — where smart money may push price lower to collect liquidity before driving a strong rally upward. Bearish momentum is fading, suggesting the market may soon shift bullish.

BTC/USDT Analysis. Where to Next?
Hello everyone! This is CryptoRobotics trader-analyst, and here’s your daily market review.
Yesterday, Bitcoin followed the first scenario we highlighted earlier. Although the $108,000 zone didn’t immediately hold the price and we saw a short-term dip, selling pressure didn’t resume after the rebound, so we now consider it a solid support.
According to our previous outlook, we expect a move toward the strong resistance zone at $111,800–$113,000.
If the $108,000 area is retested — now extended to $108,700–$107,500 — we’ll be watching for a local long setup.
Currently, sellers are almost absent, which adds further confidence to this scenario.
Buy Zones:
$108,700–$107,500 (volume zone)
$105,600–$104,500 (volume anomalies)
$97,000–$93,000 (volume zone)
Sell Zones:
$111,800–$113,000 (strong volume anomalies)
$114,400–$115,600 (local volume zone)
$120,900–$124,000 (volume zone)
This publication is not financial advice.

BITCOIN LONG TIME FOR SOME NEW LONGS.
People think btc will go down . I do not think that btc is going to go down yet, long and strong .
Ready for new alt season.

TradeCityPro | Bitcoin Daily Analysis #204👋 Welcome to TradeCity Pro!
Let’s go over today’s Bitcoin analysis, Bitcoin is still ranging, so let’s take a close look at the market together.
⏳ 1-Hour Timeframe
Yesterday, Bitcoin had a short position trigger at the 107,486 zone, which was activated.
🔔 The break of this level created a short-term bearish move, and if you had opened a position on Bitcoin, you probably hit your stop-loss by now.
✨ However, considering the dominance charts, short positions on altcoins made more sense — and if you had opened them, they likely hit their targets.
✔️ Currently, after the fake-out of this zone and the breakout above 108,943, price has made a bullish move up to the next resistance area at 110,213.
💥 Now, price has returned again to the 108,943 level. Volume has decreased along this move, and overall, this drop in volume shows that the market isn’t in a great condition — so the best move for now is to stay without a position.
📊 For short-term trades, if price breaks 110,213, we can open a continuation long position.
💡 For short positions, the current trigger is still 107,486, but since this level has already been faked once, we should wait for another reaction to it — and only open a position if it breaks again on the next attempt.
❌ Disclaimer ❌
Trading futures is highly risky and dangerous. If you're not an expert, these triggers may not be suitable for you. You should first learn risk and capital management. You can also use the educational content from this channel.
Finally, these triggers reflect my personal opinions on price action, and the market may move completely against this analysis. So, do your own research before opening any position.

#BTC retests support at 104,000. Can it hold?📊 #BTC retests support at 104,000. Can it hold?
🧠From a structural perspective, the pullback after reaching our ideal red target zone makes sense. After the October 11th crash, market liquidity suffered a devastating blow, so we're likely to see some period of sideways consolidation. Therefore, we continued to reduce our holdings after hitting our short defensive point, locking in a total of 80% profit. Our long position has now been closed at our cost price.
➡️This is the third time we've tested support near 107,400. The more times it's tested, the weaker the support becomes. However, don't chase shorts near this support level. Even if you do short, wait for a break below this support level and a rebound before considering a short position.
➡️If the decline continues, support near 105,188 or the solid support at 103,588 (where we last entered a long position) is worth watching.
Let's see 👀
🤜If you like my analysis, please like 💖 and share 💬 BITGET:BTCUSDT.P

Bitcoin - Ultimate Swing Short As a compilation and summary of my previous ideas explaining in depth this signal - the why, when, how - here are the specific details for this swing short position.
Entry - 109,000 to 109,200
Stop Loss - 113,600
Target 1 - 97,600
Target 2 - 81,000
Target 3 - 63,400
Target 4 - 34,800
(Here is where I’ll potentially be signalling for a hedge long on Bitcoin from 34,700 to 80,000 - trading the retracement wave)
Target 5 - 20,000
Target 6 - 8,000
Ultimate wick bottom expected to be 7,200 to 7,800 range.
Good luck to all and any questions at all, please comment below.
I’ve linked any related ideas to this post here which you can view below.
- DD

BTC shortWe have a short print in BTc. Let's see how it plays out. Overall trend is bearish. We do have a order block at 106400 area but we hope we will reach the target.

Bitcoin - BTCUSDT – Daily NeoWave AnalysisStructure: Contracting Triangle (ABCDE)
Current Price: $108,985 (+1.3%)
🧠 Wave Structure Overview
Bitcoin’s daily chart is forming a Contracting Triangle pattern under NeoWave principles (Glen Neely).
This triangle appears to be part of a wave (4) correction within a larger impulsive cycle, consisting of subwaves A–B–C–D–E with well-balanced price and time proportions.
🔹 Wave Details
Wave A: Decline from 126K → 104K
Type: Impulsive start, setting the corrective tone.
Wave B: Sharp recovery to 123K (≈78.6% retrace of A)
Type: Zigzag – strong bullish response typical for triangles.
Wave C: Pullback to 106K, forming a 3-wave Flat correction.
Wave D: Rally to 118–119K, reaching 70% of wave B — perfectly proportional for a contracting structure.
Wave E: Final leg down toward 106K–107K, with diminishing momentum and volume — a textbook NeoWave E-wave behavior signaling triangle completion.
🔍 Technical Observations
Strong bullish divergence between price and RSI/OBV at the E-wave low.
Decreasing volume during wave E → confirms a terminal corrective phase.
Price remains above the long-term rising trendline and key demand zone near 106K.
🟢 Primary Scenario (≈70% Probability)
Triangle completed at E-wave (106K) → beginning of wave (5) to the upside.
Targets:
1️⃣ 115K–118K – short-term breakout zone
2️⃣ 123K–126K – retest of triangle resistance
3️⃣ 138K–145K – extended target if wave (5) unfolds impulsively
🔴 Alternative Scenario (≈30% Probability)
If BTC breaks below 106K, wave E may extend deeper toward 102K–100K, forming a Running Triangle E before a strong bullish reversal.
⚙️ Summary
✅ Current pattern: Contracting Triangle (ABCDE)
✅ Position: End of wave E of (4)
📈 Expectation: Start of wave (5) impulsive advance
⚠️ Invalidation: Daily close below 102K
Conclusion:
BTC is likely completing a major corrective phase. Holding above 106K keeps the bullish breakout scenario valid — watch for a decisive move above 111K–112K to confirm the next impulsive leg.

Bitcoin Short Position — Target 106,376 Ahead of U.S. Market OpeA short position on Bitcoin is open with a target at 106,376.
I expect a short-term decline, possibly starting with the U.S. market opening.
Entry: 109,443
Stop-loss: 111,083
Take-profit: 106,376

Bitcoin: Strong Downtrend – Don’t Miss the Sell Chance!Hello traders,
Although Bitcoin showed a slight recovery on Wednesday, the crypto market is still struggling after the sharp decline in early October. Selling pressure remains strong, as the market hovers near recent lows with no clear signs of recovery.
With uncertainty surrounding the U.S. economy and ongoing trade tensions with China, investors are avoiding risk – further weighing on risky assets like Bitcoin. In addition, the drop in gold prices hasn’t provided enough buying momentum for the crypto market to rebound.
The BTC/USDT chart clearly shows a strong downtrend with a steep descending trendline, and resistance around $112,000 has already been pushed back. The price is expected to continue falling, with the next support area around $102,000.
A great opportunity to sell Bitcoin and take advantage of this downtrend!

BIG DUMP IN BTCUSDTBTCUSDT has shown strong upward momentum due to liquidity grabs, a Break of Structure (BOS), and inducement. Consequently, we have a Point of Interest (POI) in BTCUSDT. It may correct to 89000, then potentially to 63000, which could lead to significant altcoin depreciation.

BTC 4H Analysis | Day 8🥳 Hey everyone! Hope you’re doing great! Welcome to SatoshiFrame channel.
✨ Today we’re diving into the 1-Hour Bitcoin analysis. Stay tuned and follow along!
👀 On Bitcoin’s 4-hour time frame, as shown in the chart, we can see that after a series of declines, Bitcoin has consolidated inside a large 4H range (box). This box has been classified by traders and is currently being “priced in” for the market’s next move. For now, price is still some distance from the top of the box, but the mid-range area, where price is currently hovering, could be a good zone for a potential long setup.
⛏ Multi time frame levels (1H and 15M) have already triggered signals for traders, and price is now moving toward $111,144. A breakout above this level could confirm a long entry. However, breaking this resistance may be challenging and could have a lower win rate, so we’ll use a more conservative risk approach for this move.
🧮 Looking at the RSI oscillator, it’s forming a short-term oscillating resistance near the overbought zone. The 65 level aligns beautifully with the $111,144 price resistance, meaning if RSI breaks above this threshold, that resistance could be taken out, allowing momentum to push further into the overbought region.
🕯 Bitcoin’s volume over the past few days has been strong enough to support powerful moves, but the activity has been mostly indecisive, aimed at liquidity collection within the range. If you pay close attention, you’ll notice extremely precise triggers forming at the box’s highs and lows. In short, large amounts of capital that are expected to exit gold are still in a phase of indecision, and Bitcoin hasn’t yet absorbed that risk capital.
🧠 I’m considering two main scenarios for Bitcoin’s position:
🟢 Scenario 1
Breakout above the $111,144 resistance, accompanied by RSI crossing above 65 and a noticeable increase in buy volume, signaling intent for a Bitcoin pump.
🟢 Scenario 2
Set a buy stop with a larger stop size, staying positioned for a gradual breakout. As Bitcoin breaks higher levels, we can scale in with additional volume.
❤️ Disclaimer : This analysis is purely based on my personal opinion and I only trade if the stated triggers are activated .

“BTC Range Watch: Break Above 112K = Bull Run, Below 103K = TrouGot it 👍 — so the key resistance is 112,250, not 122,000.
Here’s your corrected and polished TradingView-ready English version 👇
BTCUSD – Key Range Breakout Coming 🚀 or 🔻
Bitcoin is currently moving inside a major range, showing indecision between bulls and bears.
If BTC manages to break above 112,250, it could trigger a strong bullish move toward the 133,000 zone.
However, if the price drops below 103,770, we may see a deeper correction toward the 82,088 support level.
The market is at a critical turning point — a confirmed breakout from this range will likely set the next major trend for BTC.
📊 Key Levels:
Resistance: 112,250 → 133,000
Support: 103,770 → 82,088

BTCUSDT — Bearish Structure Intact, Watching for BreakdownHello everyone, here is my breakdown of the current Bitcoin setup.
Market Analysis
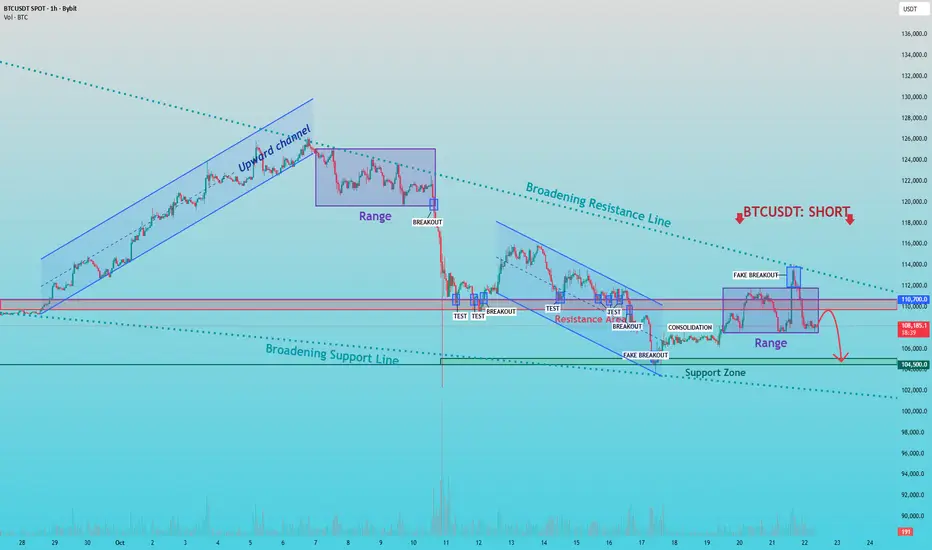
From a broader perspective, BTCUSDT has been trading inside a broadening formation, marked by expanding highs and lows — a typical sign of increasing volatility and market uncertainty. After a strong upward move within an ascending channel, the structure broke down, shifting the market momentum from bullish to bearish.
Following the breakdown, price entered a period of range-bound consolidation and multiple tests of resistance, each confirming that sellers remain in control. The most recent fake breakout above the 114,000 zone served as a strong rejection signal — a clear sign that buying momentum is fading and that the market could be preparing for another leg down.
My Scenario & Strategy
My scenario is based on the idea that the current movement is a corrective rebound within a larger bearish structure. As the price approaches the resistance area around 110,700, I expect selling pressure to increase once again. The plan is to watch how the price reacts around this resistance zone. A confirmed rejection or failure to break above this level would validate the short scenario, potentially leading to a continuation move toward the 104,500 support zone, which aligns with the lower boundary of the broadening formation.
That's the setup I'm tracking. Thank you for your attention, and always manage your risk.
First transition has been correctly executedNot that it was a target, but just a good feeling to see mtops-ai take price to the first target :D
The key to the mtops-ai forecasts is that it provide the expected market shape and timing of the price pivot points, not to trade on every signal.
Trading rules are always the king...don't trade against trend being one of them

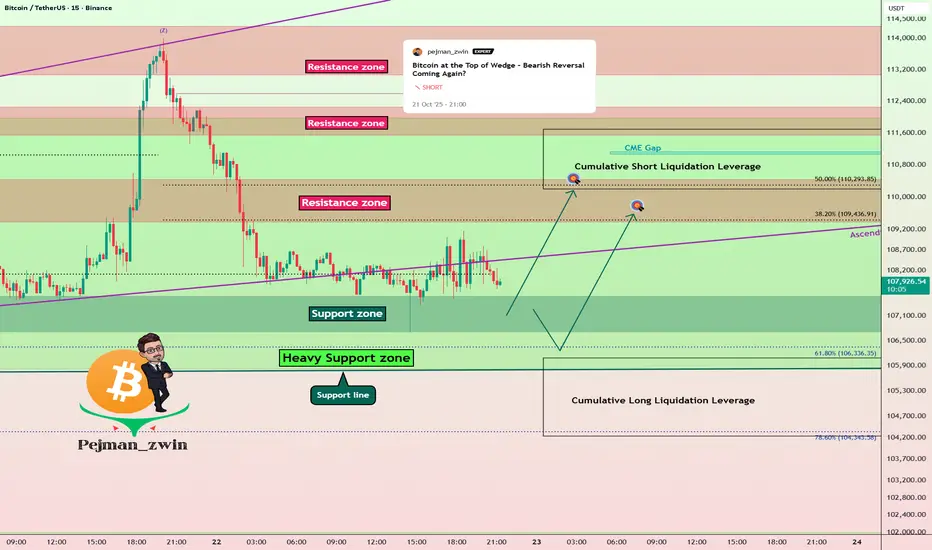
Bitcoin Short Term Setup – One More Push Before Fall?As I expected in yesterday’s idea , Bitcoin( BINANCE:BTCUSDT ) dropped down into the lower ranges of the Heavy Support zone($111,980-$105,820) .
Today, I want to share a quick 15-minute timeframe analysis with you.
Currently, Bitcoin is moving near that Support zone($107,580-$106,700) , but it hasn’t managed to break the lower line of the ascending broadening wedge pattern with strong momentum .
So I expect Bitcoin might at least make another move up to the Resistance zone($110,430-$109,380) . If BTC finds a Short Trigger near the Resistance zone and Cumulative Short Liquidation Leverage($111,687-$110,198) , it could drop sharply afterward, potentially breaking the Heavy Support zone eventually.
Cumulative Long Liquidation Leverage: $106,090-$104,234
Stop Loss(SL): $104,077
Please respect each other's ideas and express them politely if you agree or disagree.
Bitcoin Analysis (BTCUSDT), 15-minute time frame.
Be sure to follow the updated ideas.
Do not forget to put a Stop loss for your positions (For every position you want to open).
Please follow your strategy and updates; this is just my Idea, and I will gladly see your ideas in this post.
Please do not forget the ✅' like '✅ button 🙏😊 & Share it with your friends; thanks, and Trade safe.
Bitcoin Correction Continues: Buyers’ Last Stand at 106KHello, traders, I want share with you my opinion about Bitcoin. After a strong bullish impulse, BTCUSDT reached a local high and entered a consolidation phase, forming a clear range. The subsequent breakout to the downside signaled the start of the current corrective phase. At the moment, the price is moving within a descending structure, defined by a resistance line from recent lower highs and a support line connecting local lows. The market recently retested the previous Support Level (now acting as resistance) near 109,000 and is showing bearish pressure again. Currently, the price is trading near the Buyer Zone (106,000–107,000), which previously served as a strong demand area. I expect the market to test this zone once again, where buyer reactions will determine the next move. I think that BTC will consolidate between the Buyer Zone and Resistance Line, forming a potential accumulation before any decisive breakout. If buyers manage to defend 106,000, we could see a rebound toward the 110,000–112,000 region. However, a confirmed breakout below the Buyer Zone would open the path to TP1 = 106,300 and possibly extend the correction lower. Please share this idea with your friends and click Boost 🚀

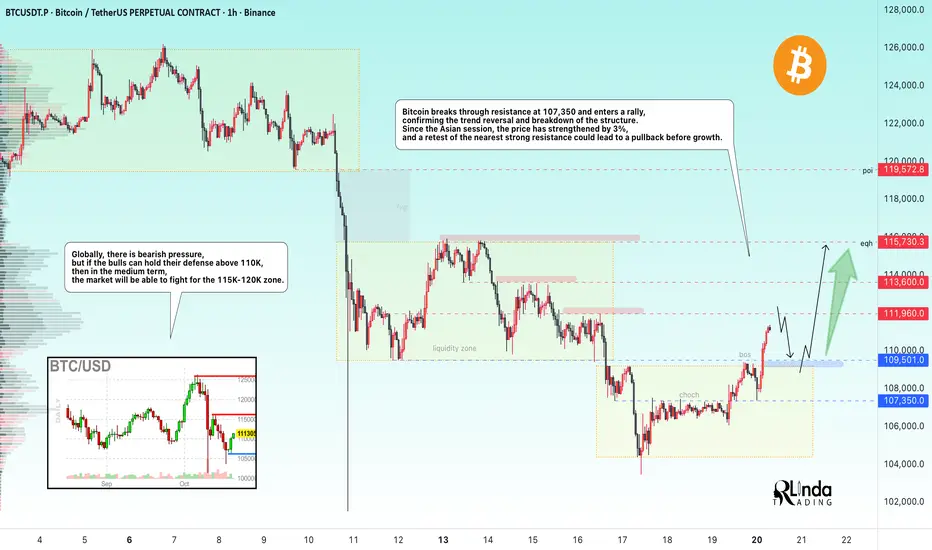
BITCOIN → Trend reversal. Is there a chance for growth?BINANCE:BTCUSDT.P is breaking the trend and local market structure, forming a rally. Giving hope to buyers, we see a strong reaction from the Asian session. Are the bulls returning?
The fundamental background is unstable; if Trump continues to escalate the trade war, the cryptocurrency market may close within the range. However, technically, we have positive signs of a bull market. BTC is breaking through the resistance level of 107,350 and entering a rally, which only confirms the change in trend and the breakdown of the structure. Since the Asian session, the price has strengthened by 3%, and a retest of the nearest strong resistance at 112K-113.6K could lead to a pullback before growth.
Globally, there is bearish pressure, but if the bulls can hold their defense above 110K, then in the medium term, the market will be able to fight for the 115K-120K zone.
Resistance levels: 111960, 113600, 115730
Support levels: 109700, 109200
In the short term, I expect a false breakout of the specified resistance and a correction of 1/2 of the local impulse, i.e., a retest of the 110K - 109200 support zone, which, in turn, could lead to another bullish run to 115K - 120K.
Best regards, R. Linda!
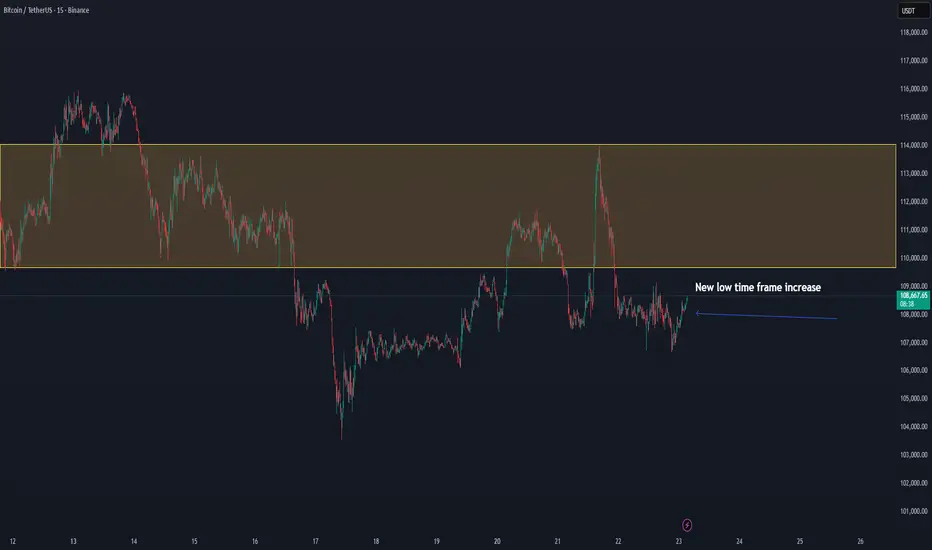
BTC/USDT — New Low-Timeframe Expansion Forming, Potential 114k+Bitcoin is beginning to show strength in the new low-timeframe structure, reclaiming the $108K zone with rising momentum. This confirms a short-term bullish shift after the recent consolidation.
The key resistance range between $110K–$114K remains the main obstacle, but if BTC maintains higher lows and continues to push within this structure, a move toward $118K becomes likely.
📊 Technical Overview:
Support: $106K–$108K
Range Resistance: $110K–$114K
Next Upside Target: $118K
Bias: Bullish on low-timeframe momentum
BTC’s ability to sustain above the $108K region suggests growing buyer confidence — confirmation above $110K could trigger continuation toward the upper range.
📈 Outlook: Low-timeframe expansion
🎯 Targets: $110K → $114K → $118K
latest mtops-ai Bitcoin Forecast suggests downtrend cont'It appears we have lower highs and lower lows incoming
Today I've included the time and the price values for the next transition
The time value is expressed via the vertical trendline underneath the next price reversal (see chart)
The price is expressed with the Entry, Stop Loss and Target values along the y-axis (price column)

DO OR DIE BTC FORMING SYMETRICAL TRIANGLE IN 4HRSPossible Scenarios
✅ Bullish Scenario:
Breakout above triangle + retest could lead BTC to test 0.5–0.618 Fib zone ($113k–$116k).
RSI moving above 55–60 would confirm strength.
Watch for liquidity sweep above previous “OB” and “$$$” zones — could target POI.
❌ Bearish Scenario:
Breakdown below $103,255 support invalidates bullish structure.
Price could then revisit $100k or $92k (-0.382 Fib) area — the next demand zone.
