TradeCityPro | Bitcoin Daily Analysis #230👋 Welcome to TradeCity Pro!
Let’s move on to today’s Bitcoin analysis. A new week has finally begun, and Bitcoin may once again start a strong momentum-driven trend.
⏳ 1-Hour Timeframe
Yesterday, Bitcoin continued its corrective upward move and retraced up to the 0.5 Fibonacci level.
✨ This level is extremely important — both in Fibonacci analysis and across many technical styles — and it can determine how the next major price wave forms.
✔️ For now, the price has been rejected from this level and has made a small downward move.
If the bearish movement continues, we can consider opening a short position on Bitcoin.
💥 Breaking 85,209 will be the first confirmation of a bearish trend.
Breaking 82,214 will be the main confirmation that a new downward trend has begun.
📊 If the market continues deeper corrections to the upside, the main resistance zone remains 89,000.
🔔 A stabilization above 89,000 will be the first confirmation of a new bullish trend beginning.
The full confirmation of a bullish reversal will come only after the 93,555 level is broken.
❌ Disclaimer ❌
Trading futures is highly risky and dangerous. If you're not an expert, these triggers may not be suitable for you. You should first learn risk and capital management. You can also use the educational content from this channel.
Finally, these triggers reflect my personal opinions on price action, and the market may move completely against this analysis. So, do your own research before opening any position.
Trade ideas

Bitcoin Poised for Recovery After Support Rebound Eyes on $105kBitcoin (BTC/USDT) on the 1H chart has bounced from the $99,500 support zone after breaking a short-term ascending trendline. The Ichimoku Cloud signals possible resistance near $102,400, with a bullish target set around $105,000–$107,500 if momentum continues. A clear breakout above $102K could confirm a short-term trend reversal toward higher highs.
🔍 BTC/USDT (1H) Technical Analysis — Key Points
1. Trend Structure:
Bitcoin broke below its ascending trendline from Nov 7–12, signaling short-term weakness.
The current move is a retest of the broken trendline, acting as new resistance.
2. Ichimoku Cloud:
Price is trading below the cloud, indicating a bearish short-term sentiment.
Kijun (baseline) near $102,400 is the immediate resistance level.
Future Cloud (Senkou Span A/B) shows potential flattening — early sign of possible reversal if price re-enters.
3. Support & Resistance Levels:
Major Support: $99,500 – $97,500 zone (buyers stepped in here).
Immediate Resistance: $101,700 – $102,400 zone.
Next Target Zone: $105,000 – $107,500 if breakout confirms.
4. Volume & Momentum:
Weak bearish momentum after the sell-off — potential for a relief rally.
A bullish confirmation needs strong candle close above $102,500 with volume.
5. Short-Term Outlook:
If Bitcoin stays above $99,500, bulls may push to reclaim $102K.
Failure to break above could lead to further downside toward $97,500.

BITCOIN WEEKLY PERSPECTIVE BITCOIN ,the supply roof is around 101.7k-102k-103k.on daily time frame we had a strong daily break of demand floor and on technical ,we are calling for retest and the expected retest zone is likely to be around 101k-103k and bearish confirmation on 15min will be needed for sell order.
the direction of BITCOIN price action has changed from our trading pattern.
the next support could be around 74k-70k zone based on the structure ,however lets watch 91-90$ level .
worst case sell off will be 54K$-50k$
BITCOIN FUNDAMENTAL.
Bitcoin is the world's first decentralized cryptocurrency, launched in 2009 by an unknown person or group using the pseudonym Satoshi Nakamoto. It allows peer-to-peer transactions without relying on banks or central authorities. Bitcoin transactions are recorded on a public ledger called the blockchain, which is maintained by a network of computers (miners) that validate and secure transactions through cryptographic proofs.
What is Bitcoin?
Bitcoin is a digital currency that enables secure and transparent transfers over the internet.
Not owned or controlled by any single entity—it operates on a decentralized network.
Uses blockchain technology to maintain a permanent, public transaction record.
Supply is capped at 21 million coins, making it a scarce, deflationary asset.
Network Security and Hash Rate: The computing power devoted to mining, indicating network strength and resilience.
Transaction Volume and Adoption: Growth in users, wallets, and real-world usage reflect demand.
Supply Schedule: Bitcoin’s issuance halves roughly every four years, reducing new supply and potentially driving scarcity.
Institutional Interest: Investment flows from funds, corporations, and ETFs show confidence and liquidity.
Regulatory Environment: Legal clarity or restrictions impact market sentiment.
Macro Factors: Inflation trends, fiat currency strength, and geopolitical uncertainties influence Bitcoin as a store of value or risk asset.
Summary
Bitcoin is a decentralized digital currency secured by cryptography and maintained on a blockchain network. Its fundamentals include the network’s security, supply scarcity, adoption rates, institutional interest, and macroeconomic influences, all of which shape its price and long-term value proposition.
GOODLUCK.

Short-term analysis of Bitcoin (12H)After the heavy drops | which we had already identified in previous analyses () | Bitcoin is now approaching a strong supportive order block.
From the point where we marked the red arrow, Bitcoin entered a bearish phase, and it is expected that wave C of this phase will complete around the green zone.
We will see whether the price reaches the green area or not.
The initial target for this bounce can be the 95K to 96K range.
For any reason, the closing of a daily candle below the invalidation level will break the structure and invalidate this upward correction
For risk management, please don't forget stop loss and capital management
When we reach the first target, save some profit and then change the stop to entry
Comment if you have any questions
Thank You

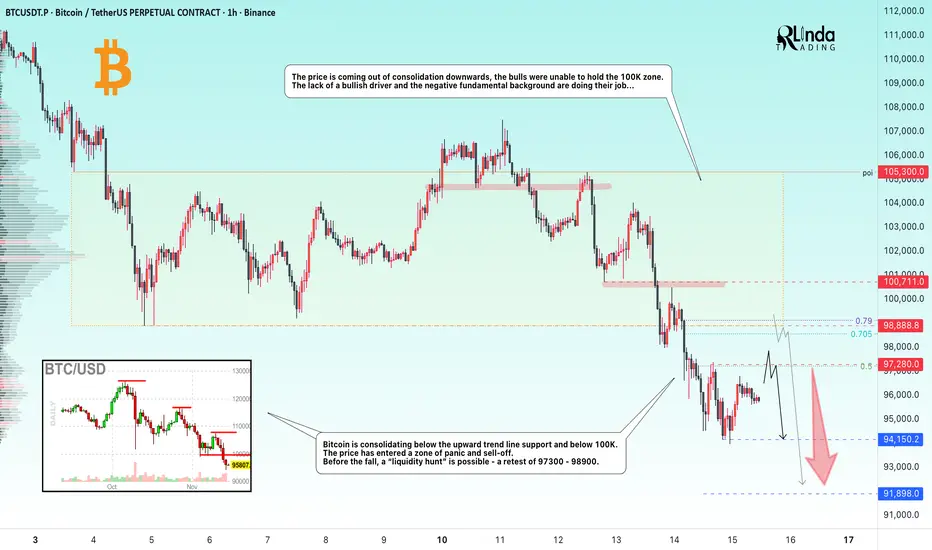
BITCOIN → 100K broken. Consolidation in the short zone...BINANCE:BTCUSDT.P broke through the 100K support level and is consolidating within the local range of 94,150 - 97,280. The decline may continue if the market does not receive support (news or other bullish drivers).
Bitcoin is consolidating below the upward trend line of support and below 100K. The price has entered a zone of panic and sell-off. Before the fall, a “liquidity hunt” is possible - a retest of 97300 - 98900.
The price is coming out of consolidation downwards, the bulls were unable to hold the 100K zone. The lack of a bullish driver and the negative fundamental background are doing their job...
Resistance levels: 97280, 98900, 100700
Support levels: 94150, 91900
Before further decline, the market may test the previously broken support zone relative to the upward lower trend line. Focus on the 97280 - 98990 zone. A false breakout and lack of bullish momentum could form a reversal pattern and trigger a decline to 94150 - 91900.
Best regards, R. Linda!
Bitcoin - Is This Where The Pain Finally Ends?Bitcoin has been grinding lower for about a month after sweeping the previous all time high, which created the shift that kicked off this broader downtrend. Since that sweep, every push up has been met with selling, and the market has slowly bled its way back into a major support zone that has been significant in earlier cycles. This is the kind of level where the market usually makes a statement, either by holding and reversing or by breaking and opening the door to a deeper move.
Support Structure and Key Reaction Point
Price is sitting inside a wide support band that has given strong reactions in the past. It is a level traders know well and one that typically slows the market down. The difference this time is the structure leading into it. The downtrend has been consistent, with a string of lower highs showing that sellers remain in control for now. How the daily candle closes inside this zone will tell us a lot about whether buyers still have enough strength to defend it or if this level finally gives way.
Recent Liquidity Events and Daily Gap Behavior
Before dropping into this support, Bitcoin ran a recent daily high and instantly filled the gap above it, making it clear that the move was more about collecting liquidity than shifting the trend. After that, price slid lower again and retested the inside of the daily imbalance, but the retest failed to spark any meaningful demand. That kind of behavior often hints at a market that is still hunting lower levels rather than building upside structure.
Bullish Scenario
For sentiment to turn, Bitcoin needs to close back above the midline of this zone. That level is the one that would show buyers are actually stepping back in and absorbing the sell side. If the market can reclaim it, a short term reversal becomes possible, and the first targets would be the inefficiencies left behind during the recent selloff. From there, the market would still need to break a series of lower highs before a proper shift is confirmed on the daily timeframe.
Bearish Scenario
If the daily candle fails to close above that internal level highlighted on the chart, viewers should expect continuation lower to become the more probable scenario. A failed close there tells you buyers did not manage to hold the midpoint of the range, which usually means the market is preparing to reach for deeper liquidity. In that situation, the next major support zone below becomes the logical draw, and the path shown on the chart, a small bounce followed by another leg down, fits well with the current momentum.
Conclusion
Bitcoin is sitting at a decision point. Either this support zone does its job again and gives the market enough fuel for a recovery, or the daily close confirms that the level has weakened and the market is ready to reach for the next higher timeframe support. Until that close gives clarity, patience is key, since this is typically where traders get chopped if they try to force a direction too early.
___________________________________
Thanks for your support!
If you found this idea helpful or learned something new, drop a like 👍 and leave a comment, I’d love to hear your thoughts! 🚀

Bitcoin (BTC): Bitcoin Fell Below $90K | Buyers Reclaim QuicklyA rollercoaster ride is happening on the markets, where BTC dipped below $90K (yet buyers managed to retake the dominance over that area).
This is a very important zone, as losing control over this would result in a very deep correctional movement, which might turn into the bearish market (or the start of it).
What we are expecting, though, is the reversal to happen and just like last time, a re-test of 100 EMA, which would be ideal after the recent dip we had!
Swallow Academy

BITCOIN SIGNAL: BUY NOW!!!!!!!? (trap) Yello Paradisers! Enjoy the video!
And Paradisers! Keep in mind to trade only with a proper professional trading strategy. Wait for confirmations. Play with tactics. This is the only way you can be long-term profitable.
Remember, don’t trade without confirmations. Wait for them before creating a trade. Be disciplined, patient, and emotionally controlled. Only trade the highest probability setups with the greatest risk to reward ratio. This will ensure that you become a long-term profitable professional trader.
Don't be a gambler. Don't try to get rich quick. Make sure that your trading is professionally based on proper strategies and trade tactics.

BTC/USDT – WEEKLY ANALYSIS (W1)🔵 BTC/USDT – WEEKLY ANALYSIS (W1)
Structure: Elliott Wave 5 (current wave = (4) correction)
This updated version of your chart adds Fibonacci extension targets for Wave (5), giving a much clearer projection.
1️⃣ Wave (4) Is Near Completion
Price has:
✔ Dropped sharply into the BIG Liquidity Zone (80k – 83k)
✔ Swept long-term trendline liquidity
✔ Tagged the 0.9 retrace marker (typical deep wave-4 behavior)
✔ Formed a weekly BOS during the drop
✔ Entered a historically strong demand zone
This fits perfectly with a complex corrective Wave (4).
2️⃣ Expectation: Reversal Soon
Wave (4) typically ends:
At big liquidity
At the trendline
Before violating Wave (1) territory
After a weekly BOS + wick
Your chart shows all these ingredients → a bottom is likely forming inside 80k–83k.
A bullish engulfing weekly candle here = wave (5) confirmation.
3️⃣ Wave (5) Target Zones (Fibonacci Extensions)
Your chart shows 4 major upside levels:
🎯 Target 1 — 100,757
First reaction level.
This is the 1.0 extension zone — often the first major resistance.
🎯 Target 2 — 109,998
Strong historical resistance + 1.272 extension.
Wave 5 usually passes this easily if momentum is strong.
🎯 Target 3 — 124,069
Major mid-range target.
This is where Wave 5 often pauses or makes a micro-correction.
🎯 Target 4 — 140,241 (−0.272 Fib)
This matches perfectly with standard Wave-5 overextensions.
Final upside zone before a large cycle top.
This is also the level shown at the top of your chart — very good placement.
4️⃣ Summary: BTC Weekly Outlook
✔ Wave (4) in progress but almost complete
✔ Liquidity grab is textbook
✔ Next move = impulsive Wave (5)
✔ Upside targets: 100.7k → 110k → 124k → 140k
✔ Macro trend remains strongly bullish
BTC is following nearly perfect Elliott Wave symmetry from your W1 structure.

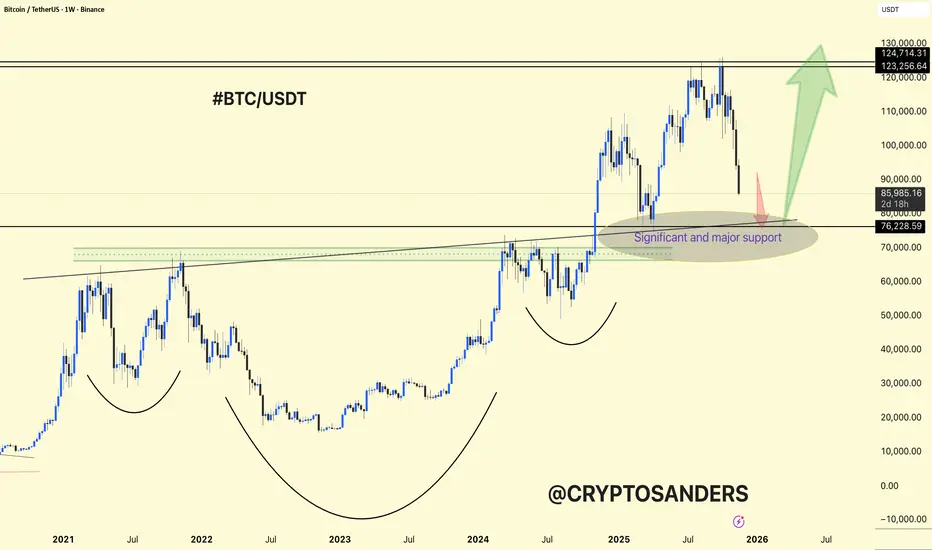
BTCUSDT Weekly Chart Analysis. BTCUSDT Weekly Chart Analysis
Major Structure: Bitcoin is experiencing a significant correction, now testing the most important multi-year support zone around $80,000–$82,000.
Patterns: The chart shows multiple rounded bottoms and a massive base structure, indicating repeated accumulation phases since 2021.
Support Zone: This highlighted area is not only a former breakout region but also converges with major horizontal and trendline support levels, making it highly significant for bulls.
If buyers defend this zone, a swift rebound toward $123,000–$130,000 is likely, maintaining the long-term uptrend.
Failure to hold here increases risk for deeper corrective moves, and the next support would be much lower.
Momentum Shift: The steepness and sharp drop into support reflect panic or forced selling, often associated with extreme sentiment lows.
DYOR | NFA
BTCUSD: Onchain data: Good Buy?A. Onchain current landscape:
- MVRV Ratio: Dropped from 1.83 to 1.64
- Well below the 2.0 "heated market" threshold
- Far from the 3.5 "overheated" danger zone
Interpretation: Market is NOT overextended; substantial upside room remains
- Net Unrealized Profit/Loss (NUPL): Declined from 0.45 to 0.39
Entered "Anxiety" zone, trending toward "Fear". Historically, NUPL below 0.40 marks excellent accumulation zones
Signal: Weak hands being shaken out, strong hands accumulating
B. Exchange Flow Dynamics: Smart Money is Accumulating
Critical Pattern Observed:
- Nov 11: -2,579 BTC (outflow - accumulation)
- Nov 12: -659 BTC (outflow - accumulation)
- Nov 13-14: +777 BTC, +5992 BTC (large inflows during panic selling)
- Nov 15-16: Mixed flows, continued selling pressure
- Nov 17: -4,036 BTC massive outflow
Analysis: The -4,036 BTC outflow on Nov 17, as price stabilized around $92k, is the first reversal signal. Smart money accumulated aggressively at depressed prices while retail capitulated.
C. SOPR Analysis: Capitulation in Progress
Spent Output Profit Ratio (SOPR) Timeline:
- Nov 11-12: Above 1.0 (healthy profit-taking)
- Nov 13-17: Below 1.0 (0.989-0.994)
Critical Insight: When SOPR falls below 1.0, it means investors are selling at a loss, a classic capitulation signal. This typically marks local bottoms and excellent entry points for patient buyers.
It means, we need to be patient and accumulate on key supporting levels.
D. Supply Dynamics: Weak Hands Exiting
Supply in Profit: Dropped from 73.6% to 64.5%
35.5% of BTC supply is now underwater (up from 26.4%)
This reset creates a stronger foundation for the next leg up
Investors who bought near the top are capitulating, clearing sell pressure
Whale Accumulation: Follow the Smart Money
BTC whales added ~30,000 BTC during the dip
Value: ~$3 bln in fresh whale accumulation
E. Technical levels:
- Strong supporting zone: 85000-88000.
- Confluence with descending channel's lower bound.
F. The Edge:
While headlines scream "crypto winter" and retail capitulates in fear, seasoned investors recognize this as a gift, a chance to accumulate a scarce, institutional-grade asset at a 26-30% discount from all-time highs, with clear onchain evidence of smart money accumulation.
Analysis by: Dat Tong, Senior Financial Markets Strategist at Exness

BTC MAJOR RALLY INCOMING!!!Get ready for the major #Bitcoin rally soon.
Buying region 83-80k targeting upto 165k.
You also know what else is going to come with it ;)

Bitcoin is copying the previous cycle and is beginning a bearishBitcoin is copying the previous cycle and is starting a bearish cycle.
We are approaching a zone that typically forms after breaking the 365-day MA.
From that support zone, we bounce back toward the previous resistance area.
But that level is nothing more than a bull trap waiting for us, and after that everything turns into hell.
Believe in the cycles when everyone else is lying

TradeCityPro | Bitcoin Daily Analysis #229👋 Welcome to TradeCityPro!
Let’s dive into the Bitcoin analysis. Today, the market has made a deeper upward correction and is moving towards higher resistance levels.
⏳ 1-Hour Timeframe
After the downward move to the 82,214 zone, Bitcoin started a range and correction phase, and yesterday, it ranged between 82,214 and 85,209.
✨ After the price began to correct, a higher low was formed at 83,680, which allowed buyers to show some strength, and now the price has stabilized above 85,209.
✔️ This upward move continued to the 0.382 Fibonacci level, which I consider to be the first resistance level Bitcoin has reacted to.
⭐ If the price starts to drop from here and can stabilize below the 85,209 level, bearish momentum will return to the market, and we can get the first confirmation of a new downward wave.
🧮 The main confirmation for the start of this new wave will come after breaking the 82,214 level. Until then, any short position we open will be an early trigger.
🎲 Overall, Bitcoin has a very large support zone on the weekly timeframe, and this zone is between 75,000 and 90,000, where the price is currently located.
🔭 As long as the price is in this range, all positions are risky. Personally, I will reduce my risk, as traders’ win rates tend to decrease in such range-bound areas.
📊 For long positions, it’s still too early. I will wait until the price stabilizes above 89,604. This will be the first sign of buyer strength. The main confirmation for the bullish trend will come after stabilizing above 93,555.
❌ Disclaimer ❌
Trading futures is highly risky and dangerous. If you're not an expert, these triggers may not be suitable for you. You should first learn risk and capital management. You can also use the educational content from this channel.
Finally, these triggers reflect my personal opinions on price action, and the market may move completely against this analysis. So, do your own research before opening any position.

So What now ??Hey everyone,
let's cut the noise and talk seriously about where Bitcoin (BTC) is at right now.
For months, I've been saying what a lot of people didn't want to hear: the ideal trading range for BTC has to be somewhere in the $40,000 to $60,000 zone.
I got mocked, ignored, and even straight-up cursed out for saying that when the price was flying high. Everyone was chanting "$100k, $200k!" and acting like gravity didn't exist.
Well, look where we are now. BTC is roaming around $80-85k, a significant drop from those all-time highs.
The future feels... well, unknowable to those who only looked up.
But for those of us who kept one foot on the ground, this pullback isn't a shock; it's a return to a healthier balance.
🧐 Why the Fall Happened: No Magic Money Tree
The drop didn't come out of nowhere. It's a combination of simple market mechanics and shifting sentiment. Let's break down the three big reasons why the party ended:
1-The $100k+ Support Just Wasn't There:
Let's face it, sustained price action above $100k requires an insane amount of new, constant capital. The demand just couldn't keep pace with the towering valuation. When the buying dried up, the price had to correct to a level where new investors saw value again, or where old holders decided to take profits. The market ran out of steam, and the volume needed to hold those upper levels simply wasn't there.
2-Long-Term Holders Got Tired of Waiting:
You call them "Diamond Hands," but even the most dedicated long-term holders (LTHs) have a breaking point. After a massive run-up and then an extended period of stagnation at the top, many LTHs started thinking, "This is good enough." Taking profit after a multi-year hold is a natural part of the market cycle, and when enough big wallets decide to cash out, it creates a powerful selling pressure that crushes the price floor.
3-The Altcoin Allure:
The ETH Factor: As BTC got super expensive, the percentage return on a $1,000 price move started to feel insignificant. At $100k, a $1k move is just 1%. Meanwhile, competitors like Ethereum (ETH) offered a more appealing risk-to-reward ratio. When $1,000 means a 3-5% gain on a mid-level price, traders and even institutions start to migrate to where the potential for profit is mathematically greater. Traders are profit-driven, and ETH offered a more "profitable range" for active players.
🔮 What Now? The Balance of Waves
So, what's next? More brutal crashes? Unlikely. What we are likely entering is a period of choppy, sideways consolidation—a return to that healthy $40k–$60k range over time, or at least a deep, volatile consolidation between $60k and $85k as the dust settles.
This is the cycle: Euphoria leads to Correction, which leads to Consolidation.
The fall won't be a straight line. It will continue in waves—sometimes up, sometimes down. We'll see dead-cat bounces that trick new money into buying, followed by more downside.
The goal for the market now is to find a new balance between risk and profitability. This balance isn't found at the peak; it's found in the middle ground.
Why? Because the standard profitable range for retail and even whales is when smaller price differences still mean meaningful percentage gains.
Remember the Math:
At $100,000, a $1,000 move is 1%.
At $50,000, a $1,000 move is 2%.
At $30,000, a $1,000 move is ~3.3%.
The lower range offers a higher percentage return for the same absolute dollar change, making it a much more attractive area for accumulating or trading. The price needs to drop to where the perceived risk of a further fall is balanced by the reward of those higher percentage gains.
🧭 So What now ??:
Trade the Range, Ignore the Noise
The days of easy 10x returns might be on pause, but the opportunity for smart, methodical trading is back. We are entering a trader's market, not a HODLer's dreamland.
Stick to your charts, define your support and resistance, and trade the range, not the rumor. The market is giving us a second chance to accumulate at realistic prices. Don't waste it by listening to the ghosts of "$200k."
Good luck , Good hunt and Trade safe guys !

DeGRAM | BTCUSD continues to decline below $85k📊 Technical Analysis
● BTC/USD continues to move within a broad descending channel, rejecting the dynamic resistance line multiple times and forming lower highs.
● Price is failing to reclaim the 88–90K resistance zone, and the structure points toward a continuation lower into the 82–80K support region as momentum weakens.
💡 Fundamental Analysis
● Bitcoin remains under pressure as risk sentiment cools and ETF inflows slow, with stronger USD liquidity weighing on crypto.
✨ Summary
Resistance: 88–90K. Targets: 82K → 80K. Medium-term bearish bias while below channel resistance.
-------------------
Share your opinion in the comments and support the idea with a like. Thanks for your support!

BTC price is too high and a crash is imminent.
I've been saying Bitcoin would fall since last week, and I was right!
Now I have a new perspective on Bitcoin: Bitcoin is on the verge of a deeper collapse after falling below $100,000, predicting a sharp sell-off driven by deleveraging, waning investor optimism, and pressure on the broader crypto market.
Meanwhile, I believe cryptocurrency valuations are unsustainable compared to gold. A Bitcoin price of $100,000 should be seen as a time to sell, not an opportunity to accumulate; Bitcoin's high price will not last.
Wide leverage could exacerbate future declines, especially for those who have borrowed Bitcoin as collateral. HODLers use Bitcoin as collateral for loans to buy other assets or pay personal expenses without selling their holdings, predicting: "In the upcoming crash, these Bitcoins will be liquidated at even lower prices, exacerbating the decline. Many will not be able to obtain enough cash to pay their tax debts."
If you sell your Bitcoin now, you can buy some real goods. I think you know what I mean!

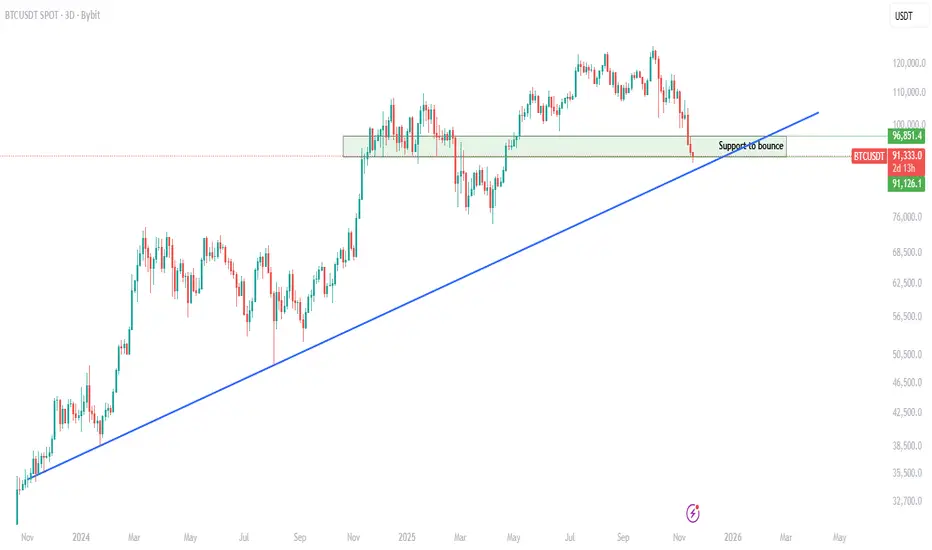
$BTC – Key Support TestCRYPTOCAP:BTC has reached the same support zone we highlighted earlier.
Price is reacting exactly at the trendline + horizontal support, which increases the probability of a relief bounce from this area.
As long as this support holds, BTC can push back toward the mid-range levels shown on the chart.
BTC Absolute Bottom is 76,500 SHORT THEN LONG to new ATH's30- 40% correction is usually a good pullback historically speaking. The last pullback similar to this one was January 2025 - April 2025 totalling a 32% retracement . thereafter taking off from $74,500 to ATH's.

BTC Bullrun is over - prepare for $ 50.000 price targetAccording to my calculations based on historic data from BTC the top of BTC was reached in October '25 and it did. You can see on the graph when you zoom out on the monthly chart that the price has broken down from a bullish channel. This happend in '21 too. As you can see on the graph.
All indicators show that bullish momentum is weaking and are moving to strong bearish phase.
Don't let anyone fool you by saying that you are a morron for selling BTC now. And those who claim that they are still buying BTC every day. You don't know what they really are doing behind the scenes...
BTC is not really what it is framed to be.
It should have been an alternative from current financial system. Now it's going to be part of a new Government financial systems.
It should be decentralized. But two companies own more than 50% of the BTC Network.
It should be the new world currency, but is that really going to happen? Transanction costs are way to expensive to make it a world currency accessible for everyone.
BTC is the only way to preserve your money, but is that really the case when price can fall with -40%?
And if it's true that Epstein was one of the investors in BTC development from the early beginnings.
Do you still want to hold BTC?
I'm questioning if BTC is really the promised money for a free and equal world. How is that the case when Governments and Corporate businesses are buying up BTC?

What happen to btc next in weekly rsiCan we do this again?
Each time when we reached at this level oglf rsi
In weekly we had massive up trend on btc.

$BTC = THIS IS NOT BUY THE DIP YET!An updated analysis on Bitcoin price action.
Let chasers buy the dip first.
Feel free to comment and argue against. In fact, I want to hear your opinions.

BTC 1DMy view on Bitcoin trends and structure based on Elliott Waves
Pay attention to the volume. Every time we had a drop, the volume increased.
Maybe wrong... Maybe right
