Bitcoin - More blood coming! Buy 57k (extremely strong support)Bitcoin is currently in a very sharp decline, because the price dropped in the past 4 months by 53%. A lot of people didn't expect such high volatility because they are even new to the market, or they thought that ETF would reduce the overall volatility of this market. The truth is that the market i
Related pairs

This Isn’t a Reversal — It’s Only Phase Two. $BTC>65k Thank you for your attention! This is exactly what you've been hearing since September 2025. Next, we'll form the bottom, and reaccumulate until October.
A smart person told me to stop posting publicly. Make everything private, but I continue to publish my thoughts for you.
There are no entry point
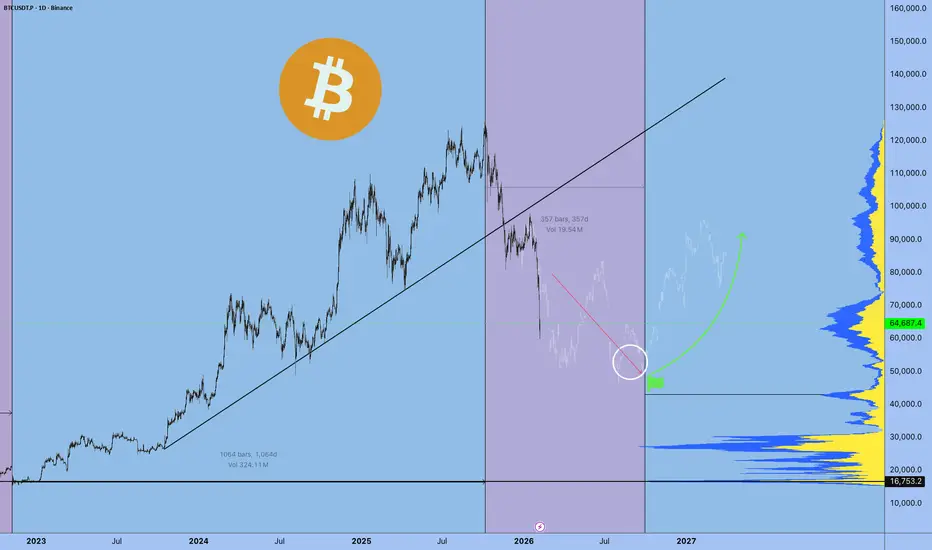
Bitcoin - When History RhymesMarket Context and Historical Symmetry
Bitcoin has a tendency to move in recognizable cycles, and what stands out right now is the near-perfect similarity between the previous bull market correction and the current one. During the 2021 cycle, price retraced approximately 52% from the all-time high
BTCUSD Daily CLS Model 1 - Short term BuyHi friends, new range created. As always we are looking for the manipulation in to the key level around the range. Don't forget confirmation switch from manipulation phase to the distribution phase to make the setup valid. Stay patient and enter only after change in order flow. If price reaches 50%

Bitcoin - Last drop, then a huge pump! (watch this wedge)Bitcoin is currently trading at around 78,000 at the time of writing this article, and I expect the price to go down to 71k - 72k in the short term. Why? As we can see on the chart, there are many reasons why Bitcoin should go down. The first reason is that whales (banks, institutions) still didn't

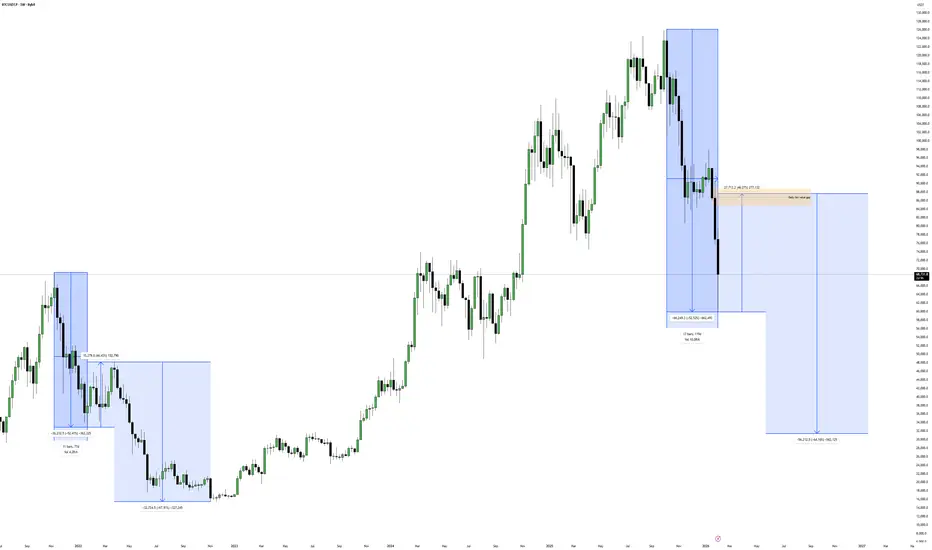
BTCUSDT: Fake Breakout From Support Signals Potential Long SetupHello everyone, here is my breakdown of the current BTCUSDT setup.
Market Analysis
BTCUSDT previously traded within a large symmetrical triangle, where price was gradually compressing between the triangle resistance and support lines. This phase reflected market indecision and liquidity buildup,

The Anatomy of a Bottom. Why the $60k Breakdown Isn't the EndGreetings, everyone.
Today, we are going to perform a deep dive into the most critical process in any market: the formation of a bottom. I want to share with you not just patterns, but the very psychology and mechanics of a reversal, a subject I have been studying and honing since 2019. For my trad

TradeCityPro | Bitcoin Daily Analysis #261👋 Welcome to TradeCity Pro!
Let’s move on to Bitcoin analysis. After the recent sharp drop, the market is now going through an upward corrective move.
⏳ 1-Hour Timeframe
After Bitcoin’s bearish move down to the 62,824 support, it entered a corrective phase and has so far retraced up to 71,670.
✔️

Why Risk Management matters more than WIN RateWhy Risk Management matters more than WIN Rate
Welcome everyone to another educational article.
If you are enjoying these, please make sure to follow for more!
Lets get started.
Definitions:
Risk Management > Is the process of defining:
- What you can afford to lose completely
- The per

BTCUSDT Lower Highs, Lower Lows - Bears in Full ControlHello traders! Here’s my technical outlook on BTCUSDT (3H) based on the current chart structure.BTCUSDT previously traded within a well-defined ascending channel, where price consistently respected both the rising support and resistance lines. This structure reflected a controlled bullish trend with

See all ideas
Summarizing what the indicators are suggesting.
Oscillators
Neutral
SellBuy
Strong sellStrong buy
Strong sellSellNeutralBuyStrong buy
Oscillators
Neutral
SellBuy
Strong sellStrong buy
Strong sellSellNeutralBuyStrong buy
Summary
Neutral
SellBuy
Strong sellStrong buy
Strong sellSellNeutralBuyStrong buy
Summary
Neutral
SellBuy
Strong sellStrong buy
Strong sellSellNeutralBuyStrong buy
Summary
Neutral
SellBuy
Strong sellStrong buy
Strong sellSellNeutralBuyStrong buy
Moving Averages
Neutral
SellBuy
Strong sellStrong buy
Strong sellSellNeutralBuyStrong buy
Moving Averages
Neutral
SellBuy
Strong sellStrong buy
Strong sellSellNeutralBuyStrong buy
Displays a symbol's price movements over previous years to identify recurring trends.
Frequently Asked Questions
The current price of Bitcoin / UST (BTC) is 66,919.00000000 USDT — it has fallen −2.30% in the past 24 hours. Try placing this info into the context by checking out what coins are also gaining and losing at the moment and seeing BTC price chart.
Bitcoin / UST price has fallen by −11.29% over the last week, its month performance shows a −26.14% decrease, and as for the last year, Bitcoin / UST has decreased by −30.14%. See more dynamics on BTC price chart.
Keep track of coins' changes with our Crypto Coins Heatmap.
Keep track of coins' changes with our Crypto Coins Heatmap.
Bitcoin / UST (BTC) reached its highest price on Oct 6, 2025 — it amounted to 126,180.00000000 USDT. Find more insights on the BTC price chart.
See the list of crypto gainers and choose what best fits your strategy.
See the list of crypto gainers and choose what best fits your strategy.
Bitcoin / UST (BTC) reached the lowest price of 3,800.90000000 USDT on Mar 14, 2019. View more Bitcoin / UST dynamics on the price chart.
See the list of crypto losers to find unexpected opportunities.
See the list of crypto losers to find unexpected opportunities.
The safest choice when buying BTC is to go to a well-known crypto exchange. Some of the popular names are Binance, Coinbase, Kraken. But you'll have to find a reliable broker and create an account first. You can trade BTC right from TradingView charts — just choose a broker and connect to your account.
Crypto markets are famous for their volatility, so one should study all the available stats before adding crypto assets to their portfolio. Very often it's technical analysis that comes in handy. We prepared technical ratings for Bitcoin / UST (BTC): today its technical analysis shows the strong sell signal, and according to the 1 week rating BTC shows the sell signal. And you'd better dig deeper and study 1 month rating too — it's sell. Find inspiration in Bitcoin / UST trading ideas and keep track of what's moving crypto markets with our crypto news feed.
Bitcoin / UST (BTC) is just as reliable as any other crypto asset — this corner of the world market is highly volatile. Today, for instance, Bitcoin / UST is estimated as 2.08% volatile. The only thing it means is that you must prepare and examine all available information before making a decision. And if you're not sure about Bitcoin / UST, you can find more inspiration in our curated watchlists.
You can discuss Bitcoin / UST (BTC) with other users in our public chats, Minds or in the comments to Ideas.