BTC: About to rally!The downtrend for BTC is officially over – it’s gonna keep surging next! Right now’s the absolute best buying opportunity in the market.
I’m calling 83000 as the bottom of this pullback. I’ll keep firing off accurate signals, so don’t miss out on cashing in!
Trade ideas

Bitcoin Mining vs. GPU Mining: What Powers AI and What Doesn’tIn crypto mining, Bitcoin mining power relies on specialized ASICs that can't be repurposed for AI tasks. However, GPU-based mining rigs used mostly for altcoins like Ravencoin, Ethereum Classic, Flux, Monero, and Vertcoin can be converted to AI compute power due to GPUs’ versatility in parallel processing.
This distinction is key: Bitcoin mining isn’t done with GPUs, so its computing power doesn’t transfer to AI workloads. Meanwhile, many GPU mining farms are pivoting to AI data centers, leveraging their hardware more flexibly for high-demand AI processing.
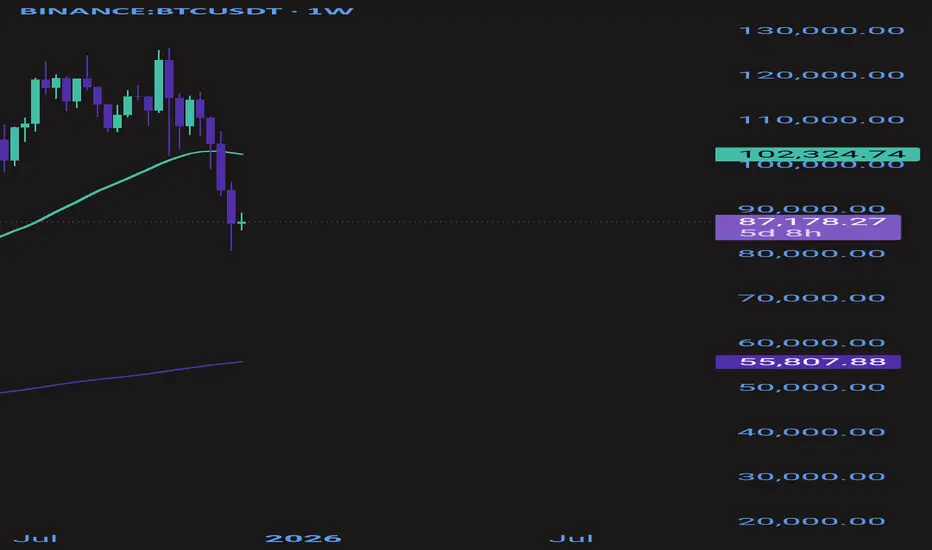
BTC 2025 Roadmap + BTC/Gold Ratio OutlookBTC Chart Idea (until end of 2025)
The setup shown with the blue arrow remains my base scenario through year-end.
I expect a move down to the 72k zone this year. Before that drop, price can either push first to ~99k (this year’s equilibrium) or head straight to 72k. Once we tag 72k – which is last year’s equilibrium level – I see that as the major low, from where the next impulsive leg toward 140k should begin.
BTCUSD/XAUUSD ratio
Current ratio is sitting around 21. I’m looking for a pullback toward 16. It can go 25 first and then 16, or drop directly to 16. I don’t expect 16 to hold as a long-term low; the reaction from there should target 25 again as the most probable level, with room for even higher readings beyond that.

My BTC BiasBitcoin is still in a heavy downtrend.
The small uptrend was just do it can reach premium of the created range.
Take profit is annotated in video and is likely to occur based on what I have observed.
Not financial advice. Just an opinion.

BTC/USDT Analysis. Moving Within the Expected Scenario
Hello everyone! CryptoRobotics trader-analyst here, and this is your daily market update.
Yesterday, Bitcoin continued its local uptrend. The movement remains mostly momentum-driven, but despite the lack of strong buying pressure, the price can still reach the first resistance zone we highlighted, as long as it consolidates above $88,000. During the last local pullback, we recorded a clear absorption of selling — this pattern is likely to play out if buyers become slightly more active.
From a mid-term perspective, the scenario remains the same: after testing the nearest resistance zones, we expect another wave of selling. A reaction from support would provide a more reliable setup for long positions with potential targets at $95,000–$100,000.
Buying Zones:
• $84,000–$82,000 (volume anomalies)
Selling Zones:
• $90,000–$92,300 (high-volume zone)
• $94,000–$97,500 (high-volume zone)
• $101,000–$104,000 (accumulated volume)
• $105,800–$106,600 (local resistance)
This publication is not financial advice.

BTC End of year fireworks ideaThe sentiment has been so negative. This is purely on speculation since we didn’t reach extreme greed on the bull cycle yet we just reached greed. Therefore, as long as 74k holds, the last major higher low this idea is still possible.
😄 make sure not to risk what you can’t lose. I’m usually wrong, but I got a feeling about this one.
2% on the line ✌🏼
I’ll place break even if we reach 108k
Good luck 👍🏼

BTC: Keep going long!As I clearly mentioned yesterday, BTC is now the perfect buying opportunity – and the market has started a solid rally right as I analyzed. Keep holding those long positions and wait for it to hit our first target of 100K!
BTC Trading Strategy for Today:
BTCUSDT Buy @ 85000 - 86000
TP: 90000 - 92000
With 15 years of focus on trading, I will provide accurate signals and strategies every day to help you achieve stable profits in the market. Don’t miss the daily analysis.

TradeCityPro | Bitcoin Daily Analysis #231👋 Welcome to TradeCity Pro!
Let’s dive into the Bitcoin analysis. The market is currently in an upward correction phase.
⏳ 1-Hour Timeframe
Yesterday, Bitcoin was supported at the 85,770 level and made another upward move.
✨ Currently, the price has reached the 89,000 level and has been rejected from there. This zone is a very strong PRZ (Potential Reversal Zone).
✔️ As long as the price doesn’t break below the 85,770 support, the possibility of breaking the 89,000 resistance still exists. Breaking this level, as mentioned in previous analyses, will be the first sign of a trend reversal for Bitcoin.
📊 The selling volume in the red candles has decreased a bit. Now, if the buying volume increases with the green candles, the likelihood of breaking the resistance increases.
⭐ However, if the price moves downward and breaks the 85,770 support, we can expect Bitcoin to move back toward the 82,214 level.
🧮 Therefore, we can use the break of 85,770 as a trigger for opening a short position.
🎲 For confirmation on higher cycles, the confirmation for a bullish reversal will come after stabilizing above 93,555, and the confirmation for a bearish trend will come after stabilizing below 82,214.
❌ Disclaimer ❌
Trading futures is highly risky and dangerous. If you're not an expert, these triggers may not be suitable for you. You should first learn risk and capital management. You can also use the educational content from this channel.
Finally, these triggers reflect my personal opinions on price action, and the market may move completely against this analysis. So, do your own research before opening any position.

INTERVIEW: Hope phase - EXCAVO’s View 25/11/25
1. Do you believe the bear market has already begun? If yes - from what moment?
Yes. The bear market started in November 2025.
My cyclicality chart shows it clearly: not a single scenario points to continued upside.
Every chart I posted on TradingView confirms the trend reversal.
2. What was the main signal confirming the reversal?
The 153rd week of Bitcoin’s growth — a historic exhaustion point that almost always marks the end of a cycle.
3. What BTC levels are critical for the downside scenario?
The key horizontal level is $74,000.
At minimum, I expect a clean wick below it.
4. What fundamental factors accelerated the bear market?
A massive overbought environment.
The 2-year AI bubble pushed valuations far above fair value.
The market became overheated — even though AI is here to stay.
5. Technical factors confirming the decline?
We’re dropping without any real reason.
Any small headline triggers selling.
October 11 wasn’t about Trump — it was a whale manipulation on big exchanges.
That’s how late-stage cycles behave.
6. Why did most traders fail to see this reversal?
— Short memory
— Conditioned for 3 years to “buy every dip”
— No exit plan
— No clear framework
— And of course: they weren’t following EXCAVO 😉
7. Where could BTC go in the coming weeks?
First: liquidation of short positions.
We may even spike up to $94,000.
But that would be a trap before continuation downward.
In December, I expect the formation of one of the cycle bottoms.
8. Which scenario seems more likely — panic drop or step-by-step bleed?
Most likely: a step-by-step bleed.
9. Is a fake bounce possible before further decline?
Yes. I already mentioned it: a short squeeze → then a big drop.
Practical Part
10. What are you personally doing in this market?
I’m waiting.
Observing.
Studying.
You don’t need to be in a trade every day.
Overtrading destroyed more traders than any correction.
11. What should beginners do now?
Exactly what professionals do: wait for their entry point.
We’re hunters in the bushes — we shoot only when the target is close.
12. What should traders revise in their strategy right now?
— Understand where we are in the macro cycle
— Identify what’s working
— Remove what’s not
— Accept that the bear market will be long and exhausting
Right now we’re in the hope phase.
Disappointment is ahead.
Best regards EXCAVO
If you have any questions, feel free to ask. In the next post, I can do another interview based on the questions you leave under this one.
Bitcoin: The ATH Was a Trap. Here's the Real Roadmap.Since mid-July, Bitcoin has been in a global range. The "breakout" to a new ATH on Oct 5-6, which the majority expected to continue, was actually a liquidity sweep . This has confirmed the global range and a high probability of a high-timeframe correction.
After the sharp drop on the Oct 10 news, a local range has formed. I expect a breakdown from this local range, with the minimum target being a sweep of the Previous Month's Low (PML) .
After that, the plan is to look for long-term long setups at three key global support levels.
SCENARIO 1: 50% Monthly Fib Level
The first major support is the 50% Monthly Fibonacci retracement level . If price reaches this level and also performs a liquidity sweep of the June 22 low , the probability of a long setup will be much higher.
Confirmation: Price must find acceptance above this level, confirmed by Daily or Weekly candle bodies .
Target: Mitigation of the global and local ranges.
SCENARIO 2: 78.6% Monthly Fib + Weekly OB
If the 50% level is broken, the next major support is the 78.6% Monthly Fib level in conjunction with a Weekly Order Block .
Confirmation: The interaction must be analyzed with D1/W1 candles. Acceptance above this level confirms the long setup.
SCENARIO 3: The "Make-or-Break" Level
A break of the 78.6% level opens the door to the April 7 low at $74,500 . The market's reaction to this final level will determine whether the bull cycle has a chance to continue, or if a new bear cycle will begin.
~~~~~~~~~~~~~~~~~~~~~~~~~~~~~~~~~~~~~~~~~~~~~~~~~~~~~~~~~~~~~~~~~
The principles and conditions for forming the manipulation zones I show in this trade idea are detailed in my educational publication, which was chosen by TradingView for the "Editor's Picks" category and received a huge amount of positive feedback from this insightful trading community. To better understand the logic I've used here and the general principles of price movement in most markets from the perspective of institutional capital, I highly recommend checking out this guide if you haven't already. 👇
P.S. This is not a prediction of the exact price direction. It is a description of high-probability setups that become valid only if specific conditions are met when the price reaches the marked POI. If the conditions are not met, the setups are invalid. No setup has a 100% success rate, so if you decide to use this trade idea, always apply a stop-loss and proper risk management. Trade smart.
~~~~~~~~~~~~~~~~~~~~~~~~~~~~~~~~~~~~~~~~~~~~~~~~~~~~~~~~~~~~~~~~~
If you found this analysis helpful, support it with a Boost! 🚀
Have a question or your own view on this idea? Share it in the comments. 💬
► Follow me on TradingView for timely updates on THIS idea (entry, targets & live trade management) and not to miss my next detailed breakdown.
~~~~~~~~~~~~~~~~~~~~~~~~~~~~~~~~~~~~~~~~~~~~~~~~~~~~~~~~~~~~~~~~~

Anticipate Movement Inside of a Range EnvironmentA large portion of crypto price action does not trend. It ranges. And for many traders, this is where the most capital is lost. A range environment feels simple on the surface price moves between two boundaries, but inside those boundaries, liquidity builds, traps form, and false signals appear constantly. Understanding how ranges behave is a core skill for developing consistency.
A range forms when the market fails to create meaningful higher highs or lower lows. Buyers and sellers balance out, and price oscillates between defined support and resistance. This compression is not random. It reflects indecision, accumulation, or distribution depending on the higher-time frame context. Traders who treat a range like a trend are the ones most often punished.
The first step is identifying the boundaries. Equal highs at the top of a range and equal lows at the bottom reveal where stops accumulate. These stops become liquidity pools. Price frequently sweeps one side of the range before moving to the other, trapping breakouts and fading momentum traders. A clean sweep is not the breakout; it is the intention-revealing event before direction is chosen.
Inside the range, structural signals lose reliability. Traditional trend tools cannot be applied. Instead, focus on behaviour at the edges: rejection wicks, failed breakouts, displacement after a sweep, and reclaim patterns. These reactions show whether a sweep is simply clearing liquidity or if a genuine expansion is developing.
Patience is critical. Entering in the middle of the range exposes you to noise, uncertainty, and poor reward-to-risk. The edge comes from waiting at the boundaries where liquidity sits and confirmation appears. A range can persist far longer than expected, so forcing trades inside it leads to frustration and unnecessary losses.
The real purpose of studying ranges is not just to trade them but to anticipate what follows. A compression phase often precedes expansion. When liquidity on one side is taken and price breaks structure with intent, the next directional leg becomes far easier to participate in. Ranges are where future trends prepare themselves.

How to build Discipline & Structured Trading HabitsDiscipline is not something you rely on in the moment; it is something you build through habits that remove emotional decision-making from your trading process.
1. Define Rules Before You Trade
Traders without predefined rules rely on emotion. Traders with rules rely on structure.
Clearly define your entry criteria, risk per trade, maximum daily loss, and exit strategy.
When these rules exist before the session starts, you eliminate most impulsive behaviors.
2. Limit Your Daily Decisions
Every decision drains mental energy. The more choices you make, the weaker your discipline becomes.
Reduce the number of markets you watch, the number of setups you take, and the amount of chart time you expose yourself to.
Fewer decisions lead to higher-quality decisions.
3. Use a Pre-Session Checklist
A checklist forces you into a disciplined routine. It can include:
• Reviewing your trading plan
• Checking upcoming news releases
• Confirming your bias or market conditions
• Ensuring your risk settings are correct
The act of going through the checklist prepares your mind to follow structure.
4. Implement a Hard Stop for the Day
One of the fastest ways to lose discipline is to trade while emotional.
Set a maximum daily drawdown. Once it is hit, the session ends. No exceptions.
This protects both your capital and your psychology.
5. Track Your Rule Breaks
Most traders only track wins and losses. Disciplined traders also track deviations.
Write down every time you break a rule, why it happened, and how you plan to prevent it next time.
Over time, this builds awareness and accountability.
6. Delay Impulsive Actions
If you feel the urge to jump into a trade that does not fit your plan, delay the action by 30 to 60 seconds.
Impulses lose power quickly. By introducing a pause, you give your rational mind time to regain control.
7. Keep Your Environment Clean
Distractions destroy discipline.
Silence notifications, close irrelevant tabs, and avoid multitasking.
A clean trading environment supports clean decisions.
8. End Each Session With a Routine
A consistent end-of-day routine reinforces discipline. Examples:
• Rating your discipline on a scale from 1 to 10
• Reviewing whether you followed your rules
• Logging emotional triggers
Ending the day with structure makes it easier to begin the next one with structure.
Conclusion
Discipline is not built through motivation but through habits that create consistent behavior. A structured trading routine removes uncertainty, minimizes emotional influence, and helps you operate like a professional rather than a reactive participant.
BTC long-term TAIt's been a while since the lasts posts, let's keep it up!
Bitcoin is entering an extreme bearish area on weekly time frame, the uptrend that lasted since March 2023 has been officially broken. The recovery may take anywhere between 6 to 12 months, no one can tell precisely but it's going to take some time.

Bitcoin (BTC): MSB Has Been Formed, Potential Push | BullishBTC formed the market structure break, which is the first step towards breaking the curse of the bearish trend that we have been having for quite some time now.
What we are looking for now is simply a confimational BOS at $89,150. There should be more movement to higher zones once we have that.
Swallow Academy

BTC/USDT Building an Early Base, High Chance to Retest 93K-108+BTC/USDT — Building an Early Base, High Chance to Retest 93K → 108K+
Bitcoin is forming a stabilization zone between 80K and 93K, which could mark the start of a deeper recovery phase. The recent bounce off the lower boundary suggests that buyers may be re-entering, setting up a potential long-term trend shift.
Key Technical Points:
📉 Support Zone: The lower range around 80.6K has held, showing strong demand at these levels.
🔁 Current Structuring: BTC’s price action shows a gradual range build — this isn’t just a short-term bounce, but a possible formation of a base.
🎯 First Upside Target: A clean breakout above 93K would signal renewed strength and is likely to trigger further buying.
🚀 Extended Target Potential: If momentum confirms and volume supports the move, BTC could aim for the 100K+ region. This would align with a multi-wave recovery to reestablish higher long-term structure.
Trade Outlook:
Holders: This could be a key accumulation setup — building on strength around the base may pay off if the breakout runs.
Short-term traders: Watch for a breakout above 93K with volume as your trigger for re-entry or scaling in.
Risk: If BTC fails to reclaim 93K decisively, a retest of the 80K base is still possible.
Summary:
There’s a realistic and structurally sound scenario where BTC could recover from this base and push toward 93K, with a strong shot at going 100K+ if the breakout materializes. Conditions are setting up for a potential multi-wave uptrend, but confirmation will be critical.

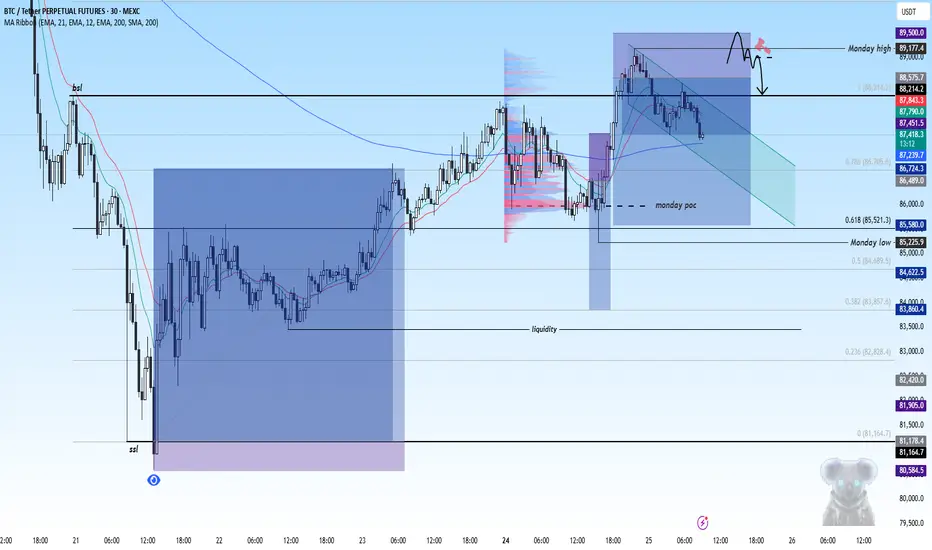
Bitcoin short scalpTaking partial profits here on $BTC...
Keep an eye on the monday range... Will add/re-enter if #Bitcoin sweeps monday high and get back in the range again...
#trading #CryptoMarket #BTC
BTC - NEW ATH in December or DROP?Hello BTC Watchers 📈
Bitcoin has, historically, been very bullish in Decembers. We see the most drastic increase in 2020, when BTC climbed over 140%.
During the times that BTC corrected over December, it's been 10% and 31%.
This makes it hard to predict seeing that it seems to be different every year with one year even trading in a tight range.
A few things we can do to clarify the possible direction of BTC This December:
1️⃣ Check the Macro
From a macro perspective, Bitcoin has increased and been increasing since April, with the hard drop only showing now in November.
This could mean two things - the correction before a final leg up or, the beginning of the bearish cycle.
2️⃣ Check Technical Indicators
a) The moving averages is pointing towards short-term BEARISH, since we are trading UNDER the 200d Moving averages(green line):
b) The Bollinger bands are showing an expansion (aka widening) but to the bottom, as the price is trading on the lower BBands, also indicating strong selling pressure for the short to near term:
3️⃣ Watch the News
Bitcoin has been coming up in many seemingly "bullish" articles. This is usually a bad sign before the liquidation - create hype, and then short the market.
Conclusion:
I'm leaning towards a soft pump in December to soften the blow of the current correction , but not a new ATH. The next increase will likely be a "fake-out" before the real bearish season starts in the new year.

Bitcoin’s 125k Dream or 80k Nightmare, Who Wins This GameAre you buying the top at 125k and panicking at 80k
Ever wondered why someone else always takes the profit
Let’s uncover who wins this long term Bitcoin survival match
Hello✌️
Spend 3 minutes ⏰ reading this educational material.
🎯 Analytical Insight on Bitcoin:
In my view, Bitcoin usually drops around the New Year and Christmas, and this has happened almost every year. This is normal because people are buying during this time. So we might see another small drop. But this time, unlike before, Bitcoin may not go into a long multi-year “winter.” It could bounce back to higher levels, or even new highs, much faster than in the past.
Now , let's dive into the educational section,
🌋 The Real Nature of Bitcoin
Bitcoin rewards those who understand the market’s true behavior
It acts like digital hard money with massive upside potential
Higher risk than gold yes but the payoff can be life changing
Without knowledge risk becomes panic and panic becomes loss
🏛 Hard Money vs Fiat Traps
Fiat money constantly loses value through inflation silently
People ignoring inflation stay trapped in financial decline
Bitcoin exists to protect wealth from this invisible theft
📈 Ten Years of Proof
Buying small every month would have changed your net worth
Hype buyers get wrecked but consistent buyers get rewarded
History shows deep crashes but even higher recoveries
Every major dip eventually turned into new all time highs
🏆 The Two Traits of Real Winners
First understand fiat is designed to inflate forever
Second stay consistent for years not weeks or months
Long term players always get the long term rewards
😰 Who Loses This Game
Those who see price only not the asset’s purpose
Those with hype not strategy fall at every dip
Oversized positions amplify fear and destroy accounts
🎭 Fear and Greed Control Weak Hands
Greed at the top creates bad entries no patience
Fear during crashes triggers the worst possible exits
Market simply transfers money from emotional to patient traders
🛠 Tools of TradingView for Smarter Bitcoin Plans
Set price alerts to avoid decisions made in panic
Volume Profile reveals where strong hands accumulated Bitcoin
Supply and demand zones highlight high probability reactions
Multiple timeframes prevent tunnel vision during volatility
Summary
Understand the game stay consistent and Bitcoin can serve you
Inflation won’t stop but your wealth doesn’t have to shrink
Three Key Recommendations
Think in decades not in daily candles to stay rational
Use DCA and never invest more than your true capacity
Protect emotions first because the market pays the calm ones
✨ Need a little love!
We pour love into every post your support keeps us inspired! 💛 Don’t be shy, we’d love to hear from you on comments. Big thank s, Mad Whale 🐋
📜Please make sure to do your own research before investing, and review the disclaimer provided at the end of each post.

Bitcoin Analysis – November 25 | Key Levels & Clean Scenarios
Good morning traders!
Hope you’re having an amazing day so far.
The Fear & Greed Index is sitting at 15, which still places the market deep in Extreme Fear territory.
Let’s jump straight into today’s analysis—no extra fluff.
Quick Recap
Yesterday I mentioned that Bitcoin might reject and push upward, and that altcoins could offer better setups if BTC.D wasn’t aligned with Bitcoin’s move.
That’s exactly what happened — and I also took my entries on altcoins, not BTC.
If you’re currently in profits, I highly recommend taking partials or securing gains.
When the market has no clear higher-timeframe trend, holding positions for too long generally isn’t a great idea.
Today’s Plan
⚠️ First reminder:
The daily trend is still bearish.
Don’t forget where the bigger momentum is.
Scenario A – Bullish Reaction
If the market wants to push upward again,
$88,338 is a clean level to look for a risky long entry after a 15-minute candle close above it.
Volume is supporting this short-term move,
but candles are not confirming strongly — and that’s exactly why altcoins currently look stronger than BTC.
So:
If BTC breaks $88,338 + BTC.D shows strength,
→ Bitcoin becomes a solid long option.
If dominance disagrees,
→ I’ll personally stick with altcoins for longs.
Scenario B – Bearish Rejection
If BTC rejects and forms a failed breakout,
any valid short trigger within your strategy becomes playable.
My personal level for shorts:
$86,000
If both BTC price + BTC dominance drop together,
this becomes an excellent short setup.
If not?
Again… I’ll move to altcoins.
-->Important Note – Possible Range Week
There’s a high chance this entire week turns into a range.
If that happens:
Take profits quickly
After reaching 2R, full close or close partials
Momentum-based systems might take more stop-losses this week
→ so risk management becomes even more important.
Final Words
Thanks for reading today’s analysis!
Remember:
🚫 Don’t FOMO
🎯 Stick to your strategy
💰 The goal is consistent profitability, not one lucky trade
Have a profitable day ahead!
Stay safe, stay disciplined. 💙📈

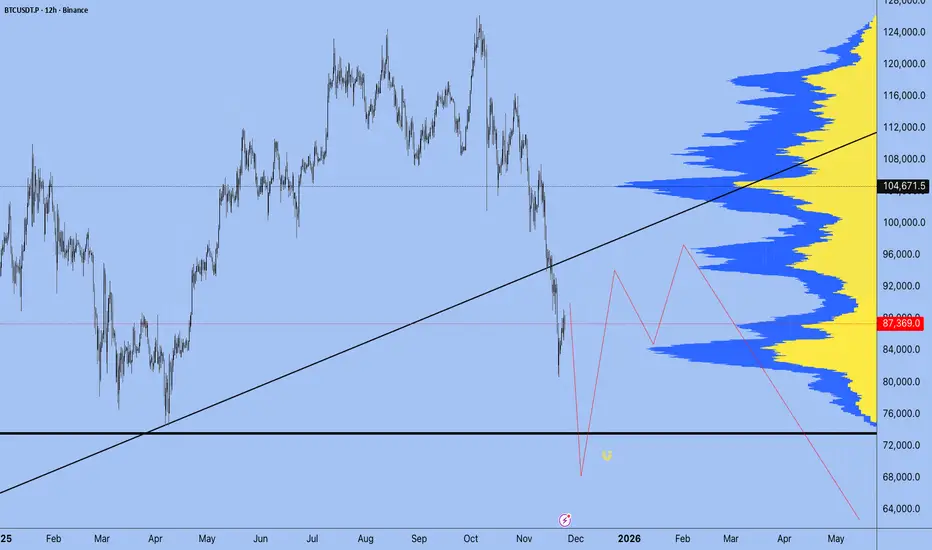
BTC Weekly – Potential Buy Zones
**BTC Weekly – Potential Buy Zones**
Based on the BTC.w chart, the yellow zones appear to be suitable areas for those planning long-term investment and considering the possibility of a deep correction.
With this approach, you can place laddered buy orders around:
$75K – $65K – $50K
and even $28K
If Bitcoin behaves similarly to previous cycles and corrects around 77%, reaching the $28K range is not unrealistic.
This scenario is fortunate for those holding cash, but unfortunately difficult for those who bought Bitcoin or altcoins at higher prices—although smart dollar-cost averaging** can help reduce losses.
In the most pessimistic scenario, we must also consider one point:
There is a gap in the $12.5K–$15K range. Major global events—such as **wars, geopolitical crises, or internet disruptions**—could easily push the market toward that zone.
Everything ultimately comes down to three key actions:
Patience… Selling… Buying…
and knowing *what you will do, and where.
What’s your opinion?

BTC Buy?
Trend has been down, now a bounce is trying to form a higher low.
Price is sitting at the POC/HVN ~87.6–87.8k (heavy traded area). This is the decision point.
First supply is 88.0–88.7k. Acceptance above it = cleaner path up. Rejection = likely rotation lower.
Structure
Support: 87.1k (thin shelf), 86.3–86.4k (last clear higher‑low / invalidation), 84.2k.
Resistance: 88.0–88.7k, 90.8–91.2k (prior shelf), 96.6k (0.382 retrace).
The dashed downtrend line has been tested; bulls need hold above POC to show control.
Indicators (4H unless noted)
RSI: around 50–55 → neutral to slightly bullish.
EMAs (20/50/200): still bearish stacked; 20 EMA is trying to curl up. A reclaim of 50 EMA would help the bounce.
Volume: breakout needs rising buy volume; a weak poke above 88k without volume often fails.
ATR(1D): ~1.7k → room for 2–3% swings.
Scenarios
Bullish: 4H close > 88.1k, then hold above ~87.95k on retest. Targets: 90.8k → 94.9k → 96.6k.
Bearish: Clear rejection at 88k with growing sell volume, or 4H close back < 87.3k. Downside magnets: 86.3k, then 84.2k.
My Take
I do not buy directly into the POC. I want either acceptance above 88.1k or a clean reaction at 86.9–87.1k. Simple plan, simple invalidation.
Not financial advice. Manage risk.
btcusdt**Technical Analysis of Bitcoin - Weekly Timeframe**
**Analysis Framework: Multi-Scenario System with Advanced Risk Management**
---
### **Scenario 1: Bullish Trend Recovery (Bullish Revival)**
- **Mechanism:** Price retracement to the bottom of the primary bullish trend and formation of a support base
- **Entry Point:** $83,040 (Key support and demand zone)
- **Stop Loss:** $79,518 (Below recent low to avoid false breakout)
- **Profit Targets:**
- First Target: $89,000
- Main Target: $93,158 (Dynamic resistance)
- **R/R Ratio:** 1:3.2
---
### **Scenario 2: Support Breakdown and Bearish Dominance (Bearish Breakdown)**
- **Mechanism:** Decisive breakdown of the $79,500 support level and activation of structural selling pressure
- **Entry Point:** $77,511 (Support breakdown and pullback confirmation)
- **Stop Loss:** $79,520 (Above breakdown level to guard against bear traps)
- **Profit Targets:**
- First Target: $74,000
- Main Target: $71,334 (Major support and new range low)
- **R/R Ratio:** 1:2.8
---
### **Scenario 3: Rejection from Resistance (Rejection)**
- **Mechanism:** Price reaction to resistance zone and formation of reversal patterns
- **Entry Point:** $93,604 (Strong selling zone and static resistance)
- **Stop Loss:** $94,170 (Above resistance high to account for volatility)
- **Profit Targets:**
- First Target: $87,000
- Main Target: $83,950 (First support in downtrend)
- **R/R Ratio:** 1:4.1
---
### **Scenario 4: Breakout Continuation (Breakout Continuation)**
- **Mechanism:** Decisive breakout above resistance and consolidation in new price territories
- **Entry Point:** $99,154 (Resistance breakout with pullback confirmation)
- **Stop Loss:** $97,124
- **Profit Targets:**
- First Target: $100,000 (Psychological level)
- Main Target: $103,340 (Fibonacci extension projection)
- **R/R Ratio:** 1:3
---
### **Key Observations:**
1. Scenarios 1 and 4 align with the primary bullish trend.
2. Scenarios 2 and 3 are counter-trend and require stronger confirmations.
### **Execution Recommendations:**
- Use Limit orders for entry at specified levels
### **Critical Warnings:**
- Scenario 4 carries elevated risk due to extremely tight stop loss
- Overlapping levels between Scenarios 1 and 2 require precise position management
**Final Note:** This analysis is based on key technical levels and requires continuous monitoring of market developments and news.

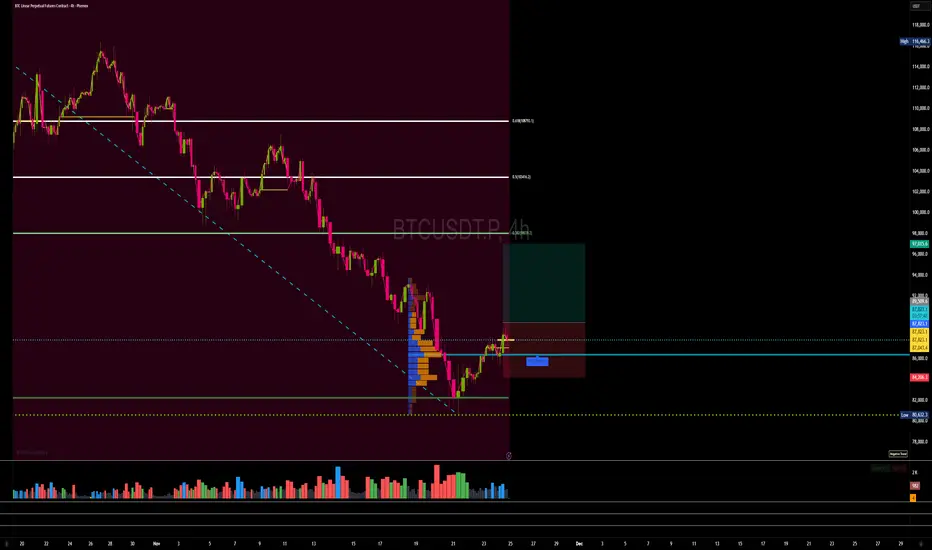
BTCUSDT.P - November 25, 2025Bitcoin is in a corrective phase within a longer-term downtrend, with price recently rejected from the 89,500 resistance area and now trending lower. The chart highlights a short trading range between a defined stop level near 89,500 and a profit level at 85,721, aligning closely to horizontal support and resistance. Current price action and momentum favor sellers, as the market presses toward lower support with weak upward retracement. A break below support could accelerate selling toward the next downside target, while reclaiming resistance might shift bias to a short-term reversal.
