BITCOIN BTCUSD WEEKLY CLOSE OF CANDLE WILL SET A FORWARD GUIDANCE TO SELL OFF.
I have shared a weekly and daily perspective on this before and we hope that the rest could touch 74-73$ demand .
demand flkoor 94-96k zone
demand floor 54k-55k zone
#bitcoin #btcusdt
Trade ideas

CPI, BITCOIN, CRYPTO AND RISK ASSETSI do believe we will recover in Q4, but a
hotter-than-expected #CPI means a bloodbath for #crypto especially #BTC showing this kind of price action. #ETH #SOL #ADA #BNB #XRP

BTC retracement by Wyckoff Replicated the model of Wyckoff distribution. The only thing is that he never used Fibbonacci in hes practice. While applying Fibbs will give us Swing entry at two resistance levels $98-100K and deeper at $92-94K, and the total 0.786 retrace would erase whole pump since April, that would be $84K. COnsidering that 2/3 of the trading volume is the US markets and US is currently in a bad shape, considering political situation, gov close and raw metals pump, BTC as a risk asset is still not a favorable investment. loosing 24K in short period of time or 20% value is showing that it can easy lose such value.

I called this downtrend for 2 weeks now, and its not over.Whilst most of X (twitter) has been ranting about 'buying the dip' and telling followers to expect parabolic price action, I have continued to say Bitcoin is still in a downtrend.
and it will keep going down until this transition is over

market didn't have the strength herethe shape went up correctly, but the market didn't have the strength to fulfill it.
on the HFT there's still a downtrend happening, so I've closed my long here

BTC/USDT Short-Term 4H Review Chart🧩 Market Structure
After a strong decline, the price has rebounded, creating a local uptrend (marked with the orange trend line).
The price has currently broken through the uptrend from below, which is the first sign of bullish weakening.
The current candle is testing this line from below—a classic trendline retracement (potential pullback).
📉 Support and Resistance Levels
From the chart:
Resistance (green lines):
113.868 USDT — key high.
111.240 USDT — strong resistance (previous local high).
109.133 USDT — currently being tested from below (confluence with the trendline).
Support (red lines):
107.524 USDT — first support.
105.253 USDT — lower support, a boundary for maintaining the higher low structure.
103,582 USDT — key support, below which the upward structure will be negated.
🔍 Volume
Increasing volume is visible on the red candles — selling dominated the trend breakout.
The last green candle has a large lower wick and slightly higher volume — a signal of a possible defensive reaction from the bulls, but without confirmation of continuation.
📊 Stochastic RSI (oscillator)
Located in the oversold zone (around 20).
The %K line is starting to curve slightly upward — it could signal a short-term rebound, but until there's a crossover and confirmation, this is only an early signal.
📈 Scenarios
✅ Bullish:
If BTC rebounds and closes the candle above 109,100 USDT, it will be a false breakout of the trend and a possible upward move towards 111,200–113,800 USDT.
Support to be maintained: 107,500 USDT.
❌ Bearish:
If the price remains below the trendline and 109,000 USDT, and then breaks above 107,500 USDT, the path opens to:
105,200 USDT, and then
103,500 USDT (strong support and potential buy zone).
⚙️ Summary
Short-term trend: neutral → slightly downward (after the trendline breakout).
Key level to watch: 109,100 USDT (retest trendline).
Potential support: 107,500 → 105,200 → 103,500.
Momentum (Stoch RSI): A bullish rebound is possible, but confirmation is lacking.

TradeCityPro Academy | Support & Resistance Part 2👋 Welcome to TradeCityPro Channel
🎓 Educational Section Technical Analysis Training Series
Welcome to the Educational Content Section of our channel!
Here, we aim to teach you technical analysis from A to Z through structured playlists.
We’ll cover everything from risk and capital management, Dow Theory, support and resistance, trends, and market cycles, to more advanced concepts.
Our lessons are based on both real market experience and The Handbook of Technical Analysis.
🎨 What is Technical Analysis?
Technical Analysis (TA) is a method used to forecast price movements in financial markets by analyzing historical data, especially price and volume.
It’s based on the idea that history tends to repeat itself, and that recurring patterns can reveal profitable trading opportunities.
📚 Complete Guide to Support and Resistance in Technical Analysis
🧩 Introduction
In technical analysis, two key concepts form the foundation of nearly every trading strategy: Support and Resistance.
These levels represent areas on the chart where the price is likely to change direction, as buyers or sellers regain control.
But to truly understand them, you must go beyond the chart — because their origin lies in human psychology and collective behavior.
🟢 What Is Support?
A support level is an area where buying pressure increases and prevents the price from falling further.
It acts like a floor where buyers believe the asset has become cheap enough to buy.
As a result, the market tends to bounce upward from that area.
For example, if Bitcoin has repeatedly reversed near $55,000, that zone is considered a support level.
🔴 What Is Resistance?
A resistance level is an area where selling pressure increases and stops the price from rising higher.
When the price approaches this level, traders often feel the asset is “too expensive” and start selling.
For example, if Ethereum has failed multiple times to break above $3,800, that area is considered resistance.
💭 Why Do Support and Resistance Form?
Markets are not just numbers — they’re the reflection of human emotion and crowd behavior.
When large groups of traders make similar decisions (to buy or sell) around the same price zone, it creates a psychological memory in the market.
If price has reacted there before, traders remember it — and react the same way next time.
This repetition forms the backbone of how support and resistance levels develop and strengthen over time.
🧠 The Role of Emotion and Crowd Psychology
Emotions drive markets.
When prices rise quickly, people experience FOMO (Fear of Missing Out) and rush to buy — until demand runs out and price reverses (resistance).
When prices fall, fear of losing money triggers panic selling — until sellers dry up and price rebounds (support).
This constant emotional cycle repeats endlessly, creating recurring support and resistance zones on every chart.
⚙️ The Structure Behind the Levels
From a technical perspective, these levels form because large clusters of orders are placed around them.
Traders typically set buy orders below the current price (near support) and sell orders above it (near resistance).
So when the market reaches those areas, there’s a strong battle between buyers and sellers.
That’s why these zones are not just psychological — they’re also built into the order flow and liquidity structure of the market.
📈 Reactions and Breakouts
When price approaches a key level, two outcomes are possible: Reaction or Breakout.
In a reaction, price touches the level and reverses — meaning buyers or sellers defend it successfully.
In a breakout, price pushes through with strong momentum and high volume, breaking the market’s previous belief.
After a breakout, the level often changes its role:
A broken resistance becomes new support.
A broken support becomes new resistance.
This behavior is known as Role Reversal, one of the most powerful principles in chart analysis.
⚖️ The Professional Mindset
Support and resistance are zones, not exact numbers.
The market may slightly move above or below them before reacting — this is known as a fake breakout.
Professional traders look for confirmation such as reversal candles, volume spikes, or RSI divergences before acting.
The key is not to memorize lines but to read crowd behavior.
Once you understand why people buy or sell at certain points, you gain a true edge over the average trader.
🧩 Conclusion
Support and resistance are not just lines on a chart; they are the visible footprints of fear, greed, and collective memory in the market.
By understanding their psychological and structural roots, you can identify better entry and exit zones,
predict reactions more accurately, and avoid emotional mistakes.
Learn to read the emotions behind the candles — because at its core, the market is simply a crowd of human minds trying to win.

BTC next movesI've always been blessed to predict major price movement, I think I need a job as an analyst. I'm open to any.
Anyways BTC blueprint for the next couple of weeks

$BTC (DAILY): DEAD CAT bounce, weak so far. $100k or $117k next?My WEEKLY CRYPTOCAP:BTC outlook remains rather bearish, and as far as the DAILY chart, pretty much the same, except in this case, we still haven't seen a candle close below the 200 MA.
Lower HIGH, yes, the structure has shifted bearishly, but as long as above the green average ($108120 atm), I would still not exlude a higher DEAD CAT as we only had a bounce up to fib 0.5 ($114100) yesterday.
So, it's either one, the classic crypto situation, close below $107-108k and I'm ready for a dip down to $99-101k.
Show strenght above $109k and a stronger bounce to $117k could be next, that's exactly where the most of LIQUIDATIONS are sitting. See attached HEATMAP.
So, essentially waiting to see the direction after the next daily CANDLE closes, anything can happen this week while the bigger picture is neutral-bearish based in the WEEKLY (see previous posts today).
👽💙

Bitcoin at the Top of Wedge – Bearish Reversal Coming Again?As I expected in yesterday’s idea , Bitcoin dropped to the $107,800 level, hitting its target .
In the last few hours, BTC started to pump again and is now trading near a cluster of resistances : the 100_SMA(Daily) , the 50_SMA(Daily) , and Cumulative Short Liquidation($117,517-$116,020) . This creates a strong resistance , and I don’t think Bitcoin will easily break through it. ( As of the time of writing, there’s no fresh news influencing the market .)
From an Elliott Wave perspective, it looks like Bitcoin is forming a Triple Three Correction(WXYXZ ).
On the Classical Technical side, Bitcoin is at the top of an ascending broadening wedge pattern , which is a reversal pattern . There’s also a Regular Bearish Divergence (RD-) between the two peaks in this pattern.
I expect that in the coming hours, Bitcoin will start to drop again. After breaking the important $111,000 level , it could fall at least to the lower line of the ascending broadening wedge .
Note: In these past few days, the Bitcoin and crypto market have been quite volatile and driven by news, especially related to US-China tensions. So always manage your risk carefully and avoid impulsive decisions based on sudden headlines.
New CME Gap: $107,690-$107,220
Cumulative Long Liquidation: $107,105-$104,297
Cumulative Short Liquidation: $115,241-$113,454
Stop Loss(SL): $116,200
Please respect each other's ideas and express them politely if you agree or disagree.
Bitcoin Analysis (BTCUSDT), 1-hour time frame.
Be sure to follow the updated ideas.
Do not forget to put a Stop loss for your positions (For every position you want to open).
Please follow your strategy and updates; this is just my Idea, and I will gladly see your ideas in this post.
Please do not forget the ✅' like '✅ button 🙏😊 & Share it with your friends; thanks, and Trade safe.

BITCOIN SIGNAL: NEXT MASSIVE MOVE IN THIS DIRECTION IS FORMING!!Yello Paradisers, I hope you are doing fine. This is a video for you. Enjoy. I hope you are enjoying it. Smash the rocket button if you want. I will see you again next time. You can also share this video. I will be retweeting everybody who gonna mention me and TradingView.
And Paradisers! Keep in mind to trade only with a proper professional trading strategy. Wait for confirmations. Play with tactics. This is the only way you can be long-term profitable.
Remember, don’t trade without confirmations. Wait for them before creating a trade. Be disciplined, patient, and emotionally controlled. Only trade the highest probability setups with the greatest risk to reward ratio. This will ensure that you become a long-term profitable professional trader.
Don't be a gambler. Don't try to get rich quick. Make sure that your trading is professionally based on proper strategies and trade tactics.

TradeCityPro | Bitcoin Daily Analysis #203👋 Welcome to TradeCity Pro!
Let’s get into today’s Bitcoin analysis. The market is really uncertain right now and is showing a lot of random, irrational volatility. It’s very important to stay closely updated in these kinds of situations — so let’s dive into the chart.
⏳ 1-Hour Timeframe
Yesterday, Bitcoin made an upward move and managed to reach the 113,429 zone.
⭐ However, after this move, the price faced a strong rejection from that level, completely retraced the entire upward move, and is now back around the 107,486 support zone.
✔️ We can say that this move was a Dead Cat Bounce (DCB) because heavy bearish momentum has now entered the market, and Bitcoin is currently fluctuating around 107,486.
✨ A break of this level will give us the main confirmation of a bearish continuation, and the next bearish leg of Bitcoin could begin.
🧩 For now, it’s better not to rely on momentum oscillators like RSI, since the market lacks clear momentum. However, the volume shows that buyers have been trying to defend the 107,486 support — but as long as the price stays below 113,429, those efforts won’t have much impact.
💥 I’ll open a short position if 107,486 breaks. The next zones that the price might react to are 106,319 and 104,488.
🔔 For long positions, there’s currently no valid trigger — we’ll need to wait until a proper structure forms.
❌ Disclaimer ❌
Trading futures is highly risky and dangerous. If you're not an expert, these triggers may not be suitable for you. You should first learn risk and capital management. You can also use the educational content from this channel.
Finally, these triggers reflect my personal opinions on price action, and the market may move completely against this analysis. So, do your own research before opening any position.

BITCOIN - Clear bearish sign!Bitcoin is currently forming a clear corrective pattern — a rising wedge that has broken downward, retested the breakdown, and is now continuing a gradual decline.
This correction is expected to bottom around the $85K level, after which Bitcoin will likely enter a consolidation phase, form new structures, and we’ll keep updating the outlook as new developments occur.
Also, note that the EMA 25 just crossed below the EMA 50, forming a death cross — a bearish signal.
You can consider entering a short position from here, but keep your leverage low and wait for a slight pullback before entering the trade.
Many people won’t like what I’m saying — they’ll tell you “Bitcoin is heading to $200K!” — but that’s just the nature of the market. Everyone sees what they want to see.
Corrections, retracements, and emotional reactions are all part of the cycle. The smart ones are those who read the structure, not the hype.
Best Regards:
Ceciliones🎯

BITCOIN MAJOR WEEKLY UPDATEBitcoin’s 2020 bottom at $3,621 and a projected 2025 top around $126,208 form the Fibonacci range.
The 0.236 Fibonacci level sits near $97,300, which aligns perfectly with a major long-term trendline support drawn from the 2021 highs.
This zone around $97K–$98K is key — it’s where price could retest before resuming the next leg up.
The RSI shows a similar pattern to early 2025, where it broke below the trendline briefly and then bounced strongly — a sign of momentum resetting rather than full reversal.
Conclusion
If Bitcoin pulls back to $97,000, it could be one of the best buy opportunities of this cycle — combining Fibonacci confluence, historical trendline support, and RSI structure.
Unless Bitcoin closes below $95K weekly, the macro bullish trend remains intact, with upside targets between $120K–$126K in 2025.

BTC/USDT Analysis. Pump and Dump Amid Gold Selloff
Hello everyone! This is CryptoRobotics trader-analyst with the daily market overview.
Yesterday, following a massive gold selloff, volatility on Bitcoin spiked sharply. The price made an explosive move upward with no resistance in the $110,700–$111,500 zone.
However, once above that range, a strong selling anomaly appeared between $111,800–$113,000, triggering a retracement back to initial levels.
At the moment, support at $107,300–$106,300 (accumulated volumes) has been tested, while local volume anomalies appeared slightly higher.
Currently, Bitcoin is attempting to consolidate above $108,000 — holding this level may lead to a short-term bounce, but upon reaching $111,800–$113,000, there is roughly a 90% chance of renewed selling pressure.
Overall, the market structure remains weak for buyers, and within the next week, a test of the stronger support area near $105,600–$104,500 (volume anomalies) looks likely.
Buy Zones:
~$108,000 (local volume anomalies, potential support)
$105,600–$104,500 (volume anomalies)
$97,000–$93,000 (volume zone)
Sell Zones:
$111,800–$113,000 (strong volume anomalies)
$114,400–$115,600 (local volume zone)
$120,900–$124,000 (volume zone)
This publication is for analytical purposes only and does not constitute financial advice.

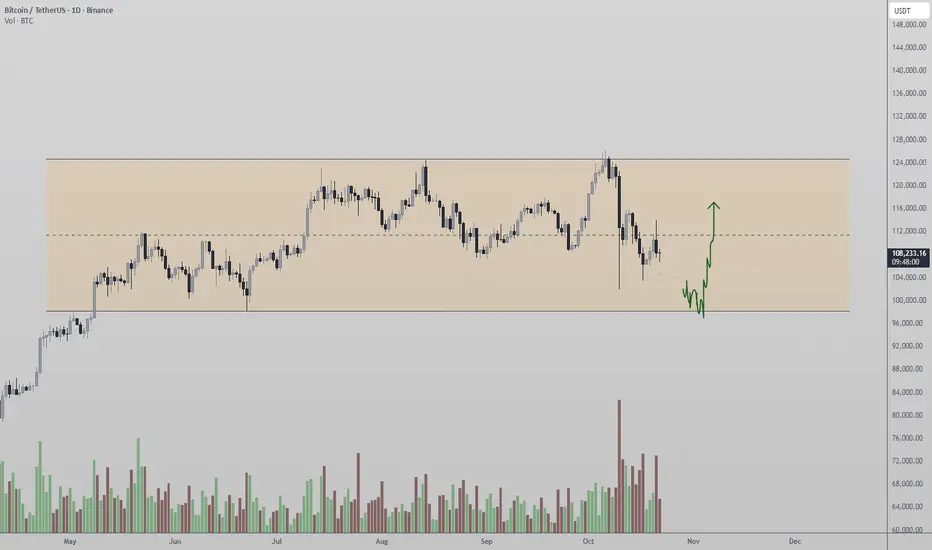
Bitcoin Consolidates Between $98K and $124K — Range-Bound Bitcoin price action continues to display signs of prolonged consolidation, with a well-defined trading range now forming between $98,000 support and $124,000 resistance. This structure highlights a period of equilibrium in the market as participants await a decisive breakout.
The lower boundary of this range, near $98,000, has not been tested since June 2022, making it a critical support region to monitor. A successful retest and hold of this level would confirm continued stability within the current consolidation pattern, suggesting that Bitcoin remains in a rotational cycle between these established boundaries.
Key Points:
- Range Support: Established at $98,000, last tested in June 2022.
- Range Resistance: Defined at $124,000, capping upside momentum.
- Market Structure: Price remains range-bound, indicating continued accumulation or distribution.
From a technical standpoint, this extended sideways movement represents the market’s process of absorbing liquidity before its next major expansion phase. Until a breakout occurs, traders can expect repetitive oscillations within this broad channel.
What to Expect:
As long as $98,000 holds as support, Bitcoin may continue to rotate higher toward $124,000. A breakdown below this level, however, could invalidate the range and trigger deeper corrective movement.
BTC 1H Analysis | Day 7🥳 Hey everyone! Hope you’re doing great! Welcome to SatoshiFrame channel.
✨ Today we’re diving into the 1-Hour Bitcoin analysis. Stay tuned and follow along!
👀 On the one-hour timeframe of Bitcoin, we can see that after last night’s pump, Bitcoin failed to break through the resistance zone at $113,400 and was rejected downward from this area. It’s currently sitting at its support floor around $107,537, and losing this level could lead to a further decline.
🧮 The RSI oscillator has now formed two important zones — 50 and 38 — and when the fluctuation limit crosses these zones, Bitcoin may start its next move with increased volatility.
🕯 Last night, Bitcoin had good buying volume while approaching its resistance, but the key point was that it was then pushed down sharply by heavy selling pressure, losing even its multi–timeframe support floors. Keep in mind that Bitcoin needs an increase in buying or selling volume to break through these identified levels.
🧠 I’ve explained the upcoming Bitcoin scenarios in the following paragraph.
🟢 Long Position Scenario: A breakout of the nearest resistance zone at $109,383, along with the RSI crossing above the 50 level and buying pressure strong enough to absorb all the sell orders in this area.
🔴 Short Position Scenario: The current level Bitcoin is sitting at is a very critical support. Losing this support at $107,537, combined with the RSI dropping below 38 and increased selling pressure, could trigger a continued downward move, pushing Bitcoin toward its lower support zones.
❤️ Disclaimer : This analysis is purely based on my personal opinion and I only trade if the stated triggers are activated .

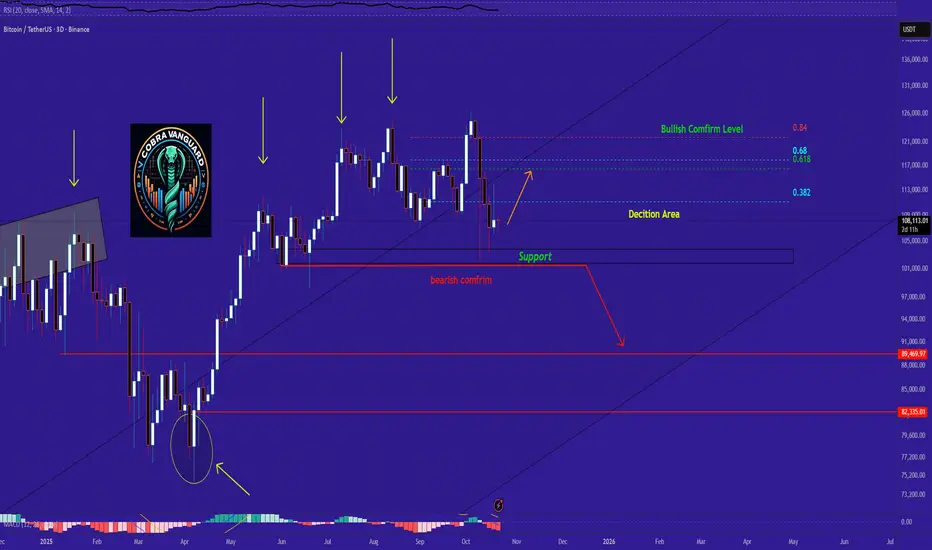
Bitcoin Technical Outlook (Based on Recent Observations)So far, Bitcoin has not yet completed the 3-day red candle close we've been watching. The key decision zones I previously marked—especially the 0.382 Fibonacci level at $112,890—remain unbroken. This level is critical for confirming bullish continuation.
For Bitcoin to maintain its upward momentum, we need a candle close above both the decision zone and the channel's midline, as illustrated by the orange arrow I previously shared.
In my view, if the $103K–$100K support zone breaks downward, we could shift into a bearish stance. This type of behavior from Bitcoin has been typical over the past 640 days.
C'mon Do something! -BTCC’mon… do something! 😤
This sideways phase = pure laziness.
So, 100k test incoming or not? 🧐
#Bitcoin

$BTC (WEEKLY): DARK CLOUD COVER bearish candlestick patternCRYPTOCAP:BTC has got a text-book DARK CLOUD COVER candlestick pattern nearly completely formed on the WEEKLY.
It's a form of a bearish engulfing pattern, just without one single red candle but rather a series of a few. This way, we get to see a few red volume candles in order to assess the validity of a pattern.
In addition to the CLOUD COVER pattern, it occurred precisely at the double top and at the CUP & HANDLE long-term target ($125k). All this adds to a bearish bias, and again, closing above $109k is a MUST this week, once again, for a bullish narratives to make any sense.
Some ETF inflows into both #btc and CRYPTOCAP:ETH yesterday, so that's a bit of hopium, right there.
For now, my targets based on the ELLIOT'S WAVE count: $100.3k or 94.3k. BITCOIN must not lose the $94k or it's #cryptowinter time.
💙👽

$btc long setup 15MIN London session swept the Asia low — classic liquidity grab before reversing.
That’s your manipulation candle — a clear sign institutions are hunting stops below key Asian levels.
📉 Market Structure & Alligator Signal
Alligator lines are beginning to curl up — jaws, teeth, and lips are turning.
Price is currently forming support above the Alligator, signaling a possible awakening after consolidation.
We’re trading above the Alligator — that’s your cue for potential long momentum.
🎯 Entry Setup – Long Scenario
Entry Zone: Around 108,000 – 107,950 (just above Alligator & recent support)
Stop Loss: Below today’s low / Alligator lips — roughly 107,750-107,800
Take Profit 1: 108,500 (liquidity above London high)
Take Profit 2: 108,800–109,000 (previous resistance & HTF level)
✅ Confirmation Needed:
Wait for a bullish candle close above Alligator with volume.
No new low below 107,785 — that’s your invalidation.
Final Thought:
London took the Asia low — now we ride the reversal if support holds. Alligator turning = trend awakening. Don’t chase — wait for the pullback into support.
Let’s see if the bulls wake up 🚀
— original_capital33 | TradingView
👉 Like & Follow if this adds value. Not financial advice.

#BTCUSDT — Potential Move to 120K Before Major Correction#BTCUSDT could move up toward 115K–120K before correcting to 100K and possibly reaching 90K. Still, there’s a chance it may start the drop from here (Plan A), but structure-wise, Plan B looks more likely to unfold.

3 Cognitive Traps That Prevent You from Closing Losses!Hello, friends 😊
Today I want to talk not about indicators or patterns, but about why, even if we know everything "correctly", we still hold unprofitable positions longer than we should. Even when the price doesn't go according to plan and the situation becomes more obvious, we still convince ourselves that " is about to turn around "
Honestly? I sometimes struggle with it myself , but now it's not as panicky as it used to be.
🤔 And yes, I also had moments when I looked at the graph and realized that "that's it, the hypothesis didn't work," but I still thought, "Well, I'll wait a little longer... what if?"
It's not a matter of weak will. The fact is that our brain is designed in such a way that it literally prevents us from making rational decisions at a loss . And today we will analyze 3 such cognitive traps , and see how to work with them.
Let's start, 🚩 Trap #1: The Concorde effect or the error of non-refundable costs (literally "sunk costs") - Costs that have no alternative use: costs incurred as a result of decisions made in the past and which cannot be changed by a subsequent decision in the future. When so much effort and resources have been invested in something that you don't want to stop. But it should be.
For example: "I've already invested so much time/money/nerves - now I have to wait for everything to come back!"
Does it sound logical in principle? But in reality, is an illusion . Because the market absolutely doesn't care how much you have invested. He doesn't have to return anything to you.
🔎 There was a moment when I just joined the market, I held a losing position on ETH for almost a week, because "I've been waiting so long, I'll wait some more." As a result, the loss tripled, and then, when I finally closed, the price went in my direction (classic) 😁
The most annoying thing was not the loss, but the fact that I violated my own rule (ignored the stop)
🔋 How to live with it?
A simple trick: before each trade (or even at the moment of loss) ask yourself : "If I wasn't in a position right now, would I open it under these conditions?"
If the answer is "no", exit. All. Point. Past losses cannot be returned . But you can stop the future ones and return to the market (albeit with a smaller amount)
🚩 Trap #2: The illusion of control is a cognitive distortion in which a person overestimates their ability to influence events that actually depend on chance or external circumstances
For example: "I feel like it's about to unfold. I know this pattern. I have the situation under control."
I feel ... we all use this phrase in our thoughts as a basis, especially when the market is going against us and we cling to hope.
But the truth is that the market is not controlled by anyone . Neither you, nor smart money, nor even those who trade billions. We are all participants in the same probability game .
And when you say, "I feel," what you're really saying is, "I really don't want to admit that I was wrong."
🔋 What can be done about it?
Remind yourself more often: we are not predicting the market - we are betting on probability.
If the price violates your risk level, it is not a "temporary drawdown." This is a refutation of your idea . And respect for the market begins with respect for your plan.
🚩 Trap #3: The Confirmation effect is a cognitive error that manifests itself in a person's tendency to seek, interpret, and remember information that confirms their pre-existing beliefs, and ignore data that contradicts these beliefs
For example: "Look, here's a bullish pattern! The volume is growing! The RSI has bounced back!"*
(and the divergence on the day, the fundamental news and the structure are negative ... but this is "not important", etc.)
Our brain is a master at filtering reality . He automatically searches for everything that confirms our point of view, and ignores everything that contradicts it. This is not stupidity, it is an evolutionary mechanism. But in trading, he's working against us.
🔋What should I do?
Before entering into a transaction, write it down in your diary:
- under what conditions will you leave?
- what signals will mean that you made a mistake?
And when there is already a loss, ask yourself: "What data am I not seeing right now because I don't like it?"
This question is like a cold shower for the ego, but it brings you back to reality .
We're not perfect 🔆 I also have days when emotions take over.
But over time, I realized that stability in trading is not about "never making mistakes." It's about making mistakes with respect for yourself and the market and drawing conclusions based on your mistakes.
💡 A loss is not a failure . This is part of the process .
But the inability to control it is what really slows down growth .
📌 So if you closed the loss on time today, even if it hurt, you won.
Because we have saved not only capital, but also the most valuable thing: our trust in ourselves as a trader .
If this post made you nod😉, please rate🚀
And in the comments, write: which of these traps most often "catches" you?
(I still have the illusion of control sometimes. But now I recognize her and gently release her)