Trade ideas

Bitcoin Hit $126,199 I Warned It Was the Top While Others Call..When Bitcoin surged to $126,199, nearly every major voice on social media was calling for the next leg up toward $200,000. I wasn’t one of them. While the hype machine kept pushing bullish narratives, I publicly warned that the move looked exhausted and that we were likely witnessing the cycle top.
Now, the chart is proving that call right.
Key Levels Are Breaking
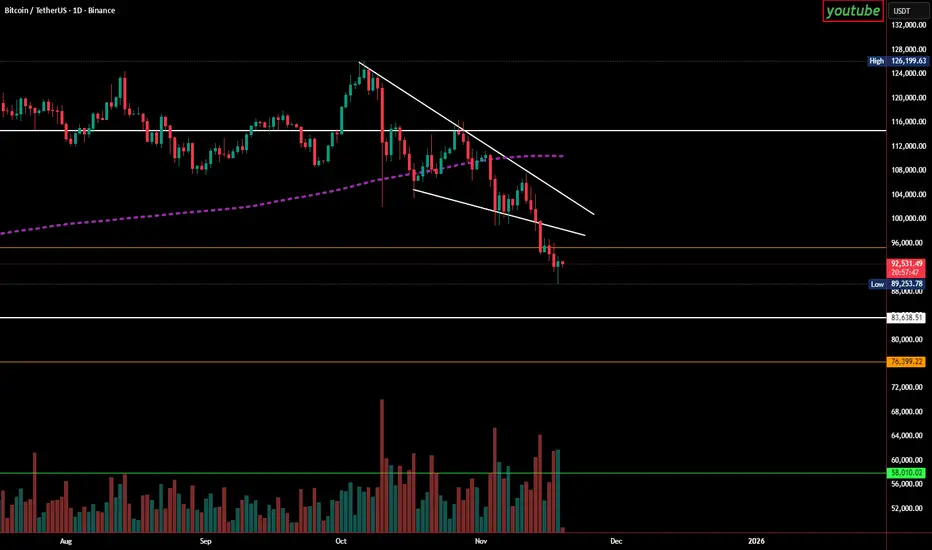
Since topping out, Bitcoin has fallen below several major support levels — including the critical $95,000 zone. The technical structure has shifted decisively:
Trend has turned downward
Momentum has weakened
Sellers are dominating volume
Price continues to make lower lows
This is not what a path to $200K looks like — this is what a post-top correction looks like.
How Low I Believe Bitcoin Can Drop
Based on the current trend, market structure, and historical behavior after previous peaks, these are the realistic targets I’m watching:
$89,000 – initial support already under pressure
$83,000 – a major demand zone
$76,000 – deeper correction range
$58,000 – full cycle flush if panic accelerates
These levels aren’t guesses. They’re grounded in technical analysis and the same signals that helped me call the top at $126K.
I Went Against the Crowd — And It Paid Off
While most influencers kept telling their followers to buy, I warned that the upside was limited and that a sharp reversal was coming. The market is now validating that call.
My Outlook
Bitcoin is still the dominant asset in the crypto market, but the current pattern suggests more downward pressure before any meaningful recovery. For the trend to flip bullish again, price would need to reclaim key levels and break out of the descending structure.
Until then, the chart continues to follow exactly what I warned about:
The top was in at $126,199 — and Bitcoin was never going straight to $200K.
BTC Sector 100150.0 — The Gates That Have Not Yet Opened🏷 BTC
🏷 19.11.2025
🏷 Capital Sector. Price Slice. System of Intelligent Anticipation. Capital Mapping — before instrument touch, this price slice is the planned action of major players.
🏷 Sector 100150.0 — The Gates That Have Not Yet Opened
🏷 The price has not touched the level — yet the market already stands at the threshold.
This is not resistance.
This is a sealed trajectory.
Those who see only candles — hear no whisper of liquidity.
Those who wait for signals — feel no pull of structure.
100150.0 is not a level.
It is the point where capital reconfigures its consciousness.
Some will buy.
Some will sell.
But only The Architect knows:
This is not the end of the move.
It is the beginning of its hidden cycle.
🏷 — The Architect, Capital Sector
🏷The language of markets is written in silence.
You do not predict it.
You recognize it — when it has already begun.

BTCUSDT _ Daily TimeframeBitcoin is currently sitting right on the midline support of a long-term ascending channel. This level has historically acted as a key decision zone for trend continuation or deeper correction.
Key Technical Levels
🔹 Support: ~$92,000 – $93,000 (mid-channel + demand zone)
🔹 Resistance: ~$105,000 – $110,000 (upper range)
🔹 Channel Ceiling: ~$145,000 – $160,000 (bullish target)
Scenario 1 – Bullish Continuation (Green Arrow)
If BTC holds above the mid-channel support, a bounce toward the upper trendline becomes likely.
Break above $110,000 would confirm momentum toward the long-term targets:
👉 $135,000 → $150,000 → $160,000
Scenario 2 – Bearish Breakdown (Red Arrow)
If price loses the $92K–$93K zone, BTC could slide into the lower channel support around:
👉 $82,000 – $86,000
This would still keep the long-term uptrend intact but indicate a deeper correction.
My Bias
BTC is at a critical support level. As long as this zone holds, the structure remains bullish with upside potential.
A clean daily close below the channel midline would shift the probability toward correction before any major continuation.

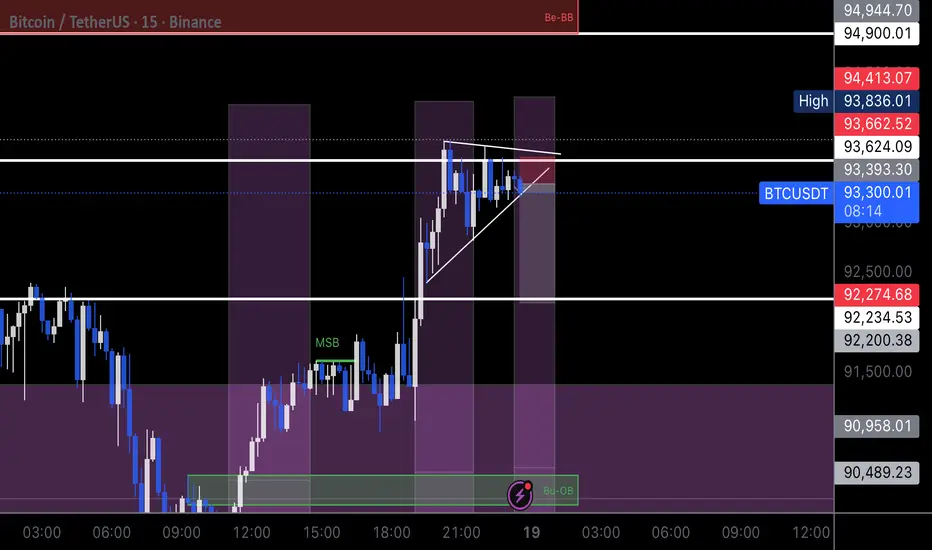
BTC/USDT : Long Into 96.6K RebalanceLiquidity taken below the prior low, displacement confirmed, and price delivered into a clean discount array.
Entry refined at 93.3K, drawing toward the 96.6K imbalance created by the previous sell-side leg.
The move is framed as a simple liquidity → displacement → rebalance delivery.
Stops sit below the internal low (92.8K).
Targeting the full inefficiency fill at 96.6K before reassessing structure.

Respect to All Iranian Traders Holding Strong Against Market noiRespect to All Iranian Traders Holding Strong Against Market Noise”
BTC Daily Breakdown
This analysis is dedicated to all my Iranian traders who keep pushing forward, even though TradingView doesn't always give enough visibility to symbols from our region.
We continue learning, improving, and trading with discipline — and that’s what truly matters.
In this chart, price tapped into a key bearish rejection block, failed to reclaim the zone, and continued breaking structure to the downside. The liquidity beneath the previous lows acted as a magnet, and the bearish orderflow remains in control as long as price stays below the rejection zone.
I’ve learned a lot from many international traders whose work has helped strengthen my technical approach.
Much respect to these analysts for their educational content and smart analysis:
@TraderMo @CryptoJelleNL @NaiimTrades @MayfairVentures
@NateFX @LSTraders @CryptoMellany @PAULSTUDY
@MarkCullenFX @KledTrading @TheSignalyst @TraderJupiter
@BrettCrypto @ChartPrime @RJR_Trading @CryptoBrrr
@ZenTradingTech @ElliottWaveStreet @EdgeTrading @Bitcoinsensus
Their insights helped me refine my structure-based approach, especially on BTC’s daily chart.
If you’re from Iran or anywhere else in the world, feel free to drop your view below —
we grow together, we build together.

BTCUSD Daily Chart – Bearish Channel Breakout + Hidden DivergencPrice has broken below the bullish channel on the daily chart, signaling potential reversal. A hidden bearish divergence is confirmed on the stochastic oscillator, aligning with the breakout.
📌 Entry: After channel break and divergence confirmation 📌 Stop Loss: Above recent swing high 📌 Take Profit: Based on channel height projection or key support zone
System-based short setup using EMA structure and divergence logic.

BTCUSDT.P - November 19, 2025Price is retesting the short-term resistance trendline and struggling to hold above the 93,000 area, suggesting weakening bullish momentum. A bounce toward the 94,000–95,500 resistance zone is possible, but failure to break higher may trigger a continuation of the broader downtrend toward the 89,000 support region.

BTC/USDTPERP BinanceBTC/USDTPERP #Binance #TA #Fibonacci
4H Hollows
As it was expected in the previous chart the price did indeed enter the support area, so at this point we have the following conditions:
first condition:
the price is expected to move sideways within the support area as shown in the extension of the Fibonacci retracement.
second condition:
a parallel descending channel has formed, where if the price moves within the parallel descending, it will advance within the support area.
if it does not break the support area, then the most likely is a rebound of the price, where the middle of the parallel descending channel will be broken.
third condition:
The price will continue to move within the parallel descending, until the price breaks out, either upwards or downwards.
Fourth condition:
The price, to move higher above $104,000 - $106,000, must break the upward diagonal line as we saw in the previous chart.
Good Luck
#CryptoHellas Team

BITCOIN LONGBitcoin long from 91k area.
A swing trade. This will occur during the week .
Let us be patient .

TECHNICAL ANALYSIS – BTC (4H)📉
1. Main trend – still down
I see a clear downward trend channel (yellow lines) on the chart. The price is moving in the lower half of the channel, which means that supply pressure is still dominant.
2. Rebound, but under strong resistance
The recent upside breakout looks more like a correction in a downtrend than a reversal.
The closest resistance levels I see on the chart:
94,500 – 95,000 → EMA + local level
96,000 – 96,500 → next EMA
98,000 – 99,000 → key level where the SMAs are located
Until BTC breaks above 96,500–97,000, there's no way a sustained trend reversal will occur.
3. Current Reaction at the SMA/EMA
The price touched the red moving average (SMA?) but was rejected—a classic reaction in a downtrend.
This signals:
a lack of buying power,
a predominance of supply in the 93,300–94,500 area.
4. Support Levels I See
At the bottom, you have specific lines that make sense:
89,900–90,000 → key support
89,500 → marked level
87,600–86,500 → lower part of the channel + previous bounce
If BTC loses 89,500, a move to the 87,000–86,500 area is very likely.
5. MACD – early, but cautious signal
The MACD has started to move up, but:
there is no clear crossover yet,
the histogram is weak.
Interpretation:
The rebound continues, but there is no confirmation of a trend change.
6. RSI – slightly bullish, but neutral
RSI ~49, so:
it is not oversold,
it is not overbought,
there is room for both a further rebound and a decline.
The RSI does not provide a strong directional signal.
📌 Summary – what looks most realistic?
Baseline scenario (60% chance): continued decline
Price will rebound to:
94,000–95,000,
possibly to the upper band of the channel (95–96K),
and be rejected → a decline to 89,500, and then 87,000–86,500.
Bullish scenario (40%): breakout of the channel
We need to see:
a 4-hour candle close above 96,500,
preferably a retest and hold,
only then can we talk about a trend reversal and a move towards 98,500–100,000.
📈 Market assessment (neutral–bearish)
Everything indicates that we are only in a correction within the descending channel. Until BTC breaks ~96.5K, the advantage is on the bears' side.

BTC trend wont be your friend forever. Bitcoin just bounced off the bottom of the downward channel. Momentum is trying to shift, but trend is still bearish until bulls reclaim the $96K zone.
Key points:
• Oversold signals firing across stoch & wave-trend
• MACD curling from deep red — early reversal signs
• Volume profile shows a low-volume gap above → clean path if $96K is reclaimed
• Rejection there = continuation of the downtrend
• Break above = room toward mid-$100Ks
Relief bounce is forming, but structure hasn’t flipped yet. Eyes on the yellow level — that’s where this move gets confirmed or denied.

Capitalize on fear in reversalsRichard W. Schabacker and Bob Volman are two investors separated by time and methodology. Yet they share one essential thing: both understand the market as a profoundly psychological phenomenon. Influenced by them, I try to trade with maximum simplicity and overwhelming logic.
Today I’m going to share with you one of the most ingenious methods I’ve ever discovered for exploiting high-probability reversals.
Psychological factor: Loss aversion
The pain of a loss is far more intense than the pleasure of an equivalent gain. According to Prospect Theory, developed by Daniel Kahneman and Amos Tversky in 1979, losses psychologically weigh roughly twice as much (or more) as equivalent gains. This causes people to become risk-averse when they are in profit but much more willing to take risks to avoid a certain loss.
In Figure 1 you can see a graphic representation of that pain and loss. Using trendlines, we observe sellers suddenly trapped by aggressive buying pressure.
Figure 1
BTCUSDT (30-minute)
Many of these sellers were undoubtedly stopped out quickly, but I assure you the majority — slaves to the cognitive bias known as loss aversion — will hold their positions hoping for a recovery.
The deeper the losses go, the greater their attachment to the position becomes, along with their desperation. Under that pressure, most of those unfortunate bears will only wish for one thing: a chance to get out of the market at breakeven.
In Figure 2, observe what happens when price returns to the zone where those sellers were originally trapped.
Figure 2
BTCUSDT (30-minute)
In the bullish signals of Figure 2 we can see the confluence of several factors:
Trapped sellers closing their short positions the moment price reaches breakeven, turning into buying pressure (and living to fight another day).
Profitable shorts who were riding the previous downtrend taking profits or closing positions after a deep pullback caused by buying strength, now near potential support zones.
New buyers entering because they see support near the low created by the previous bearish leg (especially if the downtrend has reversed into a range or accumulation phase).
In Figure 3 you can see two examples of groups of buyers who got trapped while expecting continuation of the uptrend. After two deep corrections, most of them only wanted to return to their entry price to escape unscathed.
As soon as price returns to that entry zone, those long positions turn into selling pressure.
Figure 3
BTCUSDT (30-minute)
Figure 4 shows more of the same: desperate bulls and a lot of pain.
Figure 4
USOIL (Daily)
Additional ideas
-Remember: the deeper the pullback, the greater the suffering of the trapped traders. We need them to panic so that, the moment price reaches their entry zone, they close without thinking twice — thereby validating and reinforcing our own positions. (Fibonacci retracements of 0.50, 0.618 and 0.786 are extremely useful for measuring the optimal depth of a pullback)
-Reversal patterns are also essential for our reversal entries because they significantly increase our win rate.
-We must be especially careful when trading against moves with very strong momentum. (characterized by near-vertical price action and disproportionately large candles)
Although I will soon go deeper into the management of this method, I recommend reading the article What nobody ever taught you about risk management ( El Especulador magazine, issue 01). You can also read the chapter titled The Probability Principle in Bob Volman’s book Forex Price Action Scalping .
If you enjoyed this article and want me to expand further on this and other topics, stay close.
We won’t be the ones getting trapped.
BTC lost momentum in Small time frame. ShortingBTC going back to a demand zone after losing momentum. Hope it will play well.
BTC Short until ETF Intro prices.See Idea. No further comments. NFA DYOR.
We are exiting the Bullrun for the 1 year bear market as usual each cycle. No need to overcomplicate it.

Risk Management for Automated SystemsAutomation gives you speed, consistency, and emotionless execution, but it also has a dark side.
A bot can follow rules perfectly, but if the rules are risky, it will amplify the danger with mechanical precision.
That’s why risk management is the backbone of every successful automated strategy.
It doesn’t matter how good your code is — without proper risk control, even the smartest system can fail fast.
Below are five core pillars of risk management that every trader should build into their automation framework.
1. Know Your Maximum Drawdown
Every trading system, even the best one, goes through losing streaks.
What matters isn’t avoiding them, but controlling how deep they cut.
Setting a maximum drawdown limit defines the exact point where your bot pauses or shuts down.
Whether it’s 5%, 10%, or 20%, this boundary protects your capital and your mindset.
Why it matters:
Prevents “death spirals” during high volatility
Stops the system if market conditions change
Forces you to step back and evaluate logic
Protects the account from black swan trends
A bot that can’t stop itself, is a bot that will eventually blow up.
A bot that knows when to stop, survives.
2. Position Sizing Is Everything
You can have the best entry logic in the world, but if your position sizes are inconsistent or too large, the system becomes unstable.
Smart position sizing adapts to:
Account balance
Market volatility
Asset liquidity
A fixed-percentage model, such as risking 1–2% per trade, keeps performance steady even during rough periods.
It also allows your system to grow naturally without taking oversized risks.
Think of sizing as the volume knob of your bot — turn it too high, and you distort everything.
3. Avoid Correlated Exposure
Running several bots doesn’t automatically mean you are diversified.
Many traders make the mistake of running multiple strategies that all rely on the same market behavior.
For example:
Three momentum bots on BTC, ETH, and SOL are still highly correlated
Two trend systems may fail at the same time if the market suddenly ranges
Several “dip-buying” strategies will all get hit hard during a crash
True diversification means mixing:
Uncorrelated assets
Different signal types
Varying timeframes
Both trend and mean-reversion logic
The goal is for your bots to perform differently, not identically.
4. Review Your System’s Risk Profile
Markets change, and so should your risk model.
Volatility increases and decreases, spreads widen, volume dries up, and certain assets become more unpredictable.
Regular reviews ensure your system stays aligned with real conditions.
What to check:
Has drawdown increased over the last quarter?
Are trades becoming larger than planned due to volatility shifts?
Has your system entered a new market phase it wasn’t designed for?
Are win rates or profit factor weakening?
A quarterly or monthly audit reveals issues before they explode.
Risk management isn’t a one-time setup — it’s a continuous process.
A strategy tester can be very good tool to help you manage risk properly and evaluate risk.
Here is an example from one of our strategies.
5. Let Risk Management Be Automated Too
If your entries are automated but your risk controls aren’t, you’re only half-protected.
Risk management logic you can automate:
Stop-loss placement
Progressive stop tightening
Position scaling
Reducing size after a losing streak
Pausing after reaching a daily or weekly limit
Complete shutdown at max drawdown
This turns your bot into a self-regulating system that responds to both opportunity and danger.
The more risk rules you automate, the less emotional interference you’ll face — and the more consistent your results become.

BTC Short\Long ????????? Two ScenariosAccording to the analysis provided, Bitcoin has maintained its upward trend in the weekly timeframe. In the event of a breakout of the bullish trendline, two scenarios are considered. If after touching the blue zone, the close is above the zone and in the pullback, we are in a long trade, but if the blue zone breaks down and the weekly candle close is below it, the probability of a further price drop is very high.

BITCOIN | LONG BIAS | POTENTIAL REVERSAL AND KEY LEVELS TO WATCHTraders,
Bitcoin is now sitting inside a large falling wedge structure on the daily chart. Wedges of this type often form during trend exhaustion and can precede significant reversals when the lower boundary is reached. This pattern sets the stage for everything that follows in this analysis.
Below is the full breakdown of why I believe Bitcoin is positioned for a potential reaction and where the most important levels are located.
Recap of the Previous Bitcoin Analysis
In the previous IG:BITCOIN analysis
I mentioned two scenarios. Scenario one outlined the following sequence:
• Price pushes into 107k to 108k
• That move sweeps the weak high and taps the AVWAP anchor
• If spot CVD slows or perps shift into net selling, a rejection becomes likely
• That rejection sends price back toward the mid range and possibly into 101k to 102k
• Continuation into the higher timeframe LVN at 98k becomes possible
Every single step unfolded almost perfectly.
Current State of Bitcoin
Bitcoin is now sitting directly on the lower band of the AVWAP anchored from 7 April 2025.
What this means
AVWAP stands for Anchored Volume Weighted Average Price. It calculates the average position of market participants beginning from the chosen anchor point. The April low marked a major shift in trend structure. When price reaches the lower band of an AVWAP anchored to such a significant low, it often acts as dynamic support. This is because it reflects the average entry of early cycle buyers.
If price holds and begins reclaiming from this area, it signals that the strongest hands are defending their positions. If it fails, the market risks a deeper flush into lower demand clusters.
Value Zone Analysis with Fixed Range Volume Profile
To determine whether Bitcoin is inside a significant value region, we use a Fixed Range Volume Profile (FRVP). The range is anchored from the April low to the October high.
Zooming into the profile on the left, price has now re-entered the core value area of this entire swing. The red horizontal line marks the Point of Control, which is the level with the highest traded volume in the entire range. The current low sits almost exactly on this level.
Pixel perfect confluence.
Why this matters
When price returns to the value area after a distribution phase, two possible outcomes appear:
1. Reversal
Buyers defend value and price rotates back toward high volume nodes above.
2. Continuation breakdown
Price accepts below value, meaning even previous buyers are unwilling to re accumulate here. This opens the door to the next low volume pocket and lower demand zones.
Right now, the reaction at this level is critical because we have perfect alignment between the lower AVWAP band and the FRVP Point of Control.
Mathematical Levels and Fibonacci Structure
Now we collect the mathematical evidence. We are sitting at a core AVWAP level and a core FRVP level. Now we check if the market is stretched mathematically.
Bitcoin at the 1.618 Extension
On the four hour spot chart, I apply a Trend Based Fibonacci Extension from A to B and project it from C.
The placement rule
Ask yourself:
What was the last meaningful swing high that ended the previous trend and started the current reversal?
That swing becomes A to B. The first corrective lower high after that becomes C.
Using this structure, Bitcoin has now extended perfectly into the 1.618 level. The 1.618 Fibonacci extension is historically associated with exhaustion. Sharp downlegs often pause, take liquidity, or reverse at this point.
TOTAL at the 2.0 Extension
To confirm that this move is not isolated to Bitcoin, we check the CRYPTOCAP:TOTAL crypto market.
TOTAL reflects the entire crypto market and shows equilibrium conditions.
When Bitcoin and TOTAL stretch at the same time, reaction probability increases.
Start with a retracement from A to B:
Price nearly hit the fifty percent mark but not entirely. Then reverse the tool from B to A. Doing so reveals the extension levels below. Price is now sitting exactly at the 2.0 extension.
Why the 50 percent connects to the 2.0
If a move retraces halfway, the remaining distance becomes the basis of the flipped extension. Doubling that distance gives the 2.0 level.
Because TOTAL did not fully reach the fifty percent retracement, there is a small missing portion. To visualise this, I draw a box between the actual retracement and the fifty percent level. Then I duplicate the box under the 2.0 extension.
The duplicated box lands perfectly on the current low, showing mathematical symmetry.
Additional Mathematical Check
I also check the structure that began after the 10 October crash.
By extending from B to A, the downside projections appear. Price tagged the 1.618 level perfectly.
Full symmetry
Bitcoin at the 1.618
TOTAL at the 2.0
Internal structure at the 1.618
When all three align, the move has reached market wide symmetry. These zones commonly produce strong reactions or reversals.
Summary so far
We now have confluence in four categories:
• AVWAP support
• FRVP Point of Control support
• Fibonacci extensions on BTC and TOTAL
• Mathematical symmetry across multiple swings
Next, we check the internal fuel of the move: order flow.
Order Flow Analysis
Spot CVD Divergence
On both the one hour and thirty minute charts, Spot CVD continues making lower lows while price holds steady. This means aggressive sellers are pushing market sell but price refuses to break down. This can only occur when passive limit buyers absorb the flow.
This is hidden absorption.
Coin Margined Futures CVD
Coin margined CVD shows the same pattern: lower lows while price stays flat.
This indicates aggressive shorting with no continuation.
Why coin margined matters
Coin margined futures use BTC as collateral. When price declines, the collateral loses value. When price rises, shorts lose even more because both their collateral and their position move against them. Coin margined shorts get squeezed harder and faster.
Open Interest
• Stablecoin margined OI: holding steady. Traders continue to open or maintain positions during sell pressure.
• Coin margined OI: compressed during the dump and is now flat. This means shorts are sitting in the market and can be forced out.
Summary
Price stable
CVD falling
OI steady
This is absorption combined with short build-up.
This often leads to a sharp reversal when price begins to lift.
Volume Analysis
Chart:
Accumulation and Distribution (A D Indicator)
The A D indicator shows whether volume flows into candles or out of them.
On the one hour chart, the A/D is trending up while price stays flat. This means buyers are stepping in during down-wicks and absorbing sell pressure. Price is not showing this strength yet, which is typical for accumulation phases.
On Balance Volume (OBV)
OBV measures directional volume flow.
On the last wick down, OBV actually moved up.
This means buyers absorbed the move rather than sellers pushing price down.
This is the classic bullish volume divergence after a liquidity sweep. Both Spot and Perps Confirm
These divergences appear on both spot and perpetual futures. Spot confirmation is the strongest form of validation because it represents real buying without leverage distortion.
The combination of A/D rising, OBV diverging, Spot CVD falling, and Futures CVD falling strongly supports that the sell pressure is being absorbed.
What Happens Next
Based on everything above, I expect Bitcoin to start by taking the weak local high at 99,862. Weak highs form when the wick structure is sloppy and no real sellers defended the level. On fine tick data, this high looks even weaker.
Taking that high breaks the current local structure and potentially triggers a short squeeze. If Bitcoin begins closing four hour candles above 106,200, the next important level is 108,500.
Main Thesis
Bitcoin pushes into the first target zone and performs a Swing Failure Pattern around 115,700. With strong momentum, the move could extend into the 17,300 to 18,000 region.
Invalidation and Downside
If Bitcoin loses support and spends meaningful time below 93,000, the next major support is 84,617. This is the next Point of Control from the AVWAP auction and an extremely important level to watch.
All relevant levels are marked on the charts.
Trade safe and manage risk.
From the depths of the sands,
ThetaNomad
-------------------
If you like my analysis, give it a like and leave a comment so more people can see real analysis without the noise.

Has The BITCOIN Bear Cycle Started? (1W)This is a weekly timeframe analysis. In this analysis, we examined the bullish phase that pushed Bitcoin from the $15K channel to the $125K channel.
This phase appears to be a bullish diametric pattern, with its final wave, G, completed as a triangle.
It’s important to note that there is a possibility for this diametric pattern to transform into a symmetrical pattern. The difference between a symmetrical and a diametric pattern is that the symmetrical pattern has two additional waves.
The price zone that could potentially turn our diametric pattern into a symmetrical one is the upper support area, between $64K and $74K. The potential timeline for a reversal is indicated by two vertical lines on the chart for the months of March and January. These were derived from the duration of previous branches of this pattern, where corrective branches of prior waves ranged between 16 to 25 weekly candles. If the pattern is symmetrical and not diametric, this means the next two waves of this bullish cycle are still remaining, following these timing rules.
In general, the intersection of the support zone and the timeline lines at the top of the chart is where the price could develop the pattern and move upward. However, if these zones fail, it means the main pattern was the diametric itself, and we are now in Bitcoin’s bear cycle. In other words:
If the price continues to decline, it’s possible that the diametric pattern was the main bullish phase, which is now complete, and Bitcoin has entered a monthly timeframe bear cycle that could last months or even more than two years.
The main support after this bullish phase, on higher timeframes, is in the $31K to $44K range, where Bitcoin’s bear cycle might finally end.
We hope this gives you a clear perspective on Bitcoin.
For risk management, please don't forget stop loss and capital management
When we reach the first target, save some profit and then change the stop to entry
Comment if you have any questions
Thank You

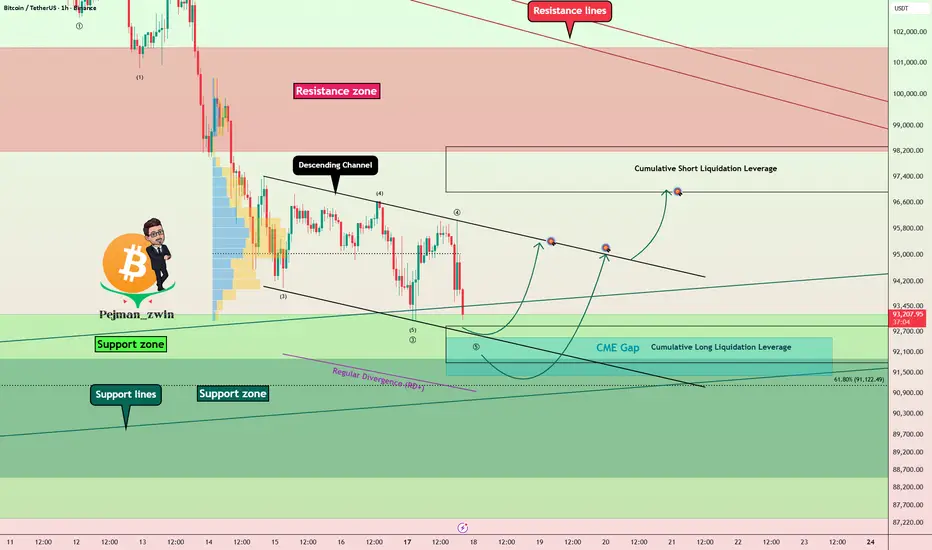
Bitcoin Roadmap: Major Support Ahead — Bounce or Breakdown?As expected in the previous idea , Bitcoin ( BINANCE:BTCUSDT ) has dropped to $93,040(Target done) .
The question now is whether Bitcoin will continue its downward trend or not.
Currently, Bitcoin is moving near the Support zone($93,200-$87,340) and key Support lines .
From the perspective of Elliott Wave Theory , Bitcoin seems to be completing Wave 5 , with the Wave 3 being extended .
I expect Bitcoin to start rising again by entering the Cumulative Short Liquidation Leverage($92,869-$91,763) and possibly from the lower line of the descending channel.
There is a possibility of a fake breakout , but be careful of the momentum of the decline.
First Target: $95,297(near the upper line of descending channel)
Second Target: $96,831
Stop Loss(SL): $90,727
Points may shift as the market evolves
Cumulative Long Liquidation Leverage: $98,338-$96,913
CME Gap: $92,525-$91,415
Note: Since Bitcoin has had a high correlation with the S&P 500( SP:SPX ) recently, and if the S&P 500 continues to decline, we can expect Bitcoin to follow suit.
Another important note is that rising tensions between the U.S. and Venezuela could also impact the crypto market, so we should keep that in mind.
Where do you think Bitcoin’s correction will go?
Please respect each other's ideas and express them politely if you agree or disagree.
Bitcoin Analysis (BTCUSDT), 1-hour time frame.
Be sure to follow the updated ideas.
Do not forget to put a Stop loss for your positions (For every position you want to open).
Please follow your strategy and updates; this is just my Idea, and I will gladly see your ideas in this post.
Please do not forget the ✅' like '✅ button 🙏😊 & Share it with your friends; thanks, and Trade safe.
Bitcoin – A Gentle Slide Into A Strong ReactionBitcoin continues to trade inside a clean falling channel, moving lower in a controlled manner as it approaches a major support zone. The overall flow remains bearish in the short term, however the structure suggests we are nearing an area where a short term bullish reaction becomes highly probable. Momentum remains soft, but the market is clearly hunting liquidity beneath the channel, which aligns with the expectation of one more drive lower before a meaningful bounce forms.
Channel Structure And Liquidity Behavior
The descending channel is guiding price efficiently, with every lower high respecting the upper boundary and confirming that sellers are still in control for now. This controlled descent usually signals that the market is preparing for a sweep of the lows rather than a sudden break. As price presses toward the channel’s lower boundary and the highlighted support zone, liquidity becomes the focus. A sweep beneath the most recent lows is the type of inducement that often precedes a strong reversal.
Support Zone Reaction Expectations
The green support zone marked on the chart remains the key area of interest. It aligns with previous accumulation behaviour and prior reactive turning points, giving it weight as a zone where traders expect a bounce. Once price pierces into that zone, the probability of a short term bullish response is high. The ideal reaction would be a sharp rejection from the lows, followed by a move back into the body of the channel and a gradual push upward as the market begins absorbing sell orders.
Retest And First Resistance Layer
If the support holds and price bounces, the first significant obstacle will be the red resistance zone above. This area represents the first real test of whether buyers have the strength to absorb supply. A clean move into that zone, followed by a higher low, would confirm the shift in momentum and support the idea of a short term bullish continuation. Failure at this level would simply keep Bitcoin inside the same corrective structure.
Short Term Bullish Scenario
The most probable bullish path is simple: a liquidity sweep into the support zone, a strong rejection, a move back toward mid channel levels, and then a steady climb into the first resistance area. The market does not need to break any major structure immediately. A clean reaction from support is enough to anchor a short term bullish leg, even if the larger trend is still corrective.
Conclusion
Bitcoin is approaching the point where a short term bullish bounce becomes increasingly likely. The falling channel, the upcoming liquidity sweep, and the depth of the support zone all point to a reaction that should materialize soon. Patience remains important, as the bounce is expected only after the market completes its liquidity objective in the support area.
___________________________________
Thanks for your support!
If you found this idea helpful or learned something new, drop a like 👍 and leave a comment, I’d love to hear your thoughts! 🚀

BTC - UPDATE - PERFECT!!! Every week I share my #Bitcoin outlook, & almost 9 times out of 10 it's literally a copy/paste of my view🔥
Here we are! $ 88,000 support ✅
Following my analysis, this is the biggest demand zone is in! 🎯
🟥Is the bear market starting?
🟩Or will a new ATH begin from this low?
Follow to not miss any weekly #BTC outlook!

BtcUsdtBINANCE:BTCUSDT
Bitcoin has dropped around 30%, and it has done so before, so it's possible it will bounce back within an upward channel. This isn't advice, just an opinion.
