BTC 4H Chart Review1. Market Structure: Rising Channel (Upward Wedge / Rising Channel)
The chart clearly shows that BTC is moving within an ascending channel, with:
the upper boundary around USD 95,000–95,500,
the lower boundary currently reaching USD 86,500–87,000.
This is a potentially exhausting formation, and lower breakouts are often dynamic.
2. Current Situation: Rebound from the upper band and Stoch RSI overbought → decline
The price has stopped exactly at the upper resistance of the channel and has begun a correction.
This is typical behavior – the market usually returns to the middle or lower edge of the channel.
Stoch RSI on 4H – has made a strong reversal from the overbought zone
→ a signal for a short-term correction has already been generated.
3. Support Levels (most important):
🔴 USD 90,500–90,000
A very important zone – previous resistance ⇒ now support.
Breakout = increased risk of a deeper breakout.
🔴 USD 88,500–88,000
A strong demand level for the 4-hour period, also aligned with the MA and local lows.
🔴 USD 86,500–87,000
The lower band of the channel – the most likely place for buyers to become active.
4. Resistance Levels:
🟢 USD 94,800
Previous local high – a breakout will be bullish.
🟢 USD 98,000–98,900
Strong resistance on the chart, likely target after a breakout of the channel to the upside.
5. Scenarios for the coming hours:
📉 Correction scenario (more likely based on the Stoch RSI)
The price could fall to one of the following zones:
92,000 → test in progress
90,500–90,000 USD → main market decision level
If it loses 90,000 → a move to 88,500–88,000 is natural.
Deeper correction: test of the lower channel line – ~86,500 USD.
In this scenario, we remain in an uptrend unless the channel breaks below.
📈 Uptrend scenario
The current decline could only be:
a local correction,
a retest of the previous demand zone.
Uptrend condition:
➡️ 4-hour candlestick retracement and close above ~94,000 USD.
Then the target:
94,800
95,500
and after the channel breakout → $98,000–$99,000
Trade ideas

BTC/USDT | Another run over 100K? (READ THE CAPTION!)By analysing the 4H BTCUSDT chart, we can see that a fall into the FVG and dropping all the way too $87700, it has reacted positively and is now being traded at $91700!
We shall see if BTC manages to go through the daily FVG, which is the $96900-$98000 zone. If BTC goes over than zone, another run to over $100K is possible!
This analysis will be updated!

DeGRAM | BTCUSD will test the $80k level📊 Technical Analysis
● BTC is retesting the multi-month support zone near 80K, aligning with the long-term ascending base and the lower boundary of the falling trend, creating conditions for a medium-term rebound.
● A break above the descending resistance line could trigger recovery toward 92K as the structure shows exhaustion of bearish momentum.
💡 Fundamental Analysis
● Recent ETF inflows and easing macro pressure from U.S. yields support accumulation near major support zones.
✨ Summary
● Bullish bias from 80K support. Targets: 88K → 92K. Key support: 80K.
-------------------
Share your opinion in the comments and support the idea with a like. Thanks for your support!

Bitcoin daily resistanceEven with the QT news, BTC still can’t break its daily resistance. It’s still in a downtrend, and I guess that could continue until the end of the year.

Bitcoin Analysis — Pre–New York Session SetupFear & Greed Index: 22 — still in Fear.
👋 Hello Traders! Let’s dive into today’s Bitcoin analysis.
Today’s outlook isn’t very different from yesterday —
we simply have more structure, more clarity, and the market has moved deeper into our expected zones.
And since I wanted you to have this before the New York session, here we go:
📰 Weekly Outlook — No Clear Signal Yet
On the weekly chart, we’re printing something close to a Doji candle.
❓ Does this weekly candle tell us anything significant?
➡️ Not really.
The market had a sharp drop, and now it’s simply resting — completely normal.
I’ve mentioned in previous weekly scenarios that we might range until the end of the year,
and so far the market is following that exact script.
But does ranging mean no long or short positions?
❌ Absolutely not.
It simply means:
Take profits earlier
Avoid holding trades for too long
Do NOT treat mid-range setups as long-term positions
🎯 Key Higher-Timeframe Levels
Two extremely important levels remain:
$78,000
$100,000
These are the levels that can confirm a long-term trend shift (up or down).
They’re also the “heavyweight” breakout levels —
meaning:
When you’ve captured several good R/R trades,
one of them is worth leaving open in case these levels break.
Because if either level breaks, the move could be so sharp that entering afterward becomes nearly impossible.
📉 Lower Timeframe Structure
Now let’s zoom in:
Sellers are attempting to push price toward $84,000.
Two scenarios from here:
Scenario A — Strong Sell Continuation
If sellers manage to reach $84k,
the next short setup becomes straightforward:
📌 Short continuation toward $78,000
(ONLY if momentum remains strong after $84k touches or breaks).
⚠️ Scenario B — Sellers Fail
If sellers show weakness and fail to push price to $84k,
Bitcoin will likely form a range between $84k – $92k.
Inside that box,
only short-term trades make sense — no swing positions.
🚀 Bullish Scenario
If price returns upward toward $92,000,
I will personally open a long position.
🔍 4H Compression Zone — Important!
Bitcoin has created a compression structure between:
$89,000 and
$89,700
This zone is crucial.
Break upwards → I will long altcoins with bullish correlation to BTC.
Break downwards → I will short BTC or altcoins with bearish correlation to BTC.
⚠️ But only AFTER real volume enters the market.
Always track volume — it’s everything in this phase.
✔️ Final Words
Thanks for reading today’s analysis!
I hope you have a great day full of focus and profits.
And remember:
💛 Risk management isn’t optional — it’s your survival tool.
Stay safe, stay sharp, and see you in the next update! 🚀📊

Bitcoin's future scenario in the 4-hour timeframeBitcoin's future scenario in the 4-hour timeframe.
Despite the economic and war developments between the United States and Venezuela, and renewed threats between Israel and Iran, the situation in financial markets will remain uncertain, at least until after the Christmas holidays.

Wave (I) Completed at 126K — Wave (II) in ProgressBINANCE:BTCUSDT
On the weekly chart, the advance clearly topped at 126K.
Momentum had already begun to fade before the peak, and several indicators confirmed it:
-- RSI : formed a lower high compared to the Wave 3 peak, signaling weakening upside momentum.
-- MACD : showed a noticeable loss of strength during the final push.
-- ADX (+DI/–DI) : reflected declining trend strength as +DI weakened and –DI gained traction.
Price also made a new high without matching momentum - a typical exhaustion pattern often seen near major market peaks.
Together, these weekly signals confirm that 126K marked the completion of Wave (I), and that the current decline represents the early phase of a broader Wave (II) correction.

The $91k Liquidity Re-Fueling Scenario Before $95kKey Level: $90,000 - $91,000
Significance: This area acts as a major psychological and structural wall. We anticipate significant selling pressure and liquidity pools here (Supply Zone).
The Bullish Requirement: For the move to $95k, the price must reach this area and then Consolidate (settle). A successful Flip to Support is confirmed by closing candles decisively above $91,000. This 're-fueling' provides the necessary market energy.
2. The Next Milestone
Ultimate Target: $95,000
Execution Condition: If the $91,000 level is successfully flipped and held as support with conviction and volume, the next major technical and psychological target for this short-term run is $95,000.


BTC/USDT: Bullish Pullback Into Demand ZonePrice is currently pulling back after a strong upward move and is approaching a key intraday demand zone (highlighted in orange). This zone has previously acted as a support base for continuation moves and aligns with the current short-term structure of higher lows.
The circled area represents a potential liquidity sweep / reaction point, where price may wick into the zone before buyers step in. If bullish momentum returns from this level, a continuation toward the marked target area above is likely.
Key Points:
🔸 Trend: Short-term bullish structure still intact.
🔸 Demand Zone: Watching for reaction inside the highlighted support area.
🔸 Bullish Signal: A clean bounce or strong bullish candle from this zone.
🔸 Target: Next upside zone around the 94k–95k range (as indicated on chart).
🔸 Invalidation: Break and close below the lower demand zone would weaken this bullish scenario.
This setup suggests a potential buy-the-dip continuation if support holds and momentum returns.

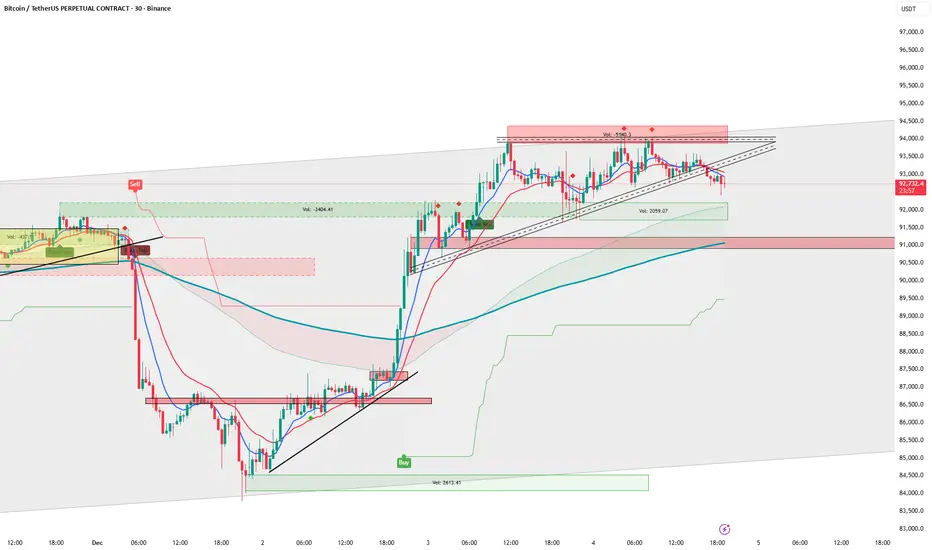
BTCUSD : Technical analysis Mini Demand Zone After Bearish Comes📊 BTCUSD 30-Minute Analysis — Reversal Zone + Volume Burst Setup
1. Market Structure Overview
On the 30M timeframe, BTCUSD is currently trading inside a corrective phase after rejecting the upper resistance area around $91,000 – $92,000. The price formed a rounded-top structure, indicating a gradual weakening of bullish momentum.
The market has been moving sideways with decreasing volatility, suggesting accumulation or preparation for the next move.
2. Major Drop & Formation of Fresh Reversal Zone
A major bearish move pushed BTC down into a strong Reversal Zone (RZ) positioned around:
**🔽 Key Reversal Zone (Demand Area):
$88,000 – $87,000**
This zone is significant because:
It aligns with previous reaction level from Dec 2
Strong buy-side volume burst previously originated here
Price has already shown a wick rejection, signaling buyer interest
This is a high-probability demand area where institutions previously entered the market.
3. Volume Burst Confirmation
Inside the Reversal Zone, the chart highlights a Volume Burst area.
Why Volume Burst Matters:
Shows strong buying pressure
Indicates absorption of sell orders
Confirms demand is active at this region
If BTC revisits this zone, buyers may aggressively defend it again.
4. Expected Short-Term Movement
Your chart shows two potential scenarios:
Scenario A – Bullish Reversal (Most Likely)
Price may dip slightly into the Reversal Zone
Strong buyers react at the volume burst area
Market forms a bullish reaction candle
Break above minor consolidation leads to upward continuation
Target Levels After Reversal:
$89,800 – Pattern Completion
$90,500 – Short-Term Resistance
$91,000 – Structural High Retest
Scenario B – Bearish Breakdown (Less Likely but Possible)
If the Reversal Zone fails:
BTC may slide toward $86,500 – $85,800
This would confirm a deeper correction phase
But current PA suggests buyers are preparing a move upward.
5. Pattern Must – Confirmation Zone
A label on the chart shows "Pattern Must" around $89,500–$89,800.
This is the confirmation level where:
Break and retest = bullish continuation
Rejection = temporary sideways / deeper pullback
This acts as the neckline for a potential reversal pattern.
6. Technical Summary
Bias: Bullish from Reversal Zone
Main Support: $88,000 – $87,000 (Strong Demand)
Immediate Resistance: $89,800
Trend Outlook: Accumulation → Possible Upside Reversal
BTCUSD is currently forming a technical base, and a move upward is expected once price reacts strongly inside the Reversal Zone.
🎯 Conclusion
BTC is approaching a high-probability buying zone backed by:
Reversal Zone
Previous demand
Strong volume burst
Rounded-top breakdown structure
Market preparation for pattern completion
A bullish reversal remains the primary expectation, with targets toward $89,800 – $91,000.

BTC 4H – Complete Technical Analysis & Trade PlanMarket Structure
BTC is still in a macro downtrend, continuously creating Lower Highs (LH) along the descending trendline.
Recent bounce from 87,766 formed a Higher Low (HL), but structure remains bearish until price closes above 93,080.
Key Levels
Resistance / Liquidity Above:
93,080 (Major LH + liquidity cluster)
98,888
107,473
116,380
Support / Liquidity Below:
87,766 (HL)
83,786
80,600
Pattern & Trend
Price is compressing inside a symmetrical triangle, between:
Descending trendline resistance
Ascending demand trendline
This signals a volatility expansion soon.
Indicators
RSI: 65 → bullish momentum but approaching overbought zone.
Previous bullish divergences have played out.
No fresh bearish divergence yet.
Volume
Impulse buying was strong, but volume faded near resistance.
This warns of a potential rejection unless a breakout happens with high volume.
Next Likely Move
BTC likely sees:
A pullback from the 93k resistance
Into the 90k–89.5k region
Then a decisive move based on trendline reaction.
Break above 93,080 = trend shift.
Break below 87,766 = continuation down.
High-Probability Long Setup
Condition: Breakout + retest of 93,080
Entry: 93,200–93,300 on successful retest
SL: 91,300
TP1: 98,888
TP2: 107,473
TP3: 116,380
RR: 2R to 7R
Confluence:
Break in structure, break in trendline, liquidity sweep, volume expansion.
High-Probability Short Setup
Condition: Rejection from descending trendline + 93k zone
Entry: 92,800–93,000
SL: 93,800 (above liquidity)
TP1: 90,000
TP2: 87,766
TP3: 83,786
TP4: 80,600
RR: 1.8R to 7R
Confluence:
Trendline resistance, LH zone, fading volume, liquidity above price.
Summary
BTC still bearish until 93,080 breaks.
Market in compression phase.
Large move coming soon.
Best setups:
Break-and-retest long above 93,080
Rejection short from 93,000

LongBtc long Hello everyone
Bullish position, Bitcoin if it breaks heavy resistance 94k and consolidates above 96k, next target 103k

BTC LongThis is a reversal trade, so be careful!. When its reversal trade, stick to SL regardless.
The reason for the trade is as simple as higher lows on 4h tf, broke a downtrend line.
Good luck everyone !!

EcoByG Bitcoin Daily Analysis #4 — Daily BTC Market UpdateWelcome to My Analysis.
Now, let’s break down today’s Bitcoin structure.
On the daily timeframe, the structure remains clearly bearish.
Price is still trading below broken structures and under several major resistance levels.
After the strong drop, Bitcoin is now in a corrective phase within a downtrend.
Price is currently ranging between the two key levels:
83,900 – 93,700
From a price-action perspective:
Candles have formed a Lower High
Price still does not have the strength to create a Higher High
→ This confirms ongoing weakness.
A Demand Zone (red box) has formed around 83–84K, which caused the previous strong recovery.
For now, price is trapped between the descending dynamic trendline and the 84K support.
Volume — the most important factor for me
Low volume at the bottom → indicates uncertainty and lack of decision-making
No strong reversal volume yet
→ Buyers are not showing real commitment.
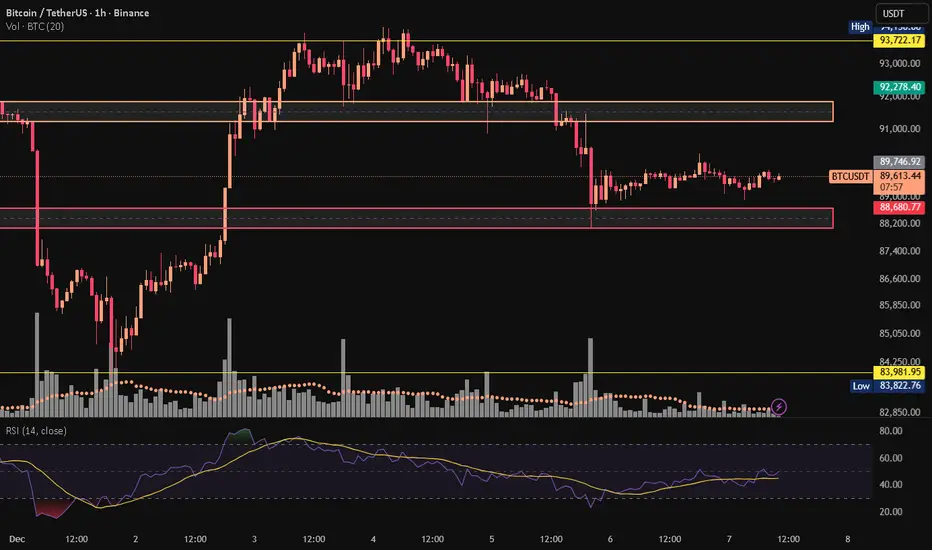
What’s happening on the 1H timeframe?
There are two major zones:
🔴 Supply Zone — 91,800 to 92,300
This is the top of the previous range
Price entered it multiple times but got rejected
Last entry → sellers immediately took control → drop to the low
Key signal:
Each time price enters this box, we see many upper wicks and rejections
Volume does not increase → meaning no strong buyers attempting a breakout
Result: Range and rejection
🟢 Demand Zone — 88,250 to 88,700
This zone has been extremely clean on the 1H:
First touch → strong reaction + fast rebound
Volume spiked exactly at the touch → showing real buyers
Candles have strong lower wicks
Price has revisited the zone several times without breaking it
Key signal:
As long as this zone holds,
the short-term trend = bearish range with strong support.
What does volume tell us?
🔸 Volume on the drops → high
→ Sellers were serious, intentional.
🔸 Volume during pullbacks → low
→ This confirms the move is corrective, buyer strength is weak,
and continuation of the downtrend is more likely.
🔸 Volume increased inside the demand zone
This is the most important signal of the entire chart:
When price touched 88,300–88,700,
a candle printed with above-average volume.
→ This confirms the demand zone has real buyer interest.
👈 So for now, this bottom is defendable.
Current Market Structure Summary
🔵 Higher TF (Daily): Bearish
🟠 Mid TF (4H–1H): Bearish range
🟢 Low TF (1H): Range with slight bearish bias
Meaning:
Primary trend → Bearish
Current structure → Range-bound
Entry triggers → Breakout of the range
Key Levels That Determine the Next Move
If 88,250 breaks:
Bearish continuation
Target → 83,900
If 92,300 breaks:
Range ends
Structure shifts bullish on higher timeframes
Targets :
93,700
100,565
⚠️ Risk Alert ⚠️
Futures are not beginner-friendly. These triggers require solid experience.
Before using them, study risk management and practice with the learning content here.
BTCUSDT.P 30min Short Setup: 92,799 Testing Support BreakdownBTCUSDT.P at 92,799 on 30min consolidates near lows (92,610), with SELL signals strong amid tight range post-pullback.
88K IncomingA liquidity sweep under 88K is imminent. A lot of buy orders currently are likely to trigger a manipulation and a downtrend seeking the 88K region.

Back in the stress test area againLooking at the 4-hour chart, the liquidity trend is still too strong. Let’s see if it can stay above 93,200 for the next 3 hours. If it holds, we can buy without hesitation. If not, we’ll sell.

BTC/USDT Analysis. Reached Key Resistance
Hello everyone! CryptoRobotics trader-analyst here, and this is your daily market update.
Yesterday, Bitcoin reached the important resistance area at $94,000–$97,500 (high-volume zone). At this level, buyer price action weakened noticeably, and cumulative delta shows a clear dominance of sellers — indicating that upward momentum is fading locally.
Given this context, we expect a correction toward the nearest support zones, from which the uptrend may resume with targets above $100,000.
A move back into the $84,000–$82,000 (volume anomalies) zone from current prices would cast doubt on the strength of the current bullish wave, making this scenario unfavorable for continued growth.
Buy Zones
$91,000–$89,800 (mirror volume zone)
$87,800–$86,400 (volume zone)
$84,000–$82,000 (volume anomalies)
Sell Zones
$94,000–$97,500 (volume zone)
$101,000–$104,000 (accumulated volumes)
$105,800–$106,600 (local resistance)
This publication is not financial advice.

The possibility of btc fallingBTC is testing the upper boundary of an ascending channel near $93,600–$93,700.
Price action shows a potential double-top or rising wedge pattern—often bearish.
Volume is declining, suggesting weakening bullish momentum at resistance.
A brief pump toward $94,000 is possible, but a rejection could trigger a drop to $92,500 or even $91,000.
Break above $94,000 would invalidate the bearish setup and signal further upside

BTC SHORTBTCUSDT – Short Position Still Valid
Price continues to respect the bearish structure after the reversal.
We rejected the mitigation zone and stayed below the Alligator EMAs, confirming continuation.
• Short remains active
• Invalidation: Any 2H close above 89,632 – 89,892
• Structure: Lower highs + compression under resistance
• Expectation: Continuation lower after wedge breakdown
Targets:
1. 88,900
2. 87,700
3. 82,160 (main objective)
Still watching for a possible stop-hunt into the red zone, but bias remains bearish unless invalidated.

BTC/USDT 4H Chart Review🧭 1. Main Market Structure
The chart shows:
A broad downward channel that has been in place since the end of October.
The price bounced off the upper line of the channel, made a local upward impulse (orange trend line), and then broke it, returning back towards the lower regions of the channel.
➡️ This means that the dominant trend is still downward, and upward bounces are corrections.
🧨 2. Current Chart Situation
BTC has broken through:
the local uptrend (orange line)
fell below the 88,500–89,000 zone (green)
is heading towards further support levels
Currently, the price looks like a typical retest of the broken structure and a continuation of the decline.
🟩 3. Key Price Levels (S/R)
Resistance (upper – green):
91,600 – 92,000 – key level, a breakout would negate the local downtrend
95,000 – 97,500 – upper range of the descending channel
Support (lower – red):
85,300 – 85,800 – local support (price is currently reacting here)
83,000 – 83,100 – strong horizontal support
79,800 – strong support, historically strong in this timeframe
76,600
75,000 – lower band of a potential drop + near the lower boundary of the channel
➡️ The most logical downside targets are 83,000 and 79,800.
📉 4. Descending Channel (black) (lines)
The price has rebounded from the upper range of the channel and is heading towards the lower range.
The middle line of the channel has been broken down → a signal of trend continuation.
The lower boundary of the channel indicates a potential low around 75,000–78,000.
🔄 5. Stoch RSI
Currently oversold in the oversold zone, it is starting to curve upwards.
In a downtrend, long signals are weaker, but a short-term rebound is possible.
🧭 6. Scenarios
📉 Bearish scenario (more likely)
Technical rebound to 88,500 – 89,000
Rejection from this zone → continued decline
Targets:
83,000
79,800
Extremes: 76,000 – 75,000
➡️ This scenario is consistent with the trend and a rebound from the upper channel.
