BTC at Risk: Structure Break + RSI Warning$BTC/USDT is showing some concern on the monthly chart as price has broken below the rising wedge and is now retesting a major demand zone. Losing this zone could trigger a deeper correction.
At the same time, RSI is showing a clear multi-year bearish divergence, highlighting weakening momentum.
Until BTC reclaims the wedge support or closes back above the resistance band, downside risk remains elevated.
DYOR, NFA
Please hit the like button if you like it, and share your views in the comments section.
Trade ideas

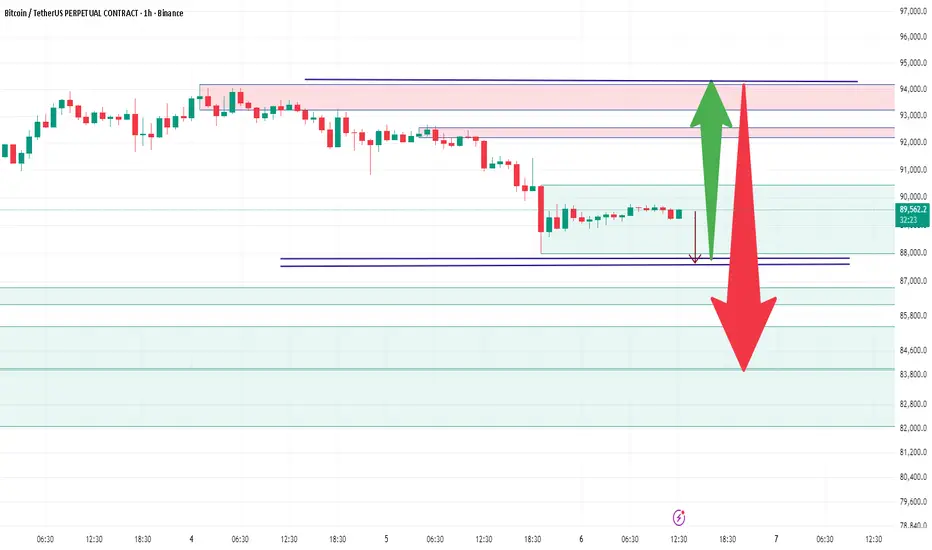
BTC: Target 100KBTC pulled back again over the weekend, dropping below 90K. I’ve been consistently emphasizing that levels below 90K present the optimal buying opportunity—and the market has rallied as predicted, aligning perfectly with my analysis. We now continue to wait for an upward breakout, with the target set at 100K.
I send accurate signals daily—all signals have been 100% correct for two consecutive weeks. Don’t miss out!

BTC aiming to retest 98k to 100k Several factors coming together:
The market is very bearish in sentiment. Selling likely exhausted here and short side probably overcrowded
Daily demand is holding and displaying strong reactions
Untested Weekly gap above and untested daily supply zone are calling for a liquidity test.

BTC_updateHidden Bullish divergence on the weekly chart. Still stuck in the cloud. When we break trough the cloud next resistance zones are indicated on the chart. Biggest ressistance zone is the 109.000$ region. I will do an update next saturday.

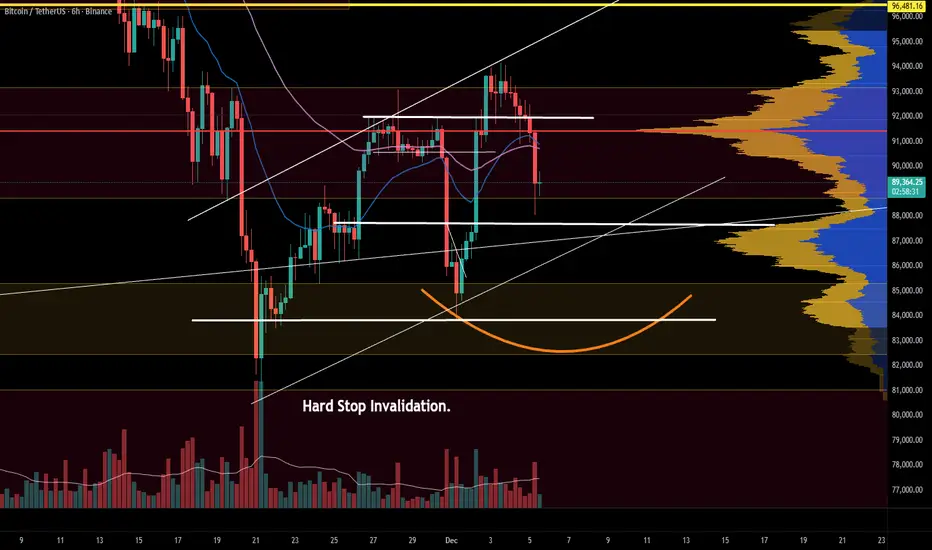
Bitcoin falling but still within structureBTC just pulled back from the mid-range rejection and is now retesting a key support cluster. The reaction here decides the next leg.
Price is sitting right on top of a major confluence zone: previous structure support, the lower trend line, and a high-volume node that has acted as a pivot multiple times. Lose this area and the “hard stop invalidation” region comes into play, which would likely trigger a deeper move toward the lower range.
Momentum indicators on the 6H are rolling over after failing to reclaim the upper band. Bulls need a higher low and a quick reclaim of the mid-range to keep momentum in their favour. Failure to do so opens the door for a broader corrective structure.
For now, the chart is simple: defend the floor or risk a larger breakdown. Reclaim resistance and the bullish continuation pattern remains intact.
What’s your read on BTC here?
BTCUSDT 30M Analysis: Reverse Zone Re-Test Before Major Drop 📊 BTCUSDT 30-Minute Technical Analysis – Reversal Zone Under Pressure
This 30-minute BTCUSDT chart highlights an important bearish setup forming after a sharp downside move. Bitcoin is currently consolidating near a Reversal Zone, suggesting that price may attempt a retest before continuing lower.
🔻 Market Structure Overview
Bitcoin recently experienced:
A strong impulsive sell-off
A brief consolidation phase
A minor recovery back into a previous support now acting as resistance
This structure indicates that sellers are still in control.
🟥 Reversal Zone (Major Resistance Area)
The highlighted red zone is the primary bearish reaction area.
Why this zone matters:
Price broke below this level with strong momentum
It is now acting as a potential supply zone
A bearish candlestick pattern in this area would confirm sellers stepping in
Your chart clearly notes: “Bearish Pattern Need On That Zone.”
A rejection here is the most important bearish confirmation.
🟦 Mini Reversal Zone (Previous Demand Area)
Below current price sits a smaller demand zone.
This zone previously showed:
Buyer reactions
Short-term reversals
Support in the recent downtrend
If price breaks below this mini zone, BTCUSDT may aim for deeper liquidity levels, confirming bearish continuation.
📉 Expected Price Behavior
Based on the projected path drawn on your chart:
Price will retest the Reversal Zone
A bearish engulfing, pin bar, or rejection wick may form
Price may drop aggressively after confirmation
Final target is a deeper zone around the previous swing lows
The downward arrow illustrates the expected continuation if bulls fail to defend nearby support.
⭐ Key Takeaways
Bitcoin remains in a bearish structure on the 30M timeframe
A strong bearish pattern in the Reversal Zone is required for confirmation
Rejection from this resistance may trigger another downside wave
Break and hold above the zone would invalidate the short-term bearish outlook
🧠 Short Summary for Minds
Bitcoin is approaching a key Reversal Zone on the 30-minute chart. If a bearish pattern forms here, BTCUSDT may continue dropping toward lower support levels. Sellers remain strong unless bulls break above the resistance zone.

BITCOIN - PRESSURE BUILDING - SHORT SQUEEZE INCOMING?Traders,
Bitcoin might be preparing a short squeeze. Let’s walk through the flow, structure, math, and correlations step-by-step so you understand what is happening and why it matters.
1. What Happened
Bitcoin dumped from 96k → 80.6k last week. Price then bounced and is now trading around 87k.
Under the surface:
Stablecoin-Margined Futures (USDT-M)
Since 27 Oct:
OI increased from 225k → 280k contracts
That’s +55k contracts (~24% increase)
CVD went down, not up
Meaning:
These new positions were mostly shorts
The market added leveraged short exposure during the dump
Interpretation:
USDT-M traders attacked the move lower aggressively. Increasing OI + dropping CVD = new sellers dominating, not buyers.
Coin-Margined Futures (BTC-M)
Since 27 Oct:
OI and CVD both dropped from 7.41B → 5.90B
BTC-M is usually “higher conviction” demand
A drop in BTC-M CVD means
Longs closing
Capitulation
Reduced bullish positioning
Interpretation:
Native BTC longs stepped aside. Short-term leverage traders pressed the downside.
Spot + Futures CVD (27 Oct → 21 Nov)
Spot CVD ↓
Futures CVD ↓
Price ↓
All making lower lows and lower highs
This was a clean, correlated downtrend.
2. The First Major Shift: Spot CVD Divergence
Since 21 November:
Spot CVD:
Higher highs
Higher lows
Rising together with price
Indicates real demand stepping in
Stablecoin Futures (USDT-M):
Still making lower lows
Still pressing shorts
Still fighting the spot buyers
This is the key:
Spot = real money
Futures = leveraged speculation
Rising spot CVD vs falling futures CVD = absorption pattern
Meaning:
Strong hands buy
Weak shorts keep selling
Price rises anyway
The pressure builds
Shorts eventually run out
The squeeze begins
This is one of the cleanest pre-squeeze structures you can get.
3. The Math: Fibonacci Rotation Logic
Let’s break down the structure.
(A → B → C Structure)
A = 116k (27 Oct)
B = 98.710
C = 107.403 (retracement)
The retrace sits at 0.5.
The reciprocal extension is 2.0
The 2.0 extension lands exactly at the 21 Nov wick (~81k)
This is a perfect harmonic rotation.
(X → Z → A Extension)
X = 06 Oct high
Z = 18 Oct low
A = 27 Oct high
Fibonacci extension from X → Z → A:
1.618 extension = 80.544
It matches the 2.0 from the ABC structure
It matches the 0.886 retracement on the HTF
Three independent mathematical signals hitting the same level. This is extremely rare and confirms the 81k zone as a rotation completion.
4. Structure Break
Since the 10 Nov low:
4H is making higher highs & higher lows
The descending trendline from 11 Nov is broken
Trend shifted from controlled downtrend → early reversal
Structure now favors continuation upwards as long as higher lows hold
Interpretation:
Sellers who relied on the trendline no longer have control.
4.5 Intermarket Correlation: Why Bitcoin Dumped When ES Dumped
Another important factor:
Bitcoin dumped because ES dumped.
From 12 Nov → 21 Nov:
S&P500 (ES)
Dropped from 6900 → 6525
–5.43% correction
Bitcoin:
Dropped from 107k → 80.5k
–24.77% correction
BTC acted as a ~4.5× levered version of ES.
BTC acted as a ~4.5× levered version of ES.
Correlation Data:
Rolling BTC/ES correlation increased from 0.38 → 0.74
Meaning BTC traded almost in sync with equities during the selloff
Why?
Risk-Off Mechanics
When ES sells off:
Equity funds de-risk
Macro algos rotate out of high beta
Volatility spikes
Systematic funds reduce exposure
Crypto is treated as “high beta tech”
BTC amplifies the move by a factor of 3–5×
Bitcoin didn’t dump because crypto was weak — It dumped because macro markets were risk-off.
Why this matters now
ES has stabilized
BTC stopped following ES lower
Spot demand started rising
BTC/ES correlation is dropping again (from 0.78 → ~0.55)
USDT-M shorts didn’t adjust
This is exactly when short squeezes start on BTC:
Macro stabilizes
Crypto regains independence
Shorts remain positioned for risk-off
Spot buyers take control
Price accelerates upward
This is a classic intermarket correlation unwind.
5. USDT Dominance (USDT.D) Confirms Risk Rotation
USDT dominance has turned down, which means:
Traders are deploying capital
Less stablecoin sitting idle
More risk-on appetite
Historically aligns with BTC beginning new legs up after HTF rotations
When USDT.D falls at the same time spot CVD rises, the market is shifting capital into crypto.
6. Targets: 118.5k → 124k
These are the next liquidity magnets.
Target #1: 118.5k
Confluences with:
1.141 extension of the 11 Nov → 12 Nov move
First major liquidity pool
First real “decision point” for the market
Target #2: 124k
Confluences with:
A weak high that will be swept
1.618 extension of the same 11→12 Nov move
Natural squeeze exhaustion zone
Perfect location for a Swing Fail Pattern
Rotation Logic
Shallow retraces → larger extensions (1.618 → 2.0)
Deep retraces → smaller extensions (1.272 → 1.414)
BTC currently fits the shallow retrace profile → favors strong extension
7. Other Pivot Points
Marked on the chart:
Minor LVNs
Minor-imbalances
CME Gaps
Expect reaction at each point.
8. Invalidation & Bearish Pathway
My invalidation is clear:
Trading below 80k invalidates the squeeze setup.
Below 80k, the absorption breaks.
If 80k is lost, the downside extension levels become:
74k
70k
64k
These levels are:
The natural downside extension pathways from the 11 Nov → 21 Nov swing
They form the mirrored rotation of the bullish structure
Final View
We dumped because macro went risk-off
Bitcoin amplified the ES selloff
Shorts loaded heavily into the move
Spot buyers stepped in first
A clean absorption pattern formed
Mathematical rotation completed at ~81k
Structure flipped
Risk metrics like USDT.D turned down
Correlation with ES is now unwinding
If Bitcoin continues to hold above 80k and spot keeps leading, the squeeze toward 118.5k → 124k becomes the most likely path.
Abbreviation List
BTC – Bitcoin
ES – S&P500 E-Mini Futures
OI – Open Interest
CVD – Cumulative Volume Delta
USDT-M – Stablecoin-Margined Futures
BTC-M – Coin-Margined Futures
HTF – Higher Timeframe
LVN – Low Volume Node
AVWAP – Anchored Volume-Weighted Average Price
PRZ – Potential Reversal Zone
SFP – Swing Fail Pattern
Fib – Fibonacci
CTA – Commodity Trading Advisor (systematic trend-following funds)
VIX – Volatility Index
Beta – Sensitivity of an asset’s movement relative to a benchmark
Risk-Off – Market environment where investors reduce exposure to risky assets
Risk-On – Market environment where investors increase exposure to risky assets
-----
If you enjoy this type of deep, data-driven breakdown—spot vs futures, CVD flow, intermarket correlation, and rotation math—drop a like and leave a comment. It helps me see whether these higher-level analyses bring value, and it motivates me to keep sharing them for free.

TradeCityPro | Bitcoin Daily Analysis #235👋 Welcome to TradeCity Pro!
Let’s move on to the Bitcoin analysis. Today is Saturday, it’s the weekend, and market volume and volatility have dropped significantly.
⏳ 1-Hour Timeframe
The long trigger we had yesterday on Bitcoin was broken, but the market didn’t continue upward, instead, it turned into a fake breakout.
⚖️ The main resistance on Bitcoin remains 93,555, and the price didn’t reach this level. Sellers entered the market earlier than expected and took control before price could reach the resistance.
💫 After this fakeout and with the weekend arriving, trading volume has decreased sharply, the difference in volume before and after the fakeout is very noticeable.
🔭 This low volume has caused the price to slowly drift downward with a very weak slope, and it’s currently fluctuating around the 90,724 zone.
📊 Additionally, because volume is so low, the price is not reacting cleanly to levels and is not respecting them, which is normal when market depth decreases.
✅ At the moment, I don’t think the market is in a good condition to open new positions.
💡 The main resistance zone on Bitcoin is still 93,555, and breaking this level will turn the trend bullish.
✨ As long as the price is above 89,000, I do not consider the trend bearish, but this does not mean the market is bullish either.
🎲 Right now, Bitcoin has no clear trend, and for a new trend to form, we must wait for a confirmed breakout either above 93,555 or below 89,000.
❌ Disclaimer ❌
Trading futures is highly risky and dangerous. If you're not an expert, these triggers may not be suitable for you. You should first learn risk and capital management. You can also use the educational content from this channel.
Finally, these triggers reflect my personal opinions on price action, and the market may move completely against this analysis. So, do your own research before opening any position.

01/12/25 Weekly OutlookLast weeks high: $93,088.10
Last weeks low: $85,279.04
Midpoint: $89,183.57
A brutal start to the week for the bulls here. A -6% move to the downside as soon as the Month of December opens rejecting off the range weekly high. Across the high time frame this confirms a new lower high and a failure to get back within the trend that has stayed consistent throughout this bull market.
All of last weeks recovery bounce has been wiped out in a matter of hours, so now the question is where does the buy side pick up, if at all? FOMC interest rate decision is predicting another rate cut (80% probability) as well as the end of quantitative tightening and the beginning of quantitative easing on paper should bring more liquidity into risk-on markets such as Bitcoin, but that is on a longer timescale.
In the more immediate time frame I think the range broadly $80,000-$100,000 with this weeks range seeing a lot of the noisy PA. Midpoint is a key S/R level to gauge sentiment and conviction, a reclaim of the level may open the door to a stop loss hunt around weekly high but for now the momentum is definitely with the bears.

Gann has the answers! (This is NOT market manipulation) As seen in the Gann tool, price action needs to reposition itself
It resisted at the first curve (Arc1) then moved into the support line (Fan line 1/1)
This is standard behavior, NOT market manipulation

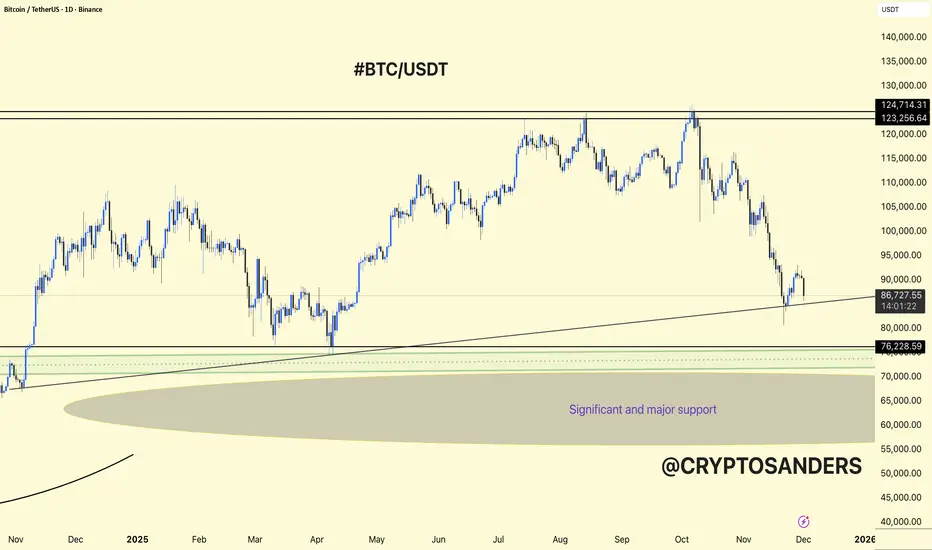
BTC/USDT 1DAY CHART UPDATE. BTCUSDT is in a corrective phase on the 1D chart, but it is still sitting above a major higher-timeframe support zone.
The chart shows a long-term ascending trendline from late 2024 to early 2025 that currently intersects just below the price, acting as dynamic support together with the horizontal 80k–82k area.
Below that, the wider “significant and major support” region lies roughly between 70k and 65k, which is the last strong demand block if 80k breaks.
Bullish case: Holding above the trendline and 80k–82k could form a higher low; from there BTCUSDT can attempt a recovery toward 95k–100k and eventually back to the 120k+ resistance, but it needs clear higher highs and higher lows on the daily to confirm.
Bearish case: A clean daily close below the trendline and 80k support opens room for a deeper flush into the 70k–65k major support zone, where a larger accumulation base may form before any new up‑leg.
DYOR | NFA
BITCOIN WILL HIT 80K !BTC can hit the seller at 100 - 104k and then crash to 80k again.
its not financial advice !

BTCUSDT.P - December 5, 2025Price is currently in a corrective pullback within a broader intraday up swing after rebounding from the lower support band around 86,600. The key immediate support sits near 91,800–92,000, with a tighter risk level just below 93,400, while the next significant resistance and projected target lies in the 105,000–106,000 region. A sustained higher low above current support with rising short‑term momentum would favor a continuation toward that upper resistance zone, whereas a break below support would open the way for a retest of the recent lows.

Trend Exhaustion: How to Spot a Reversal Before It HappensReversals rarely start with dramatic candles. They begin quietly, through subtle shifts in momentum and structure that most traders overlook.
A strong trend doesn’t collapse all at once. It loses strength in stages, and those stages are visible long before price turns in the opposite direction.
The first sign of exhaustion is weakening impulse strength. In a healthy trend, impulsive moves are clean and decisive, and retracements are controlled. When each new push produces smaller higher highs or lower lows, it signals reduced participation.
Buyers or sellers are still present, but the force driving the trend is fading.
The second clue lies in how price interacts with liquidity. Strong trends break key levels with conviction. Exhausted trends start reaching above highs or below lows only to reject immediately.
These sweeps show that the market is clearing liquidity without gaining follow-through, often trapping late entries and signaling that larger players are offloading positions.
A third indication appears when structure begins to fracture. An uptrend losing its higher-low sequence or a downtrend failing to maintain lower highs is a shift in narrative. A single break is not confirmation, but when it aligns with slowing impulses and liquidity failures, momentum is clearly changing.
Volatility then begins to compress. Candle ranges shrink, movement becomes less directional, and price enters a tightening pattern.
This compression often precedes expansion in the opposite direction. When a decisive candle breaks out of this cluster, the reversal typically accelerates.
Trend exhaustion is about recognizing when the conditions that supported continuation no longer exist.
By reading momentum, liquidity, and structure together, you can anticipate shifts earlier, manage risk more effectively, and position yourself on the right side of the next move.
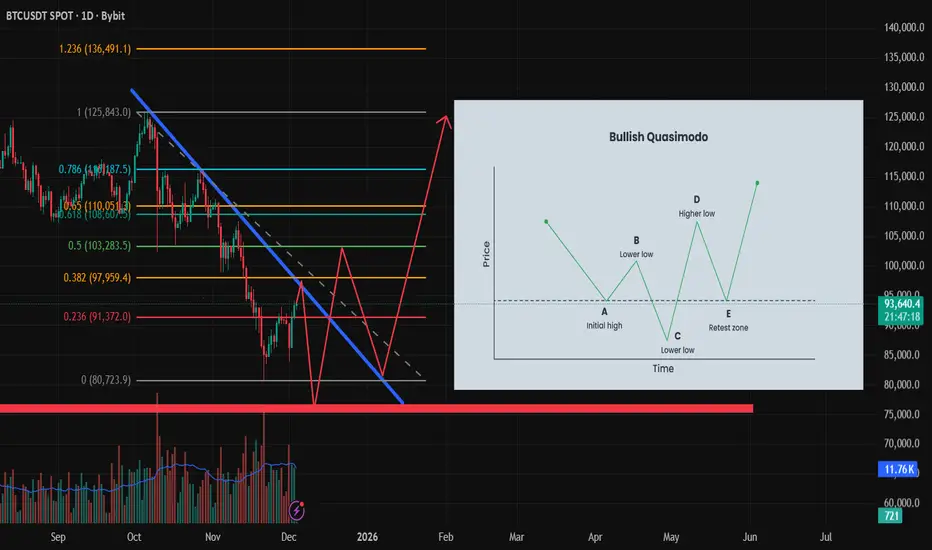
BTC Bullish Quasimodo Forming? Potential Reversal Setup 80k–125kBitcoin continues to trade below the macro descending trendline, respecting lower highs since the last major swing high. Price is currently around the 93k area, reacting to a minor resistance + Fibonacci cluster.
🔍 Why a Bullish Quasimodo Is Possible
A Bullish QM (Quasimodo) pattern forms when the market creates:
Initial High
Lower High
Lower Low (liquidity sweep)
Higher Low (retest zone)
Break of Structure to the upside
BTC appears to have formed steps 1 and 2, and may be setting up for a deeper sweep to complete the Lower Low around the major demand zone.
🧭 Projected Price Path
Short-term expectation (bearish liquidity sweep):
Possible rejection from the descending trendline
Decline toward 91,300 → 88k → 86k
Final liquidity sweep into ~80k, which aligns with a major demand zone and previous volume imbalance
Mid-term expectation (bullish reversal):
Strong bounce from the 80k zone
Formation of the Higher Low (QM retest zone)
Break above the descending trendline
Upside targets:
97,900
103,200
108,000
125,000+ (Fibonacci extension target)
🎯 Bias Summary
Short-term: Neutral to bearish (liquidity sweep expected)
Mid-term: Bullish reversal if QM structure completes and price forms a Higher Low
⚠️ Invalidation
A clean daily close below 78,500 invalidates the Bullish QM scenario.
Possible Bitcoin Scenarios for the Week AheadPossible Bitcoin Scenarios for the Week Ahead
More Details on the Chart.
Considering the Federal Reserve's interest rate decisions in the next few days, a trend change is possible

104k Moonshot or Brutal 96k Rejection? Bitcoin’s Final Bull TrapFriends, Bitcoin has played out exactly as outlined in my previous idea.
As I mentioned last time, that drop could have either been:
1. The start of a deeper bearish continuation after a minor correction, or
2. Wave B of a larger ABC correction — in which case BTC had to reclaim above 93k.
The chart has confirmed the second option — it was wave B.
Therefore, we are now building wave C upwards, and Bitcoin has already broken above 93k.
On the current chart I still have two active scenarios:
🟠 Orange arrow scenario:
A quick push toward ~96k followed by a reversal and drop back to the recent lows.
In this case, the entire three-wave move we’ve seen so far could become wave A of a larger corrective structure.
🟢 Green arrow scenario (my preferred one for now):
Continuation higher to the 102–104k zone, completing wave C of this correction, and only AFTER that we finally update the recent lows.
My ultimate downside target remains 60k and below, but first let’s see which path Bitcoin chooses in the coming days.
Which scenario do you think will play out — orange or green?
Drop your thoughts in the comments! 👇
Like, comment, follow if you find this helpful — really appreciate your feedback and reactions! 🚀

BTC(based on NEo wave)this is not a trend-impulse...it is terminal and if it hit the limitation of wave 4 its a natural triangle and its not wave C of a flat.

#bTC#BTCUSDT support (green) and resistance (red) areas and dynamic resistances (red) are indicated for investing or trading in cryptocurrencies.
#CRYPTO
#BTC

BTCUSDT Short-term bullish trend: Target - $94KTread with Caution with the market lacking volatility and the upcoming FOMC meeting. Use Stop Loss wisely.
The 15 min chart shows a triangle formation ready for a breakout with a potential target of $94K.
The 4hr chart shows a double bottom formation with a potential target also around $94K.
The previous FVG on the 4-hour chart also sits between the 94K-95K zone.
The market structure shows an uptrend with higher highs and lower lows recently and the prices sitting above the 20EMA.
The RSI and MACD are also trending upwards on the Daily, 4hr and 15min, indicating (for the moment) bullish trend.
Overall, gives enough data points to suggest a temporary uptick to $94K range.
As always, trade with strong risk management and adapt with the market direction.


BTC - Bulls Watching the Channel Support!📈Bitcoin remains overall bullish, trading cleanly inside its rising channel. Each dip toward the lower bound has acted as a strong springboard for the next impulsive move, showing clear demand from buyers.
⚔️As BTC approaches the lower trendline of the channel and the green demand zone, we will be looking for trend-following longs. This confluence area has held multiple times and continues to act as a key decision point for market structure.
🏹As long as BTC remains above this zone , the bullish scenario remains intact, and another push toward higher highs becomes the most likely outcome. Only a break below the demand zone would weaken the bullish outlook.
Now it’s all about the retest… will the bulls defend structure once again? 🤔
⚠️ Disclaimer: This is not financial advice. Always do your own research and manage risk properly.
📚 Stick to your trading plan regarding entries, risk, and management.
Good luck! 🍀
All Strategies Are Good; If Managed Properly!
~Richard Nasr
