BTC ATH Drawdown had been long overdue for a correctionIf we measure the time when ATH drawdown was at at the top for the past cycles, we average around 50 bars, with the previous cycle spanning 57 bars. While it makes sense that new cycles may experience longer bull-runs with increased societal acceptance and institutional stability in play, BTC spanne
BBB
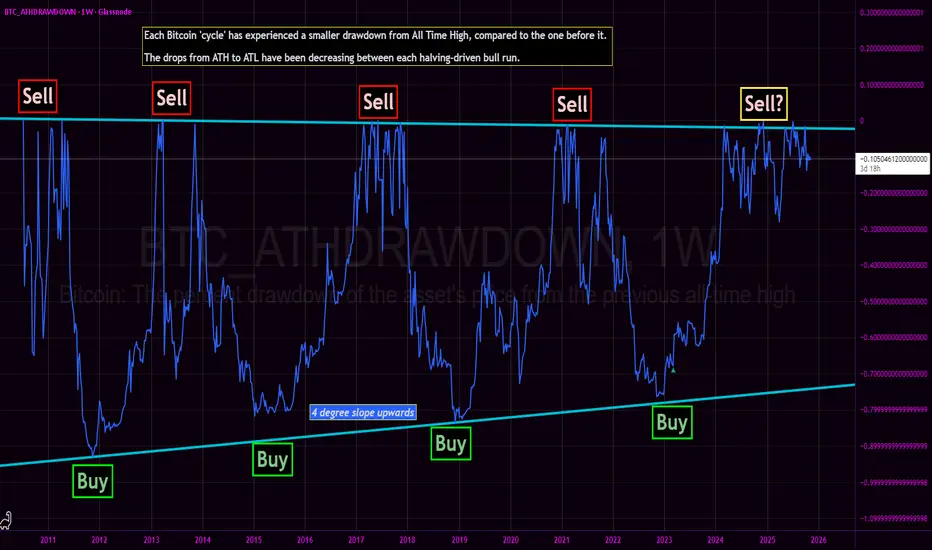
Bitcoin: The percent drawdown of the asset's price from the previous all-time high
No trades

Bitcoin: What Historical Drawdown in a Bear Market?Since its all-time high at $126,000 reached on October 6, Bitcoin has been following a series of corrective sessions. This pullback raises a key question: is it merely a consolidation within a bull market, or the beginning of a true bear market?
First, if the cycle really ended on Monday, October 6

Bitcoin All Time High Drawdown - Bottom nowhere in sight?We revisit the Bitcoin All Time High Drawdown chart originally published in March 2023.
The core thesis of the BTC_ATHDRAWDOWN chart remains intact: each subsequent market cycle has exhibited a diminishing drawdown from its prior All-Time High, with generational cycle bottoms resting squarely on
BTC ATH DRAWDOWN 260k 2026 we are Long!Hello TradingView community! Today, I want to share a comprehensive analysis of this BTC chart with you, which shows a strong long-term bullish perspective with a target of 260k by 2026. The chart spans from 2011 to 2033, providing both historical context and forward-looking projections based on tec

BTC Possible Top Is InThe combination of bearish divergence on the monthly RSI and MACD strengthens the argument that Bitcoin's current top could be in. These indicators suggest weakening momentum despite higher prices, a classic precursor to market tops. However, traders should keep an eye on confirmation signals, such

This Bitcoin Dump Is Normal - But For How Long?In this analysis I want to take a look at the BTC_ATHDRAWDOWN indicator, which tells us how much percent BTC is trading under the current all-time high. Every time that BTC makes a new all-time high this indicator reaches a value of 1.
As seen on the chart, BTC has seen a lot of big drops during bu

🔥 Bitcoin On-Chain: Completely Normal Correction!In this analysis we talk more about yesterday's analysis where I discussed the completely normal correction that BTC has been seeing. Furthermore, chances are that we will see more of those correction in the coming months.
As seen on the chart, Bitcoin sees multiple deep corrections (>20%) during

Bitcoin All Time High Drawdown - Bottom has been in.This chart shows the amount price has dropped from all time high to all time low during each bitcoin market 'cycle'. Each cycle's price action obviously being fueled by Bitcoin's Proof of Work Halving.
As you can seek, the bottom trendline (market bottoms) shows a 4 degree slope upwards, with th


See all ideas
Displays a symbol's price movements over previous years to identify recurring trends.