Bitcoin: What Historical Drawdown in a Bear Market?Since its all-time high at $126,000 reached on October 6, Bitcoin has been following a series of corrective sessions. This pullback raises a key question: is it merely a consolidation within a bull market, or the beginning of a true bear market?
First, if the cycle really ended on Monday, October 6, this would still align with the classic 4-year timing cycle, with a duration that fits within the multi-criteria average (see my correspondence table below) of previous cycles.
At this stage, the downtrend is not confirmed, as key supports — notably the weekly Ichimoku cloud — have not been broken. This level marks the decisive boundary between a standard cycle correction and a deeper reversal.
As long as the price remains above the Kumo, the bull cycle that began in 2022 remains structurally valid. Historically, Bitcoin only enters a bear market when weekly candles close below the cloud, along with the chikou also falling below price. Such a configuration would signal a durable deterioration in momentum for the coming months.
If this zone were to give way, then shifting to a full bear-market framework would become relevant. To estimate a potential bottom, the most useful tool remains the drawdown indicator from ATHs, which measures the percentage decline from the previous all-time high. The chart clearly shows a long-term trend: drawdown bottoms form along a rising diagonal since 2011, while the intensity of declines gradually decreases cycle after cycle.
Historical numbers confirm this:
• 2011: –93%
• 2015: –86%
• 2018: –84%
• 2022: –77%
This gradual reduction reflects market maturation and increasing market capitalization. Extrapolating this trend places the theoretical next trough between –70% and –76%. This is also the zone highlighted on the chart as long-term historical support.
Applying these percentages to the $126,000 peak yields:
• –50% → $63,000
• –65% → $45,000
• –70% → $37,800
• –73% → $34,000
• –76% → $30,200
These levels therefore form a probable bottom range in the still-unconfirmed scenario of a bear market. They also correspond to major technical zones frequently observed at cycle junctions.
Finally, the average duration of Bitcoin bear markets — traditionally around 12 months — suggests a theoretical bottom around late 2026, if the October 2025 top were indeed a cycle peak.
In summary:
We are not in a bear market as long as major technical supports hold. The market is now clearly at a technical crossroads. But if a breakdown occurs, historical drawdown patterns suggest a statistical bottom between $40,000 and $60,000, within a timeframe of roughly one year.
DISCLAIMER:
This content is intended for individuals who are familiar with financial markets and instruments and is for information purposes only. The presented idea (including market commentary, market data and observations) is not a work product of any research department of Swissquote or its affiliates. This material is intended to highlight market action and does not constitute investment, legal or tax advice. If you are a retail investor or lack experience in trading complex financial products, it is advisable to seek professional advice from licensed advisor before making any financial decisions.
This content is not intended to manipulate the market or encourage any specific financial behavior.
Swissquote makes no representation or warranty as to the quality, completeness, accuracy, comprehensiveness or non-infringement of such content. The views expressed are those of the consultant and are provided for educational purposes only. Any information provided relating to a product or market should not be construed as recommending an investment strategy or transaction. Past performance is not a guarantee of future results.
Swissquote and its employees and representatives shall in no event be held liable for any damages or losses arising directly or indirectly from decisions made on the basis of this content.
The use of any third-party brands or trademarks is for information only and does not imply endorsement by Swissquote, or that the trademark owner has authorised Swissquote to promote its products or services.
Swissquote is the marketing brand for the activities of Swissquote Bank Ltd (Switzerland) regulated by FINMA, Swissquote Capital Markets Limited regulated by CySEC (Cyprus), Swissquote Bank Europe SA (Luxembourg) regulated by the CSSF, Swissquote Ltd (UK) regulated by the FCA, Swissquote Financial Services (Malta) Ltd regulated by the Malta Financial Services Authority, Swissquote MEA Ltd. (UAE) regulated by the Dubai Financial Services Authority, Swissquote Pte Ltd (Singapore) regulated by the Monetary Authority of Singapore, Swissquote Asia Limited (Hong Kong) licensed by the Hong Kong Securities and Futures Commission (SFC) and Swissquote South Africa (Pty) Ltd supervised by the FSCA.
Products and services of Swissquote are only intended for those permitted to receive them under local law.
All investments carry a degree of risk. The risk of loss in trading or holding financial instruments can be substantial. The value of financial instruments, including but not limited to stocks, bonds, cryptocurrencies, and other assets, can fluctuate both upwards and downwards. There is a significant risk of financial loss when buying, selling, holding, staking, or investing in these instruments. SQBE makes no recommendations regarding any specific investment, transaction, or the use of any particular investment strategy.
CFDs are complex instruments and come with a high risk of losing money rapidly due to leverage. The vast majority of retail client accounts suffer capital losses when trading in CFDs. You should consider whether you understand how CFDs work and whether you can afford to take the high risk of losing your money.
Digital Assets are unregulated in most countries and consumer protection rules may not apply. As highly volatile speculative investments, Digital Assets are not suitable for investors without a high-risk tolerance. Make sure you understand each Digital Asset before you trade.
Cryptocurrencies are not considered legal tender in some jurisdictions and are subject to regulatory uncertainties.
The use of Internet-based systems can involve high risks, including, but not limited to, fraud, cyber-attacks, network and communication failures, as well as identity theft and phishing attacks related to crypto-assets.
BBB
Bitcoin: The percent drawdown of the asset's price from the previous all-time high
No trades
Trade ideas

Bitcoin All Time High Drawdown - Bottom nowhere in sight?We revisit the Bitcoin All Time High Drawdown chart originally published in March 2023.
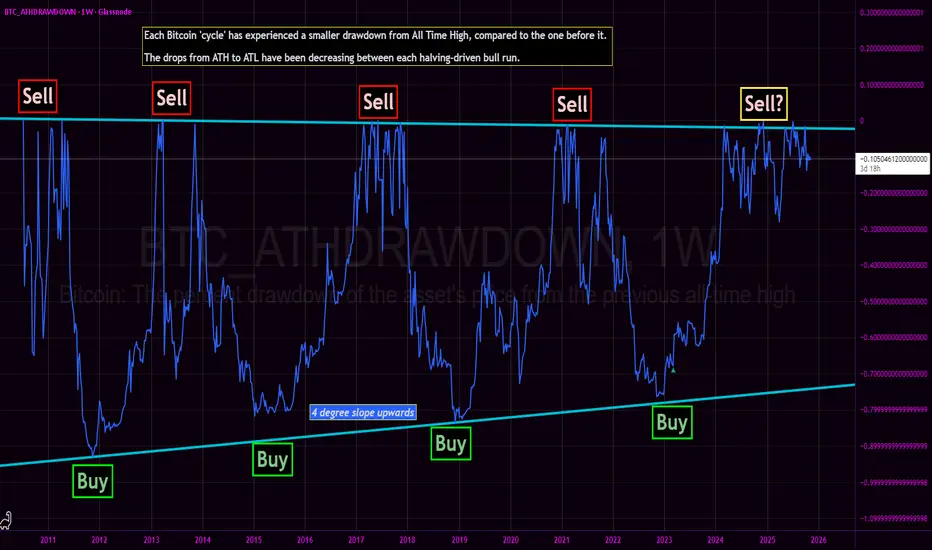
The core thesis of the BTC_ATHDRAWDOWN chart remains intact: each subsequent market cycle has exhibited a diminishing drawdown from its prior All-Time High, with generational cycle bottoms resting squarely on a discernible upward-sloping diagonal support (the 'Buy' line). The 2022-2023 bear market bottomed perfectly on this structural trendline, confirming the '4 degree slope upwards' trend.
Current Cycle Progress: The Sawtooth Fractal
Following the decisive breakthrough of the 2021 All-Time High, price action has entered an unprecedented and structurally complex phase. We are currently witnessing a prolonged high-frequency sawtooth waveform of continuous All-Time Highs.
This action represents the longest sawtooth fractal near ATH of any cycle prior.
This is a stark deviation from the swift, parabolic ascents that characterized previous blow-off tops:
Contrasting the 2017 Pattern: The 2017 bull run culminated in a sharp, almost vertical run-up to $20,000, immediately followed by a steep and rapid crash. That was a classic V-top.
The 2024/2025 Pattern: Instead of a quick V-top, the market is engaged in an extended, messy distribution/consolidation phase right at the very peak. The continuous setting of new, marginal ATHs followed by sharp, shallow pullbacks creates a dense, high-frequency signal in the ATH Drawdown chart.
This structural evolution—a prolonged struggle to hold and marginally exceed previous peaks—suggests that the market is either building a much larger, more resilient base for an extended super-cycle, or undergoing a slow, drawn-out distribution that fundamentally alters the historical BTC cycle cadence.
This is not financial advice, and presented merely as conjectural musing.
BTC ATH DRAWDOWN 260k 2026 we are Long!Hello TradingView community! Today, I want to share a comprehensive analysis of this BTC chart with you, which shows a strong long-term bullish perspective with a target of 260k by 2026. The chart spans from 2011 to 2033, providing both historical context and forward-looking projections based on technical analysis.
Current Situation and Market Data
Currently, BTC is trading at around 85k, and according to market data from BlackRock analysts, there is potential for the market to develop up to 260k by 2026. This aligns perfectly with the chart’s annotations, which highlight key price levels and timeframes.
Chart Highlights
Long-Term Trend: A "LONG" trendline, guiding the price upwards since 2011, shows the ongoing bullish direction. Along this line, short-term highs are projected at 73k and 96k by 2026, followed by a potential consolidation range between 90k and 150k before reaching the 260k target by 2026.
Historical Data: Significant highs at 69k and 73k are marked as "SHORT," indicating short-term peaks, while the overall trend remains upward.
Future Projections: Beyond 2026, a further target of 440k by 2029 is anticipated, underscoring the long-term growth expectation.
Technical Indicators
RSI (14): The RSI is at 42.77, indicating a neutral to slightly oversold market condition. This suggests there is still room for growth before overbought conditions are reached.
MACD: With a value of -0.02, the MACD shows slight bearish momentum, which can be interpreted as a temporary correction within the context of the long-term uptrend.
BTC ATHDRAWN (Glassnode): The indicator stands at -0.23, meaning the price is 23% below its all-time high. Historically, such drawdowns have often preceded strong recoveries, supporting the bullish thesis.
Conclusion
Both the technical analysis of the chart and BlackRock’s market assessments suggest that BTC has significant upside potential. If you’re considering a long position, the 260k target by 2026 could be a strategic choice, especially if short-term indicators signal a trend reversal.
What do you think? Do you believe BTC can reach 260k by 2026? What catalysts or risks do you see? Let’s discuss in the comments! 💬

BTC Possible Top Is InThe combination of bearish divergence on the monthly RSI and MACD strengthens the argument that Bitcoin's current top could be in. These indicators suggest weakening momentum despite higher prices, a classic precursor to market tops. However, traders should keep an eye on confirmation signals, such as key monthly average at 77k, and consider broader market conditions to contextualize the technical signals.
My monthly upper deviation top remain at 108k.

This Bitcoin Dump Is Normal - But For How Long?In this analysis I want to take a look at the BTC_ATHDRAWDOWN indicator, which tells us how much percent BTC is trading under the current all-time high. Every time that BTC makes a new all-time high this indicator reaches a value of 1.
As seen on the chart, BTC has seen a lot of big drops during bull-markets. Most of these drops have reached the yellow area (which reaches from -20% to -27%). This is "normal" and not something we have to worry about.
What we have to worry about is when BTC goes from 1 to something below 0.27. Historically, this as signaled that either the cycle is over or that we're in for a prolonged period of bearish price action.
Like I mentioned in my previous analyses, bulls have to start buying again in the very near future. If BTC continues bleeding like it does now there's a high probability of dropping even more.

🔥 Bitcoin On-Chain: Completely Normal Correction!In this analysis we talk more about yesterday's analysis where I discussed the completely normal correction that BTC has been seeing. Furthermore, chances are that we will see more of those correction in the coming months.
As seen on the chart, Bitcoin sees multiple deep corrections (>20%) during bull-cycles. Sometimes they are less excessive, but >20% is generally the bottom.
Currently, BTC is trading around 11% from the ATH. It's not great, but looking at previous bull-cycles it can certainly get much worse.
For now, there's not a real reason for the bulls to worry. Yes, BTC is not really doing great at the moment, but did we really expect a move from 40k > 100k without any corrections?
Patience will reward you.

Bitcoin All Time High Drawdown - Bottom has been in.This chart shows the amount price has dropped from all time high to all time low during each bitcoin market 'cycle'. Each cycle's price action obviously being fueled by Bitcoin's Proof of Work Halving.
As you can seek, the bottom trendline (market bottoms) shows a 4 degree slope upwards, with the top trendline (market tops) having a slight slope downwards.
Both signify a reduction of percentage dropped in price from cycle All Time High.
In short (heh), what I mean to say is: a decade of data points are showing that this is a great area to be loading up for the next crypto bull run. Don't let the market FUD cloud your vision.
Stay savvy.
As always, this is not financial advice.


