AMD BearishOn the 1-hour chart, AMD has formed a bearish triangle pattern, suggesting potential short-term pullback pressure. However, the broader uptrend remains intact, with long-term momentum still favoring the bulls.
Trade ideas

AMD: entering mid-term resistance levelNASDAQ:AMD price followed through from the support zone into the important mid-term resistance outlined in the October updates.
One of the strongest structures and setups on the market. And while there’s still potential for a move into the higher resistance area at 260–277, I expect selling pressure to start building over the next few weeks, leading to a pullback and potential consolidation phase.
Breaking out above 277 will force me to reconsider the trend suggested trend structure.
Chart:
Previously:
• On resistance zone (Oct 13):
• Upside potential (Oct 7):
see in weekly review
Previously this year:
• On macro resistance (Jul 29):
• On resistance & bounce potential (Aug 6):
• On macro bottoming potential (Apr 25):

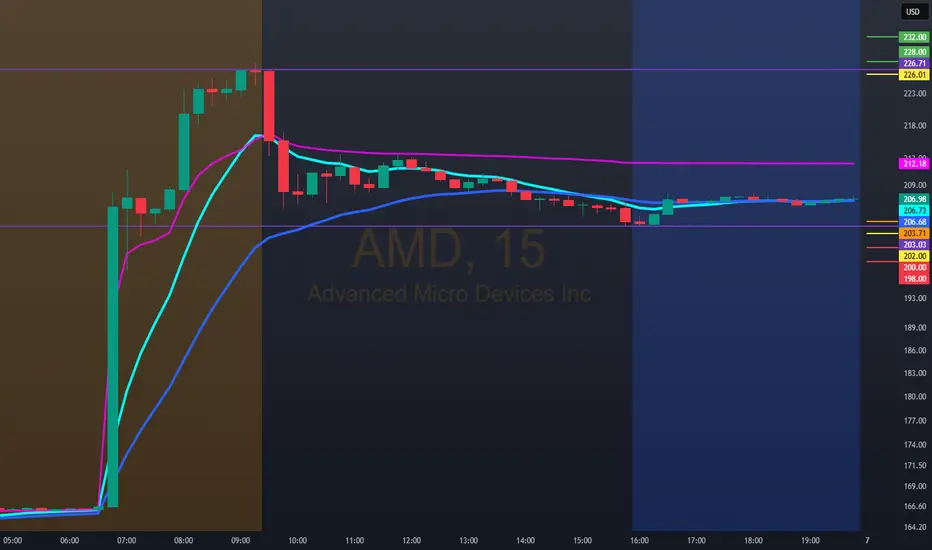
ello trade, this happened today with AMD: 234.56.www.tradingview.com
As planned, the bearish entries reached 232.00/230.00.
Taking an ORB entry with a 5m candle, we had a quick exit in the 228.50 area. The price fell back to the pre-market area and then fell back to the same area, finding buyers again.
A very difficult week with a very indecisive and highly manipulated market.

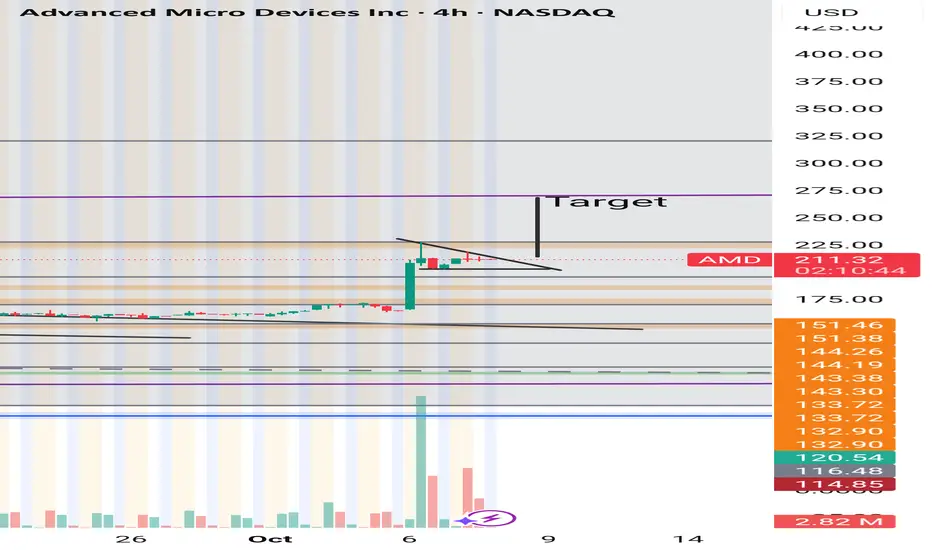
Be careful with AMD!!! Likely reason for the target increase: Rapid growth in the field of artificial intelligence and strong demand for advanced chips, especially in competition with Nvidia.
So if you pay attention to the AMD chart you can see that the price has formed a Ascending Pennant which means it is expected to price move as equal as the measured price movement.( AB=CD )
NOTE: wait for break of the FLAG .

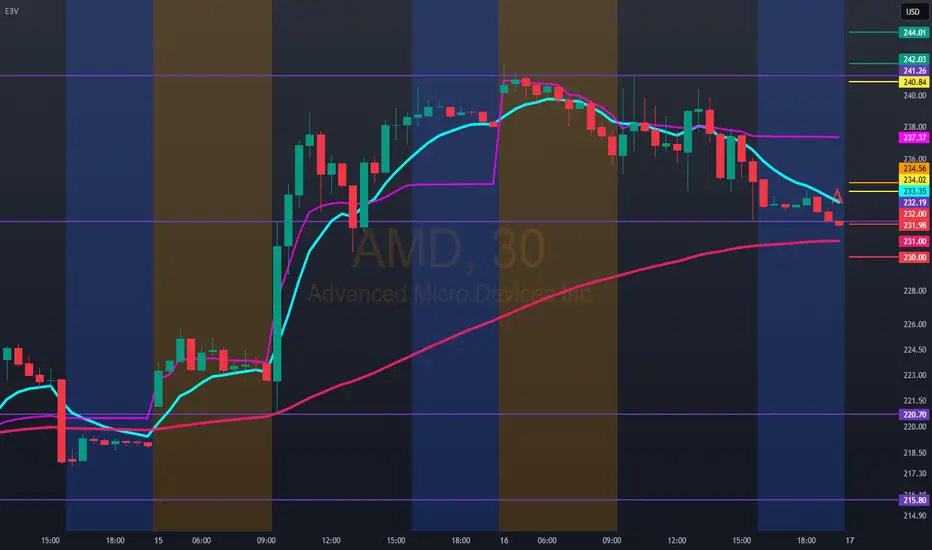
Hello trader, for tomorrow 10/17/25 AMD: 234.56In recent days, the market has been indecisive, making trading more complicated than it is.
A quick initial bullish entry would be above 234.00 to 240.00. If there is a bearish rejection at 240.00, we could have another bullish entry above 242.00/244.00.
Bearish entry below 231.00/230.00 for added security if the market favors us.
AMD Friday Setup – Oct. 17Bulls Guard the Trend Channel as Gamma Tightens Near $233 ⚡️”
📊 Multi-Timeframe Breakdown
🕒 1. Daily Chart – Macro Structure (“The Why”)
AMD remains one of the cleanest momentum structures among large-cap semis. The broader uptrend channel from May is still intact, with price trading near the midline between $225 and $245.
Despite Thursday’s 1.6% dip, AMD’s daily structure shows no breakdown — just a healthy retest of support within the rising parallel channel.
MACD remains strongly bullish, though the histogram is flattening — a sign of short-term consolidation after an extended run. Stoch RSI is cooling from overbought territory, suggesting buyers are taking a breather before potentially resuming control.
Macro Bias: Bullish continuation unless price closes below $225, where the lower channel and 21EMA converge.
Key Levels:
* Support: $225 → $218 → $207
* Resistance: $244 → $250 → $260
⏰ 2. 1-Hour Chart – Active Market Structure (“The Setup”)
The 1-hour chart highlights a short-term CHoCH after AMD’s run toward $244, now retracing toward intraday support at $232–$234.
The stock has respected its ascending intraday trendline drawn from the $210 base, with structure still forming higher lows despite minor pullbacks.
MACD is cooling from a high momentum phase but remains above zero, suggesting a pause — not a reversal. Stoch RSI is dipping into the lower range, which could reset for a new push if buyers defend $232.
If AMD holds above the HVL ($233) zone, it may build a base for a renewed breakout toward $238–$244 by Friday’s session close.
Key Levels:
* Support: $233 → $230 → $225
* Resistance: $238.5 → $241.9 → $244.0
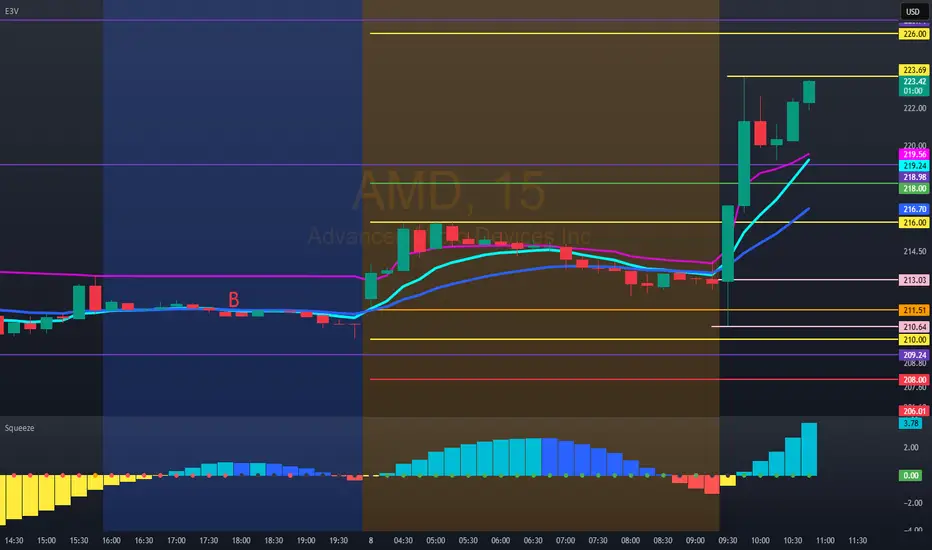
💹 3. 15-Min Chart – Intraday Execution (“The How”)
AMD’s 15-min structure shows a clear CHoCH → BOS sequence during Thursday’s session, followed by a descending wedge correction — a potential bullish reversal setup if momentum shifts early Friday.
The MACD histogram has compressed tightly near zero, while Stoch RSI is curling up from oversold levels — early hints of reversal behavior.
The 15M structure is well aligned with the 1H support at $232. A reclaim above $235 with volume could confirm a short-term bullish reversal into the mid-$240s.
Scalp Play Idea:
* Bullish Setup: Enter above $235, target $238.5 → $241.5, stop below $232
* Bearish Setup: Break below $231.5, target $227.5 → $225, stop above $234.5
📈 4. GEX (Gamma Exposure) Chart – Dealer Positioning (“The Fuel”)
Friday’s gamma map shows heavy dealer concentration near $233–$238, which explains AMD’s tight compression zone.
* Highest Positive GEX / Call Resistance: $240–$245
* Put Support: $225 → $215
* Gamma Flip Pivot: $233 (current HVL)
* IVR 65 | IVx avg 74.7 | Call Flow 41.4%
Dealers are slightly short gamma around the current price, suggesting potential volatility expansion if AMD breaks out of the $230–$238 box.
A move above $238 could trigger dealer hedging upward — accelerating toward $244 — while a sustained break under $230 opens downside gamma to $225.
🎯 Final Outlook
AMD’s Friday setup leans constructive despite the intraday pullback. As long as $232–$233 holds, bulls maintain control within the ascending channel.
If price reclaims $235+ early in the session with momentum confirmation, expect continuation toward $238–$244, possibly tagging the upper gamma wall before weekly expiry.
However, losing $230 with volume could drag AMD into the $225 liquidity pocket — still within the macro bullish structure but offering a reset opportunity for next week’s rebound.
Watch for a liquidity sweep under $232 followed by a reclaim — that’s the ideal Friday scalp trigger for intraday longs.
Disclaimer:
This analysis is for educational purposes only and not financial advice. Always manage risk and follow your plan.

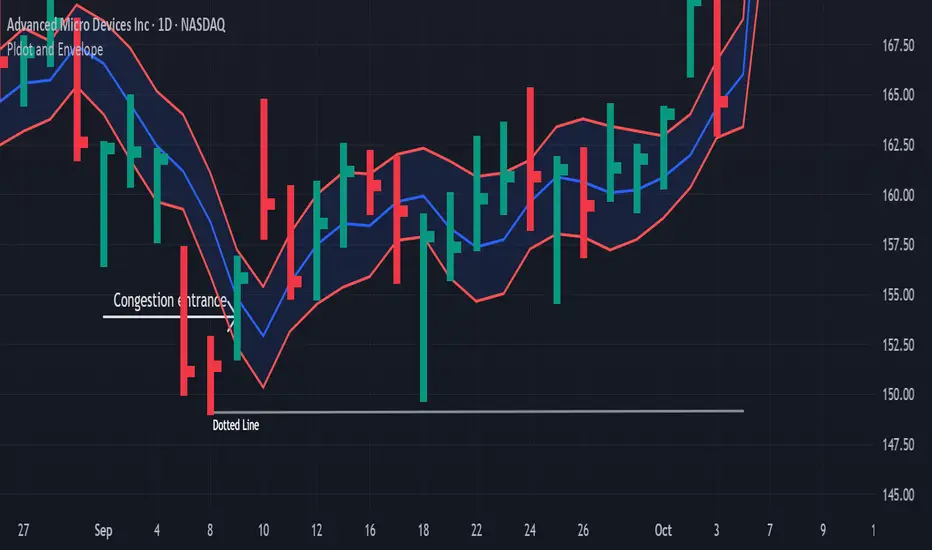
DG -How the Dotted Line Sets Up🔹 Definition
The Dotted Line marks the termination of a prior trend.
It’s drawn at the highest high of an uptrend or the lowest low of a downtrend.
Together with the Block Level , it defines the outer edge of congestion — where trend energy has been spent and the market is preparing to shift direction.
When the dotted line begins to appear, it signals that momentum is fading and buyers or sellers are losing control .
⚙️ How the Dotted Line Sets Up
A dotted line setup develops through a series of termination events — signs that price can no longer advance in the direction of the trend.
Multiple 5-9 terminations begin holding on close.
This clustering shows price repeatedly failing to continue.
After 5-9s, a 5-2 termination starts to hold — often from one or two bars back.
If no 5-2s are visible, a 5-1 termination may take over, often combined with a 1-1 zone for added resistance or support.
A 6-1 termination then confirms the exhaustion phase.
Any existing c-wave (momentum thrust) will stop immediately — energy has run its course.
The envelope confines (top or bottom) begin to hold against the trend. This marks the containment of price movement.
If price reaches a further-out area , it typically converts to a nearby zone on the next bar — energy compresses inward.
The setup is confirmed only when the nearby support or resistance holds .
⚖️ Nearby Support and Resistance
“Nearby” zones are the areas of immediate price engagement — where short-term pressure builds and releases.
They are formed from:
PL Dot or Live PL Dot
1-1 zones
5-9, 5-2, 5-1, 6-1 terminations
Envelope borders and main channel lines
Interpretation Guide :
If Close > Envelope Top → nearby support lies between the Envelope Top and PL Dot.
If Close < Envelope Bottom → nearby resistance lies between the Envelope Bottom and PL Dot.
When price is inside the envelope , the PL Dot serves as the market’s balance point.
🧩 Summary
The Dotted Line marks the end of a move — a termination zone , not a breakout.
When it forms:
Terminations (5-9 → 5-2 → 5-1 → 6-1) appear in sequence.
The c-wave loses strength.
The envelope contains price.
Nearby levels begin to hold.
This is where trend energy fades and the next structure begins —
a pause, reversal, or new congestion phase .
Advanced Micro Devices Stock Broke Out of a Bullish Flag TodayThe price of Advanced Micro Devices, Inc. (NASDAQ: NASDAQ:AMD ) has broken out of a falling wedge pattern gaining roughly 9% today. With the daily price chart showing a golden cross pattern the stock is poised to reach the $270 pivot and beyond amidst growing interest.
The surge reflects recent optimism about AMD’s expanding role in the AI chip market, fueled by new partnerships, including a significant deal to supply chips to Oracle’s cloud infrastructure and collaborations with AI leaders like OpenAI.
Moreover, the investors’ confidence is also boosted by recent positive commentary by analysts, who also raised their price targets on AMD stock.
About Advanced Micro Devices, Inc.
It operates in three segments: Data Center, Client and Gaming, and Embedded. The company offers artificial intelligence (AI) accelerators, x86 microprocessors, and graphics processing units (GPUs) as standalone devices or as incorporated into accelerated processing units, chipsets, and data center and professional GPUs; and embedded processors and semi-custom system-on-chip (SoC) products, microprocessor and SoC development services and technology, data processing units, field programmable gate arrays (FPGA), system on modules, smart network interface cards, and adaptive SoC products.
AMD short term bullish. Price is expected to have sought its SSL and Receiving nice reaction from Previous Bull POI which was that Bullish Breaker and thus Seeking new Price discovery for short term.
Thus it is very good chance that Price will visit that Bearish Breaker first in next few weeks.
DYOR. This isn't a financial advice. This is just educational and speculative idea.
Your gains or losses are your own responsbility.
If you like this idea, please give it a thumbs up.

AMD update (most profitable trade of my life)AMD pumped, I got lucky. I hit my profit target of 200 immediately on the move. I was able to secure about $40,000 by selling all my $200 leaps and all but one of my $ 150s. I will keep my shares and my 150 LEAP to exercise in the future. We note a significant move deep into the weekly supply zone; we also did not dip into a recent demand zone. I am not sure we will, but that gap looms. The only way we don't close back down below is if their earnings report is absolutely stellar, which is definitely possible.
My plan:
I secured significantly more profits more quickly than I imagined, and I still have good exposure. I might be interested in some cash-secured puts or more shares around $202. In summary, daily slightly bearish, weekly bullish.

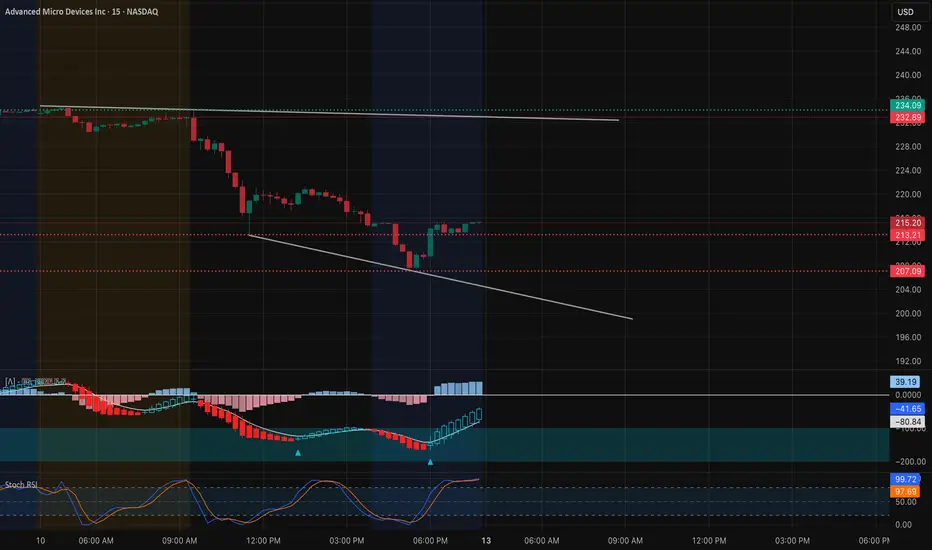
AMD Oversold But Not Broken: Watch for a Sharp Revers (Oct. 13)AMD Oversold But Not Broken: Watch This Level for a Sharp Reversal (Oct. 13)
Friday’s selloff hit AMD hard — the stock dropped nearly 8%, closing around 215, as volatility ripped through the entire semiconductor sector. But despite the pain, there are early signs that AMD may be setting up for an intraday bounce if market fear cools off on Monday.
Let’s break it down from both a 15-minute intraday view and the 1-hour GEX setup, which shows how options positioning could guide AMD’s next move.
15-Minute Intraday Technical View
The 15-minute chart shows a clear downtrend channel, with AMD printing a series of lower highs and lower lows since the breakdown from the 232–234 resistance zone. The most recent candle sequence suggests the sell momentum is finally slowing down — notice how the last few candles consolidated above 213, forming a short-term base.
MACD is still negative but starting to flatten, while Stoch RSI is climbing out of oversold territory near 25–30. That combination signals momentum exhaustion — not yet a reversal, but a warning that sellers might be running out of steam.
The key support zone to watch is 207–213, and this is where buyers are likely to defend early Monday. If AMD holds above this level at the open, there’s potential for a relief move back toward 218–222, which aligns with the descending trendline.
If that resistance breaks intraday with volume, momentum scalpers could target a quick run toward 228–230.
However, if AMD rejects at 218 and fails to hold 213, the next flush target is 207, and below that, a deeper slide toward 200 could unfold fast — especially if VIX spikes back above 22.
For intraday traders, the plan is simple:
Stay flexible.
Go long above 218 with confirmation, and short below 213 only if volatility expands again.
1-Hour GEX Analysis — Options Sentiment
The 1-hour GEX chart gives us a broader view of where the real positioning battle is happening.
The Highest Volatility Line (HVL) sits near 217.5, marking the current inflection zone — exactly where AMD closed Friday. Below that, we can see multiple Put Walls stacking around 205 and 200, creating a strong cluster of downside hedges. This suggests dealers will start selling aggressively if price drops below 207, amplifying volatility.
Above current levels, the Call Walls cluster around 230, 240, and 245, with the strongest resistance near 244, which lines up perfectly with the previous high. That’s the upper ceiling for now — no easy breakout without a broader market shift.
IVR sits at 58.2 and IVX at 69.6, showing volatility remains elevated but not at extremes. Option flow leans slightly bearish (27.9% CALLS vs higher PUT pressure), reflecting trader caution after the massive sector-wide pullback.
From a gamma standpoint, AMD is still in a negative gamma zone under 217. That means price will likely move fast — both up and down — as dealers chase hedges. Once AMD breaks back above 220 and sustains it, volatility could start to compress, giving bulls room to breathe again.
My Thoughts and Trade Ideas
AMD is sitting in a dangerous but attractive zone — a spot where risk/reward finally starts to favor traders who are patient. The 213–207 range is a legitimate support area where smart money might start scaling in.
If volatility cools off Monday and SPY finds footing, AMD could lead the rebound among semiconductors.
Scalpers can look for long setups above 218 with tight stops below 213.
For options traders, short-term 220C or 225C plays for the week are fine if the market stabilizes. If not, 205P or 200P becomes the defensive hedge to ride the next volatility leg.
The sentiment right now is fragile but ripe for fast moves — AMD is one of those names that reacts instantly to shifts in fear and greed.
Final Take
AMD remains bearish short-term but may be approaching exhaustion. The market’s behavior around 217.5 will decide Monday’s tone — either we see the first meaningful bounce, or volatility takes it down for one more leg to 205.
If VIX stays hot above 21, patience is key. But if the market breathes, AMD could surprise everyone with a sharp rebound.
Disclaimer: This analysis is for educational purposes only and not financial advice. Always do your own research and trade responsibly.
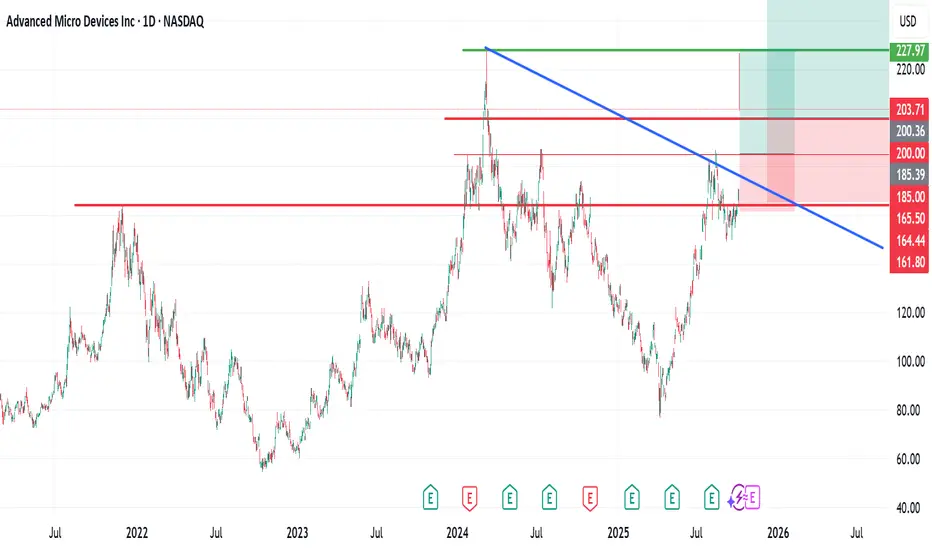
AMD OCT - 2025AMD rejected at the 227–230 supply (“TOP”) after a vertical run, signaling near-term distribution at the highs. First support sits around 205–200; losing it opens a gap-fill path into 192–185 toward the rising trendline. Prior absorption shows around 160s, and a deeper legacy support remains near 122 if momentum fully unwinds.
• Target up: 227–230 retest; above that, 240–245 along the channel.
• Target down: 200 → 192–185 gap fill; extension 160s, then 122 on capitulation.
#AMD #globaltrade #investment #investing #stockmarket #wealth #realestate #markets #economy #finance #money #forex #trading #price #business #currency #blockchain #crypto #cryptocurrency #airdrop #btc #ethereum #ico #altcoin #cryptonews #Bitcoin #ipo

$AMD Pullback DueAMD is tagging the 3SD of Bollinger Band on daily and weekly. Pullback to $213 is possible and it is a good level to sell puts against.

AMD ATH BREAKAMD breaking the all time high right now. Had the open ai news and gapped up 30% Monday with tons of call flow follow through.

Hello trader, last Tuesday, July 10, 2025 AMD 211.51www.tradingview.com
we scheduled a bullish entry in
AMD: Our bullish entry should be above 232.00; our bearish entry should be just below 198.00.
This is what happened today at the open.
Bullish pennant pattern!Possible bullish pennant pattern forming on this 4hr chart!
- Bullish scenario, needs to break 219 and hold for validation on this trade!
- Bearish scenario, breaks 201 and continues down to support.
-Not financial advice! This is just for entertainment purposes only! This is my personal opinion.
Short - AMDTime period for this play : week to months
Analysis : Elliot wave 12345 ABC. Expect hitting .618 and bounce back up to go higher.
Pattern if wave B completed : Head & Shoulder
Price Target: Wave ABC
ETA Timeline for correction. Please refer to the chart.
Upcoming events:
Tariff active on 8/1/25 - Friday
Earning on 8/5/25 - Tuesday
Top is not in yet, so 2 Possible top-in levels:
Top 1 - $163.45 : Retesting to hit 163.45, rejected, and break $158
Top 2 - $173.94 : Breaking 163.45 and reject at 173.94
=> Overall, It begins trading side way and show some weakness now.
The correction may not pull back to .618, which is the best level. Other scenarios:
- 0.5 fib, where it test wave 3
- 0.328 fib, strong bullish level if it doesn't break & go to the upside faster

AMD watch $202 below 213 above: Major Golden fibs hold the surgeAMD got a monstrous surge from deal with OpenAI
Touched its ATH and retraced into a double Golden zone.
Expending to consolidate within the range then break.
$ 213.76 is a Golden Genesis above.
$ 202.82 is a Golden Covid fib below.
$ 217.05 is a minor Covid and was ATH.
.
See "Related Publications" for previous plots such a as this recent TOP CALL:
Hit BOOST and FOLLOW for more such PRECISE and TIMELY charts.
We post timely updates with accurate mapping of trade targets.
========================================================
.

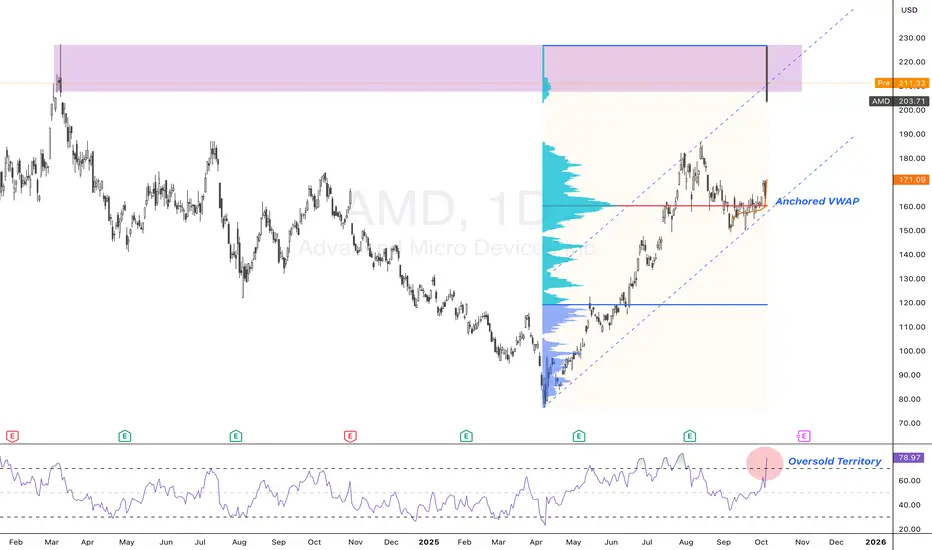
AMD: Big AI Deal, Bigger Expectations — But Caution Near HighsAMD ripped +37% after announcing a 6 GW GPU supply deal with OpenAI, including a 10% warrant structure tied to performance and stock price.
Yes, the partnership validates AMD as a serious Nvidia rival — but much of that sentiment is already priced in.
Now we enter the quiet phase:
Revenue from the deal won’t hit until 2H 2026
No near-term earnings catalyst
No immediate follow-through customer (yet)
Price is retesting March 2024 highs. A double top may be forming — or just healthy consolidation. Until real revenue shows up or a new win (Meta, AWS, etc.) breaks the news cycle, this may drift or correct.
Treat the March 2024 resistance as key. Eye the April rally leg for a possible pullback zone. High expectations, but execution is everything now.
AMD Shares Surge After Partnership Announcement with OpenAIAMD Shares Surge After Partnership Announcement with OpenAI
According to media reports:
→ The deal involves AMD supplying processors of various generations to support the deployment of artificial intelligence infrastructure with a total capacity of 6 gigawatts.
→ The partnership is expected to generate billions in revenue for AMD starting in 2026.
→ Barclays analysts have raised their price target for AMD shares from $200 to $300.
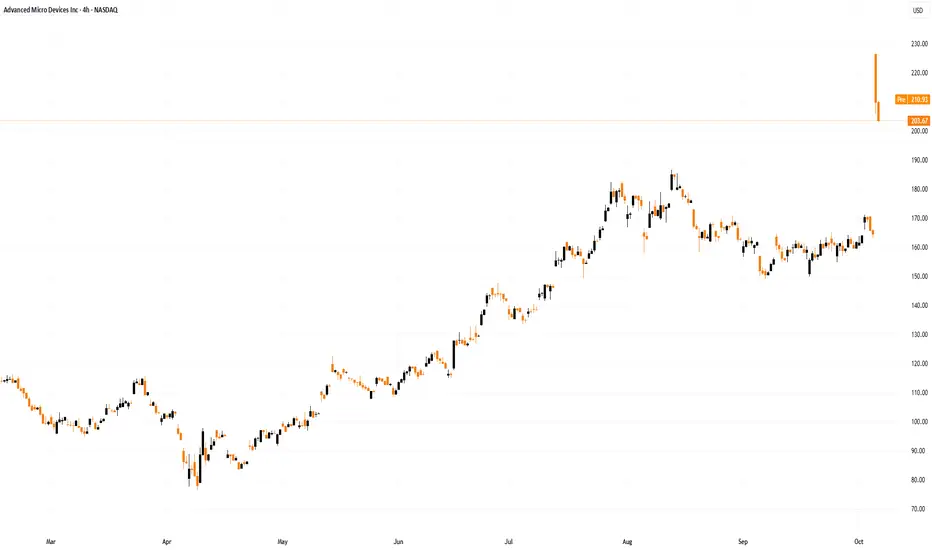
The major announcement fuelled a sharp rally of around 30% in AMD’s share price, though this surge triggered aggressive selling pressure near the historic peak around the $227 level.
Technical Analysis of AMD Stock Chart
Price action analysis shows that:
→ The trading session opened with a wide bullish gap, breaking through the key psychological level of $200.
→ The price also surpassed previous resistance levels at $180 and $190.
→ During the session, the price pulled back, forming two large bearish candles on the four-hour chart.
A reasonable interpretation:
→ The initial reaction was highly emotional, but the optimism is fading quickly.
→ The price movement indicates strong bearish activity following the sharp rise.
Selling pressure is being driven by:
→ Investors locking in substantial profits now, as the deal’s financial impact will unfold gradually over time (creating future opportunities to re-enter at lower prices).
→ Technical signs of an overbought market.
Signs that AMD shares may be overbought include:
→ The RSI indicator, which exceeded 80 yesterday.
→ The price opening significantly above the upper boundary of the ascending channel.
Possible Scenarios for AMD Stock Price
Short-term: Bearish activity could drive a correction towards:
→ The median line of the ascending channel, where demand and supply typically balance.
→ The psychological level of $200, which may influence sentiment among traders reacting to the news.
Long-term: AMD shares remain fundamentally attractive, given that:
→ The AI boom continues to serve as a major growth driver.
→ Market participants expect the Federal Reserve to begin cutting interest rates.
This article represents the opinion of the Companies operating under the FXOpen brand only. It is not to be construed as an offer, solicitation, or recommendation with respect to products and services provided by the Companies operating under the FXOpen brand, nor is it to be considered financial advice.
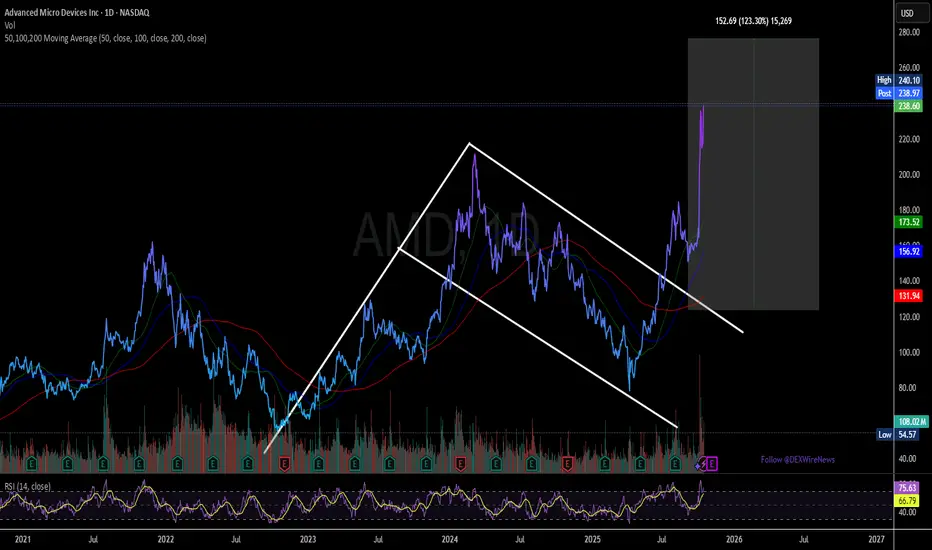
AMD - Bull Rush IdeaAn idea suggesting a surge in price for AMD
This is made by comparing a previous situation on chart with current (grey rectangles) within the channel in blue
This is the 3 Monthly chart for AMD which is a very long timeframe
RSI also shows a cool pattern of rise and then long stagnation then right now a sharp rise.

AMD woke up from sleep; It was its timesAMD Update and New Outlook.
In my previous forecast, I maintained a bullish stance on AMD, identifying entry zones between $176 – $172 and projecting a potential move toward $200, with a longer-term target near its all-time high of $226.
Following the recent news of OpenAI acquiring a 10% stake in AMD, the asset successfully reached my forecasted targets.
After the subsequent rally, AMD has experienced a natural pullback, presenting fresh long-term opportunities.
I’m currently watching two new buy zones at $200 and $185 for potential long-term positions.
As always, this is not financial advice. Please conduct your own research (DYOR) before making any investment decisions.
Connect with me here on TradingView. Please, like, follow me and connect.
Previous forecast
Hello trader, for tomorrow, AMD: 203.71 10/7/25 12:48 amPossible scenario: If the price opens above the previous day's closing price, we could have a quick bullish entry up to 226.00. Scenario #2: Our bullish entry should be above 232.00; our bearish entry should be just below 198.00.