AMD trade ideas

AMD AnalysisPrice consolidated since my last analysis. Price took buy-side liquidity last week and rejected strongly to the downside, playing out nicely as analyzed. Right now, price is currently retracing the the premium level. I'm expecting price to continue lower to mitigate the bullish POI at 87.81.

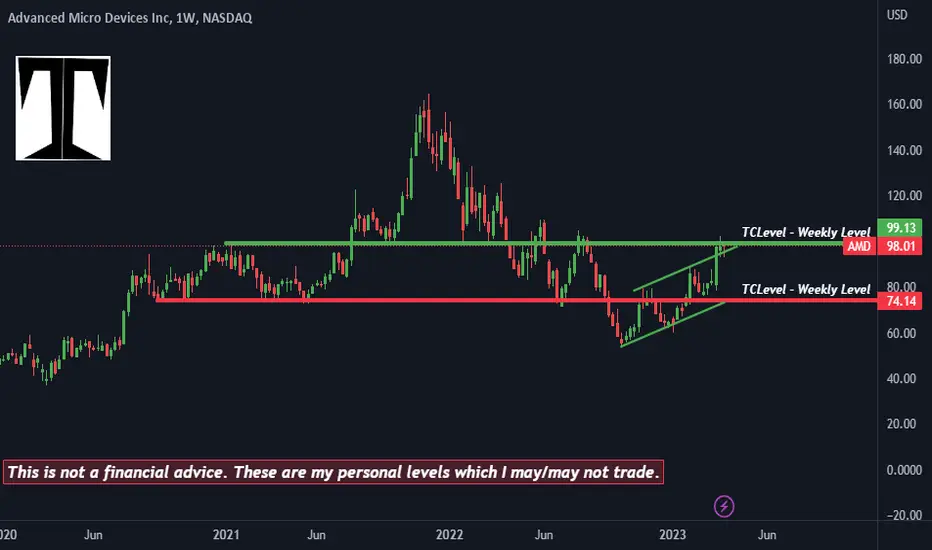
Weekly Levels : AMDNext Support and Resistance Area for $AMD
Identified on the chart the next possible Support and Resistance, where the price will exit this trading range.
AMD Short term bearish to $120. AMD completed a 5 wave impulse pattern, and seems to be doing a 2nd wave from a 3 wave corrective pattern on the daily chart. Wave 3 looks like it may bottom around $120. Additionally, if AMD continues further it would have completed a Decreasing Head and Shoulders, suggesting around $120 being the bottom as well. Furthermore, the RSI on the daily has weakened, and the weekly trend is that of a 5 wave motive, lining up with the market melt up theory that I have. A fibonacci analysis of that 5 wave lines up almost perfectly, suggesting we are in a 4th wave with a bottom of around $120. It's hard to determine the top for AMD, however $200 seems to be within it's range by mid next year.

AMD Head and Shoulders NASDAQ:AMD
Im looking at AMd below 97 for puts and it feels like it needs a good pull back before it heads back up.
This is not a investment advice!

AMD technical analysis for next weekThe market target may reach 107.49 to 116.52 in the next week. Expectations

AMD looking bearish possible shortAMD possible short rejecting the previous trendline what do you think

AMD is Bullish
Chart: AMD daily and 15 mins
102-103ish resistance level is key point for AMD on daily chart
8 EMA already catching up by time correction
15 mins trend line looks solid and can be trust for long side of trade.
Remain long term bullish view about AMD. Will consider play some short trade by 15 mins time frames and if AMD drop to 88ish, will consider add more.

AMD About To Soar On The Back Of The Semiconductor Boom?Advanced Micro Devices, Inc (AMD) is a US multinational semiconductor company that offers high-performance computing platforms for cloud, edge, and end devices. Its products include CPUs, GPUs, FPGAs, and Adaptive SoCs, which are used in various devices, including personal computers, gaming consoles, and servers. AMD faced challenges in the past but regained some of its market share thanks to the success of its Ryzen processors. The company has expanded into new markets and plans to enter the high-performance computing market. AMD is listed on NASDAQ and is a component of NASDAQ 100 and S&P 500 Information Technology.
Pivot Wyckoff Change Of Character To Bullish Trend
In late Nov 2021, AMD reached an all-time high of $164.46 but retraced subsequently from that point. The price was unable to rebound and instead entered a Wyckoff distribution phase. It broke the $122.50 axis and retested the support of $100 on 22 Jan 2022. The following weeks saw the price range bound and the increase in volume with inability to rally up suggests more weakness ahead. This was confirmed when the price broke the $100 support in a Wyckoff last point of supply (LPSY) fashion.
There was a spike in volume on 4 May, but no follow through to the up side which led to a redistribution. The Wyckoff sign of weakness (SOW) took the price down to around $54.60 on 13 Oct. The volume was high but no further down move suggested it was stopping volume. The test of the selling climax in Dec 2022 contained lower volume with a higher low followed by a higher high rally that broke out from the downtrend line. This signaled an important concept, a Wyckoff change of character, which switched the bias from downtrend into at least a trading range if not a reversal.
The year 2023 began with a formidable SOS rally where AMD broke above the $79 resistance with earning results as catalyst on 1 Feb. There was a spike in volume but the shallow pullback tested the resistance-turned-support at $76-$79 with low volume hinted at supply absorption. It is now testing the long term resistance of $100.
Bias
Bullish. According to the Wyckoff method, AMD has just broken out from the short-term Wyckoff accumulation phase and back up (BU). It is now in phase E to challenge the $100 axis, which could form a larger accumulation structure. The last 3 days are showing rejection tails with localized increase in volume. Nevertheless, the bullish price structure is still intact and will likely see more rally up to test immediate targets of $110 and $122.50 subsequently.
If the price breaks below $89, it will likely retest the support zone between $79 and $76.60. Despite the failure scenario showed up as discussed in my latest video, the characteristics of the FOMC bar was not as bearish as anticipated. This could present a trading opportunity for AMD to ride on its strong bullish momentum.

AMD AnalysisPrice played nicely according to my last analysis, taking out the bearish POI at 90.90, and taking buy-side liquidity built in August 2022. From here, I'm expecting a bearish retracement potentially back into the bullish POI at 87.81 next.


AMD in ABC correction Looks like after bull run in clear Elliot waves is entering abc correction.
We could see a bounce today from morning lows and then another push down.
Good luck

Going back to demand zone 87.5$Was stopped by SUPPLY zone from earlier this year at 100$
Now going back to SUPPLY zone to hit new highs

AMD shorting oppurtunityAMD is showing weakness at supply level after extended run, it is setting up for a short entry

SasanSeifi 💁♂️ AMD/ 1D LONGTERM ⏭ $89/$97 ? ❗❗HI TRADERS ✌The possible scenario of AMD is specified. As you can see, after breaking the long-term downward trend, the trend started to grow up to the range of 89 and then with a slight correction, it was able to grow again from the range of $76.
It is currently trading in the range of $83.24 and is above the 60 EMA. We can expect the price to grow to the range of $89. We have to see how the price will react to the $89 resistance range. If it stabilizes above the range of $89, the next target is the range of $97.
Keep in mind that it is important to maintain the $75 support Zone for the continuation of the uptrend
let's see...
❎ (DYOR)...⚠⚜
WHAT DO YOU THINK ABOUT THIS ANALYSIS? I will be glad to know your idea 🙂✌
IF you like my analysis please LIKE and comment 🙏✌


AMD is approaching resistance (daily chart)AMD, like many semis, has been on a rip lately. However, it appears to be in a resistance zone at a Gann confluence line at 100.13 (like SMH and many other semis), which is also where it turned back earlier. The RSI(9) is overbought. I would see it going back to prior Gann line at 91.23. That line is also near the top of a bullish Ichimoku cloud. Perhaps a buy there, but I would be cautious about buying semis after April, since we may be entering some seasonality.

AMD: ROAD TO $100$AMD has left the descending channel and close above the 50 daily MA. Now with BoC signaling interest rates cut in the next meetings, Fed will certainly not keep the same hawkishness after the positive US economic data too.
Let's see what we get for Q4,2022 earnings report, 31 January 2023. Will update this by then.
SL: below $60 should be fine
TP: $

A larger ABC will take this to $20/share in the near futureDouble top, crab, bat, you name it. Watch it reverse.
This game is built on 2 emotions - fear & greed.

AMD AMD(98.3) made high of 101.7 to the Speed Fab Golden pocket and now on the Inv.H&S neckline support
1. can retrace to 96.55-->95.41-->91.9 to play puts
2. watch for 102 .3 break out to for calls

Watchlist 2023-03-22 FED decision $SPY $TQQQ $SQQQ $AMZN $AMD $TSPY - flat looking into today's rate decision with consensus expecting a 25 bps hike, however still some other forecasters expecting a pause of 0 bps. This means that volatility will be incredible if there is a surprise pause but the FED has not made a rate decision against consensus in the last 12 months. There are a lot of key resistance levels over SPY including the PD high, 200 EMA at 399, and 400 key level. 394 is the next key support.
If 25 bps - unclear what the initial reaction will be - wait for levels to form after the 2:00 announcement and follow the trend on pullbacks' if price action is confirming thesis.
If 0 bps - bullish thesis- get in asap IF price action confirms, hold until price is extended. If there is a fakeout about a key SPY level like 400 and price hold below, consider trimming position of getting out completely.
Bullish Products:
- Bank stocks $TCF $ALLY $KRE- showing the most strength the last trading session and TFC has the most room to the March 14 pivot high have the most RR to the
- Tech - $TQQQ, $AMZN - huge unfilled void above 101 coming from a daily buy setup and showed relative strength PD.
Bearish Products
$SQQQ
$AMD - rejected the 98.75 pivot and then showed relative weakness yesterday to the market and even the other semis $SMH rallied
Reasons to exit - bullish price action is muted, wicking, can't get past and clear levels, wait for a larger pullback for better RR.
For a trend day we'll need to see the $ADD pinned near +\-2000 and $VOLD ratio over +/- 3.

$AMD 1W: Head & Shoulder TopRejected .886 @ 98.86
W-shaped harmonic completed, also a simple H&S... textbook
Target: 30s

AMD | Line DrawingThings to have in mind:
I've graphed a few historic values that most analysts have in their notes.
Advanced Micron Devices, Inc. reports their earnings 05/02/23 AMC: I'm anticipating the market will buy the surprise.
The %B is at a good value to "signal overbought".
