Boeing Continuation? Monthly Technical Perspective BA is not a name I typically pay attention to but I recently noticed a fairly simple monthly trade idea. Weakness caused by economic turmoil, airline delays, and a government shutdown is clearly present on the lower time frames. However, from a strictly technical perspective, this BA chart looks good on the monthly time frame if November can hold above the $190 level.
Confluences
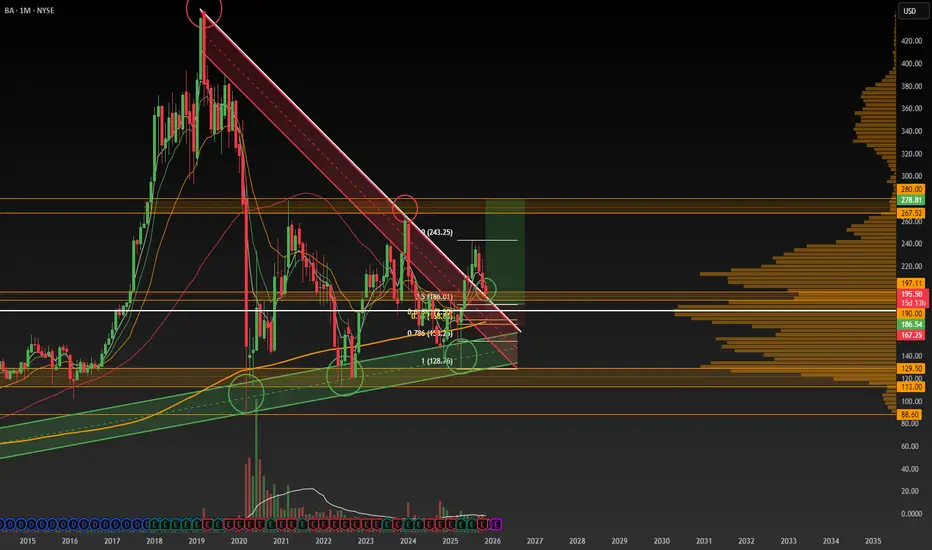
- Strong monthly candles from April to August sparked a breakout above the MACRO downtrend that started in 2019
- It appears that a controlled monthly bull flag is forming as price retraces to the previous trend resistance channel which should now theoretically act as support
- This trend retest is occurring right around the $190 area which has acted as a key inflection level during 2020-2025 monthly range
- Price is retesting a massive volume shelf and VPOC shelf around the 190 area
Trade Idea (~5R)
- A conservative entry would wait for a monthly hold above 0.5 fib or ~$190 and the weekly 200MA to signal a December entry
- A high risk entry might scale in on the daily/weekly chart with the majority added if price wicks down into the 0.618-0.65 fib (golden pocket) which is deeper in the red resistance channel turned support. The high risk golden pocket fib entry at ~$170 would be in confluence with the center of the trend channel, the VPOC, and the monthly 200MA.
- Target previous highs at $240, $267, $280
- Look to close position after these trims into previous resistance
Thesis Is Invalidated If:
- Conservative Trader: Monthly Candle closes below $185 (tight stop)
OR
- Risky Trader: Monthly candle closes below $169 which is the golden pocket fib drawn from the April 1 lows recent swing high
Just an idea... NFA.
Trade ideas
Boeing Accelerates in 2025: Orders and New DeliveriesBy Ion Jauregui – Analyst at ActivTrades
Strong Fundamentals: Recovery in the Aviation Market
Boeing (NYSE: BA) is approaching its best year since 2018, thanks to the global recovery in commercial aircraft demand. In October, the company delivered 53 units, bringing the total to 493 aircraft in 2025, of which 39 were 737 MAX. Orders for the 787 Dreamliner reached 320 units, close to the 2007 historical record, and the total order backlog stands at 5,911 aircraft, providing revenue visibility for the coming years.
Although Airbus (EPA: AIR) remains ahead with 585 deliveries, Boeing has secured 782 net orders in 2025. Additionally, the company received approval to increase production capacity in South Carolina, rising from 38 to 42 aircraft per month, strengthening its ability to meet global demand.
CEO Kelly Ortberg continues to prioritize quality and efficiency, mitigating risks of delays and cancellations. This solid operational backing, combined with the post-pandemic recovery of the industry, reinforces a positive fundamental outlook for Boeing, supported by a robust order backlog and production expansion.
Technical Analysis: Key Levels and Possible Scenarios
On the daily chart, Boeing shows a medium-short term corrective trend since May, after trading between $228.15 and $195 throughout 2024. Yesterday’s closing price was around $195.50, with a premarket at $195.92.
The stock has formed a strong technical floor, confirmed by an RSI in oversold territory (32.45%) and a MACD in negative territory that is starting to show signs of reversal. The ActivTrades US Market Pulse indicates that the previous extreme Risk-On sell-off may have come to an end.
The Point of Control (POC) is around $215.49, suggesting the potential start of a recovery if the moving averages change direction. A crossover of the 50-day moving average over the 200-day would confirm a correction, potentially sending the price back to the previous range ($184.35 – $163.70). Conversely, if bullish momentum persists, the stock could reclaim positions above the POC, reinforcing the recovery move.
Boeing in the road to recovery
Boeing combines strong fundamentals with a favorable technical setup: recovering deliveries, robust orders, and increasing production capacity, supported by technical indicators suggesting a possible rebound. This positions the company as an attractive option for investors seeking exposure to the aerospace sector and the global recovery in air traffic.
*******************************************************************************************
The information provided does not constitute investment research. The material has not been prepared in accordance with the legal requirements designed to promote the independence of investment research and such should be considered a marketing communication.
All information has been prepared by ActivTrades ("AT"). The information does not contain a record of AT's prices, or an offer of or solicitation for a transaction in any financial instrument. No representation or warranty is given as to the accuracy or completeness of this information.
Any material provided does not have regard to the specific investment objective and financial situation of any person who may receive it. Past performance and forecasting are not a synonym of a reliable indicator of future performance. AT provides an execution-only service. Consequently, any person acting on the information provided does so at their own risk. Political risk is unpredictable. Central bank actions can vary. Platform tools do not guarantee success.

Boeing Eyes Major T-7 Deal as Price Trades In a Falling Wedge Boeing is drawing renewed attention as it prepares to announce a new partnership tied to an international bid for its T-7 trainer jet. Executives confirmed that details should emerge within a week, signaling growing global demand for lightweight training aircraft. The move follows earlier reports that Boeing and Saab, already joint partners on the T-7 program, have been in discussions with BAE Systems.
Their potential collaboration is viewed as a strategic push to compete for Britain’s future trainer fleet, which is expected to replace the long-serving Hawk jets after the UK’s latest defense review recommended a next-generation solution. Boeing’s expanding interest in major markets across Europe and Asia reflects the rising need for advanced trainers as air forces modernize and prepare pilots for fifth-gen fighters. The news comes during the Dubai Airshow, where defense procurement momentum tends to accelerate.
Fundamentally, Boeing’s defense segment is becoming increasingly important as the commercial aircraft division continues navigating production and delivery challenges. A strong T-7 export pipeline could support better revenue diversification and stabilize long-term contracts. While the final structure of the upcoming partnership remains unknown, investor sentiment is likely to improve if Boeing secures a competitive position in the UK tender. However, integration, execution risks, and geopolitical uncertainty remain factors that could affect the program.
Technically, Boeing’s chart shows a long-term symmetrical wedge formation. Price is trading near $194, sitting in the midpoint of the structure. The upper trendline around $250 continues to cap bullish momentum, while the rising lower trendline near $150 provides multi-year support. Recent selling pressure has pulled price off the $240 region, but the long-term structure remains intact. A breakout above $250 could trigger a strong continuation move, while a breakdown below the rising base would shift sentiment bearish.

Check out my previous analysis on Boeing :)What I take from this analysis is that we are close to seeing this market share within the range mentioned on the chart!
Good luck!
Another fake news on orders from Turkish AirlinesAnother round of “fake news”?
Headline: Boeing receives a major order from Turkish Airlines for up to 225 aircraft.
Reality check: Turkish Airlines currently operates just 387 aircraft in its fleet. Earlier this year, we saw the same script play out when reports claimed Pegasus Airlines — the low-cost arm of Turkish Airlines — placed “hundreds of orders.”
Once again, the numbers don’t add up...

BA EARNINGS OCT 2025BA: Rejection near 227 (EPS).
Holding 215 support; absorption 215–218.
Upside tgt 240. Downside tgt 212–206 gap.
#BA

Boeing (BA) – Final Leg of Macro Bull Run✈️ Boeing (BA) – Final Leg of Macro Bull Run | Wave 5 to 1.618 Extension ($1200) 🚀
📅 Timeframe: Monthly (Macro Cycle Outlook)
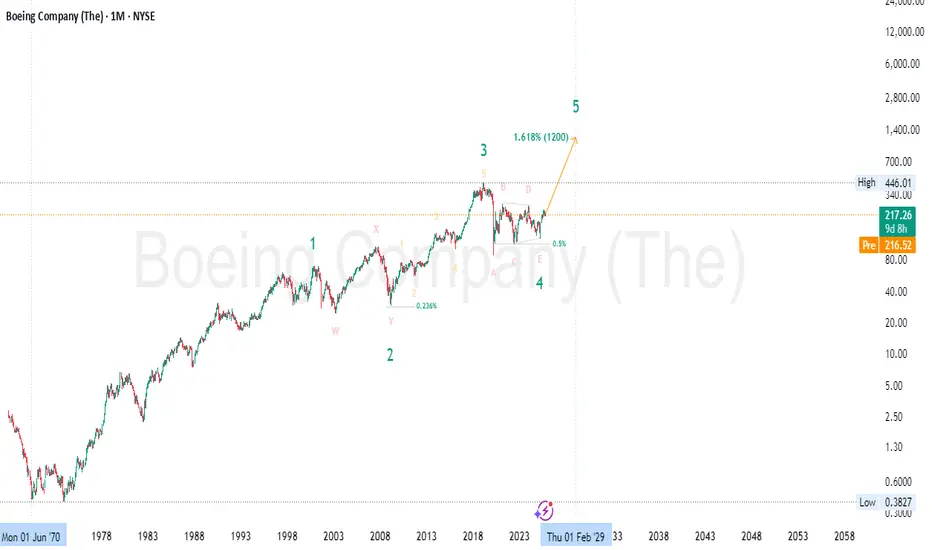
📍 Current Price: $217
🎯 Wave 5 Target : ~$1200 (1.618 Extension)
🌀 Wave Theory Structure
Boeing appears to be entering Wave 5 of a long-term Elliott Wave cycle:
✅ Wave 1: Multi-decade rise until the early 2000s
✅ Wave 2: Complex correction (W–X–Y) into 2009 lows
✅ Wave 3: Powerful rally through 2019, completed with an extended 5-wave subdivision
✅ Wave 4: A large-scale triangle correction (ABCDE) — now completed, as price has broken structure upward
🚀 Wave 5: Projected move toward the 1.618 Fibonacci extension (~$1200) from the 1–3 wave distance
This is a textbook impulsive wave structure playing out on the monthly macro scale — with a final bullish leg now unfolding.
📐 Fibonacci Confluence
Wave 2 retraced ~0.236 of Wave 1 (shallow, bullish corrective behavior)
Wave 4 retraced ~0.5 of Wave 3 — typical for triangle patterns and expanded flats
Wave 5 target at 1.618 Fib extension measured from Wave 1–3 aligns around $1200 , completing the 5-wave macro cycle 🔺
🧠 Smart Money Concepts (SMC)
🔹 Accumulation Phase (2020–2024): After COVID crash and multi-year consolidation, price has shown strong accumulation characteristics
🔹 Final Sweep of Lows (E leg) flushed out late longs and retail stops before institutional re-entry
🔹 Break of Structure (BOS) confirms transition from reaccumulation to markup phase 📈
🔹 Price is now in a reprice phase — a classic SMC trait where value is rapidly adjusted after institutional positioning completes
📊 Price Action Analysis
Bullish breakout from triangle structure
Monthly higher low established at E-wave base
Strong bullish candle from demand zone — early confirmation of trend continuation
Break above $260 would open clean skies toward the next major resistance at ATH ($446) and beyond 🧭
💼 Fundamental Outlook
Boeing is regaining strength after multiple challenging years:
✈️ Rebound in global aviation demand
📦 Growing defense & aerospace contracts amid rising geopolitical tensions
💰 Expected recovery in cash flows, backlog, and profitability
🌐 Expansion in space and unmanned systems (future growth verticals)
Although regulatory and delivery risks remain, Boeing’s turnaround story is gathering steam — aligning with the technical forecast of Wave 5 acceleration.
🔍 Summary
Boeing is entering what could be the final and most explosive leg (Wave 5) of its macro Elliott Wave cycle. Key confluences include:
✅ Elliott Wave triangle completion
✅ Fibonacci 1.618 extension to ~$1200
✅ Institutional accumulation confirmed
✅ Price Action breakout from multi-year structure
✅ Improving long-term fundamentals
This setup favors long-term swing positions , with pullbacks offering buying opportunities until the final cycle target is approached. 🧠📈
⚠️ Disclaimer: This is not financial advice. For educational purposes only. Always do your own due diligence and manage risk responsibly. 🛡️
#Boeing #BA #ElliottWave #SmartMoney #PriceAction #Fibonacci #Wave5 #TriangleBreakout #TechnicalAnalysis #LongTermInvestment #MacroTrading #StockMarket #BullishOutlook #Aerospace #WaveTheory #SwingTrading #AviationRecovery #FibonacciTargets #TradingStrategy
Boeing (BA) Technical Outlook: Is Downside Momentum Building?✈️ BA "BOEING COMPANY" | Cash Flow Management Strategy (Swing/Day Trade)
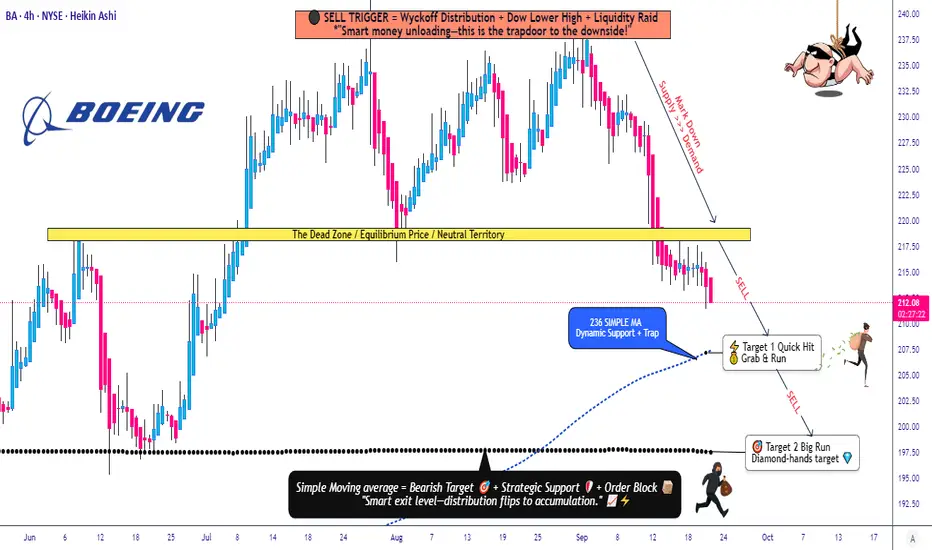
📉 Plan: Bearish Setup
This analysis follows the Thief Strategy 🕶️ — a layering method of multiple sell-limit orders across different levels.
🔑 Trade Plan
Entry (Layered Sell Limits):
220.00
218.00
216.00
214.00
(You can increase/decrease limit layers based on your own preference)
Stop Loss: 227.00 (⚠️ Thief SL)
Note: Dear Ladies & Gentleman (Thief OG’s) 🙌 this SL is just my own preference. Please manage your risk your own way.
Targets 🎯
TP1 → 207.00
TP2 → 197.00
Note: Targets are my reference points. You can book profits at your own choice, anytime.
📊 Key Points & Correlation
Boeing (BA) often reacts to aviation sector news ✈️ and macroeconomic cycles 📉.
Watch related pairs for correlation / sentiment clues:
AMEX:SPY (S&P 500 ETF) – BA is a Dow & SPX component.
TVC:DJI (Dow Jones Index) – Direct BA weighting.
NYSE:LMT (Lockheed Martin) – Sector peer correlation.
SKILLING:AIR.PA (Airbus SE) – Competitive aviation stock in Europe.
A slowdown in air travel demand, defense spending shifts, or broad market weakness may enhance bearish momentum.
🧠 Strategy Style Reminder
This is the Thief Layering Strategy → scaling into positions step by step with multiple limit orders, not rushing into full size at once. It’s a patient cash flow management approach.
✨ “If you find value in my analysis, a 👍 and 🚀 boost is much appreciated — it helps me share more setups with the community!”
⚠️ Disclaimer: This is Thief Style Trading Strategy — just for fun & educational purpose. Not financial advice. DYOR & manage risk.
#BA #Boeing #Stocks #DayTrading #SwingTrading #LayeringStrategy #ThiefStyle #SPY #DJI #LMT #Airbus #StockMarket
Patience!!Boeing is still showing a down trend. I believe price will make it back to the 130’s level to buy in for the 4th wave.

Boeing May Be StallingBoeing rallied sharply in the spring and early summer. But now some traders may think it’s stalling.
The first pattern on today’s chart is the $225.50 level, a weekly low from September 5. BA broke under that level the following week and has stayed there since. It tried to rebound last Wednesday and was rejected. Has old support become new resistance?
Second, the aerospace giant reported strong quarterly results on July 29. Buyers drove prices higher, but sellers turned the bullish open into a bearish engulfing day. That large outside candle is a potentially bearish reversal pattern.
Third, July’s high occurred near a gap from January 8, 2024. Old resistance may have been confirmed.
Next, the 8-day exponential moving average (EMA) is below the 21-day EMA. Last week’s high also occurred at the falling 50-day simple moving average. Those patterns may reflect new downtrends in the short- and intermediate-term.
Finally, BA is an active underlier in the options market. (It averages about 135,000 contracts per session, according to TradeStation data.) That could help traders take positions with calls and puts.
TradeStation has, for decades, advanced the trading industry, providing access to stocks, options and futures. If you're born to trade, we could be for you. See our Overview for more.
Past performance, whether actual or indicated by historical tests of strategies, is no guarantee of future performance or success. There is a possibility that you may sustain a loss equal to or greater than your entire investment regardless of which asset class you trade (equities, options or futures); therefore, you should not invest or risk money that you cannot afford to lose. Online trading is not suitable for all investors. View the document titled Characteristics and Risks of Standardized Options at www.TradeStation.com . Before trading any asset class, customers must read the relevant risk disclosure statements on www.TradeStation.com . System access and trade placement and execution may be delayed or fail due to market volatility and volume, quote delays, system and software errors, Internet traffic, outages and other factors.
Securities and futures trading is offered to self-directed customers by TradeStation Securities, Inc., a broker-dealer registered with the Securities and Exchange Commission and a futures commission merchant licensed with the Commodity Futures Trading Commission). TradeStation Securities is a member of the Financial Industry Regulatory Authority, the National Futures Association, and a number of exchanges.
Options trading is not suitable for all investors. Your TradeStation Securities’ account application to trade options will be considered and approved or disapproved based on all relevant factors, including your trading experience. See www.TradeStation.com . Visit www.TradeStation.com for full details on the costs and fees associated with options.
Margin trading involves risks, and it is important that you fully understand those risks before trading on margin. The Margin Disclosure Statement outlines many of those risks, including that you can lose more funds than you deposit in your margin account; your brokerage firm can force the sale of securities in your account; your brokerage firm can sell your securities without contacting you; and you are not entitled to an extension of time on a margin call. Review the Margin Disclosure Statement at www.TradeStation.com .
TradeStation Securities, Inc. and TradeStation Technologies, Inc. are each wholly owned subsidiaries of TradeStation Group, Inc., both operating, and providing products and services, under the TradeStation brand and trademark. When applying for, or purchasing, accounts, subscriptions, products and services, it is important that you know which company you will be dealing with. Visit www.TradeStation.com for further important information explaining what this means.

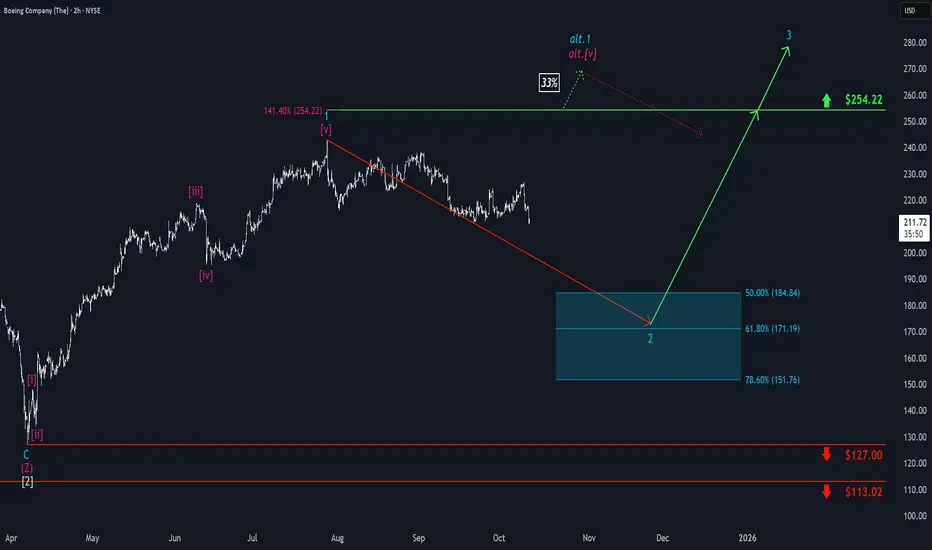
Boeing: Target Zone AheadOver the past two weeks, Boeing shares have seen several upward moves, but each rally was quickly met with selling pressure. In our primary scenario, we anticipate further declines as part of turquoise wave 2, which is expected to conclude within our turquoise Target Zone of $184.84 to $151.76. Looking ahead, wave 3 offers potential for gains above resistance at $254.22. A direct breakout above this level would initially signal a higher high within turquoise wave alt.1 before the anticipated correction occurs (probability: 33%).
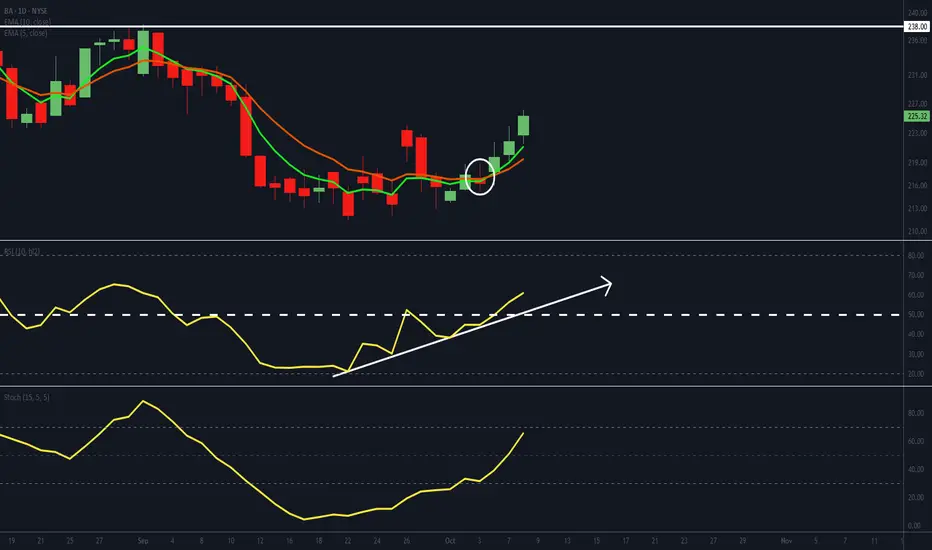
BA setting up for potentially strong move
- BA's EMAs have crossed bullishly and are developing angle and separation.
- Its RSI has popped above 50, suggesting a shift to positive momentum.
- Its stochastic is on the borderline to cross through 70. A move above, will add to the positive momentum argument. The longer it maintains above 70, the greater the likelihood of further price appreciations.
- Overhead resistance is at 238. A break above will be regarded as a bullish development.
Boeing Long BA is now net long on the regression break.
I am taking this trade with my EA for share trading. I will let the computer enter when it is ready.

$BA Rolling over again?After a push higher BA has recently run out of steam and looks like its rolling over. The last few weeks has failed to follow through higher after the Bearish Engulfing Candle. Last week we saw a move down and a close below the 20MA. I expect a reaction higher, initially, and then we see a further move down to wards $200.
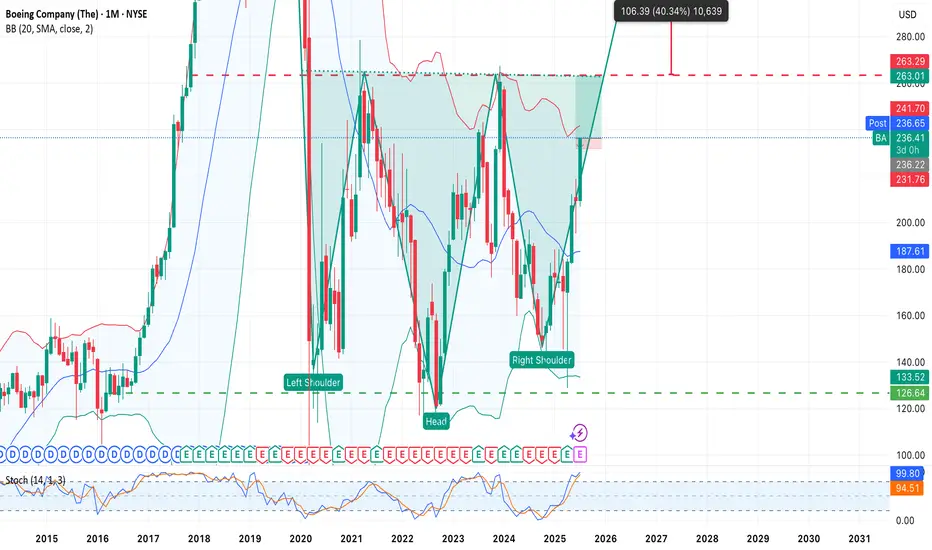
An adventure? Yes. But technically — beautiful. Boeing.Adventure Idea: The Return of Boeing NYSE:BA
An inverted “Head and Shoulders” pattern is forming on the BA (Boeing) chart — one of the most reliable bullish formations in technical analysis. The price is confidently approaching the neckline around $235–241, and a breakout above this level could mark the beginning of a new upward momentum.
Pattern Parameters:
• Left Shoulder: ~$126
• Head: ~$99
• Right Shoulder: ~$126
• Neckline: ~$235
• Breakout Target:
➤ $235 + $136 = $371 (long-term)
➤ Nearest resistance: $263
Action Plan (if entering long):
• Entry: On breakout above $241 or on a retest of $235
• Stop: Below the right shoulder — $126–133 (depending on risk tolerance)
• Targets:
1. $263 — first technical target
2. $280+ — if the trend develops
3. $371 — full target based on the pattern (textbook scenario)😄
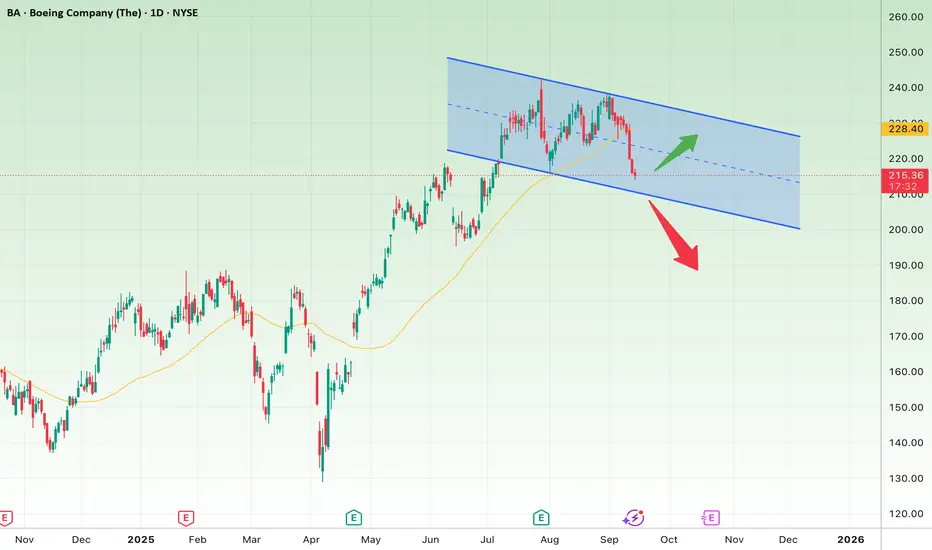
Professional Analysis of Boeing (BA) Stock – Daily TimeframeOn the daily chart, Boeing (BA) has entered a descending channel after a strong rally from the $175 lows up to around $240 highs.
Bullish Scenario:
The price is currently around $215, near the channel’s lower boundary.
If this support holds and the stock reclaims the 50-day moving average (yellow line around $220), a rebound toward the channel’s upper boundary at $228 – $230 is likely.
A confirmed breakout above the channel could open the way toward $240.
Bearish Scenario:
If the $215 – $210 support zone breaks, the stock could slide down to the channel floor around $200 – $198.
A deeper breakdown below that may trigger further downside toward $185.
Conclusion:
Boeing is in a corrective channel. The $210 – $215 zone is a decisive level:
Holding it = potential rebound and short-term upside.
Breaking it = further weakness and extended downside risk.
Levels to watch during $BA bear momentumLabor Strike at Boeing Defense
• 3,200 Boeing Defense workers in St. Louis have rejected a third contract offer, extending a strike that began on August 4.
• The rejected offer included a 45% average wage increase and a $4,000 signing bonus, but union members felt it fell short compared to other Boeing contracts.
• Boeing is now hiring permanent replacement workers to maintain operations, especially for assembling F-15 fighter jets and missile systems
777X Certification Delays
• Boeing’s 777X wide-body jet is facing further delays in FAA certification, potentially pushing deliveries from late 2026 into 2027.
• CEO Kelly Ortberg acknowledged the “mountain of work” still needed, though test aircraft and engines are reportedly performing well.

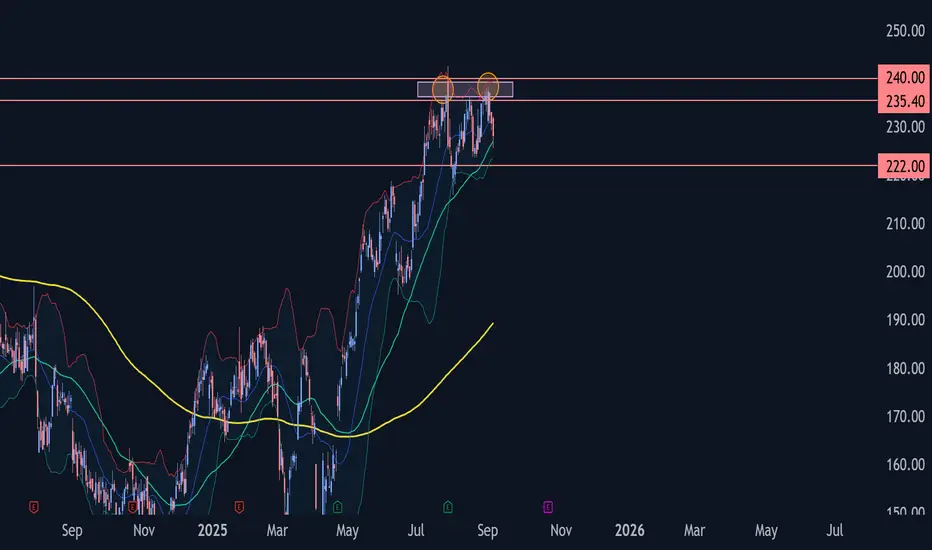
Boeing Wave Analysis –5 September 2025- Boeing reversed from the resistance area
- Likely to fall to support level 222.00
Boeing recently reversed from the resistance area between the resistance levels 240.00 (which stopped impulse wave (C) in July), 235.40 (top of the previous wave A) and the upper daily Bollinger Band.
The downward reversal from this resistance area stopped earlier medium-term ABC correction (2) from the end of July.
Boeing can be expected to fall toward the next support level 222.00 (low of the previous minor correction B from last month).
Wings for $BAMultiple huge contracts, more in the works. Daily tail candle today, as well as a bull triangle forming, should give it another push to upper trendline. I entered 9/19 $240 calls at end of day and looking at 10/17 $160 calls.

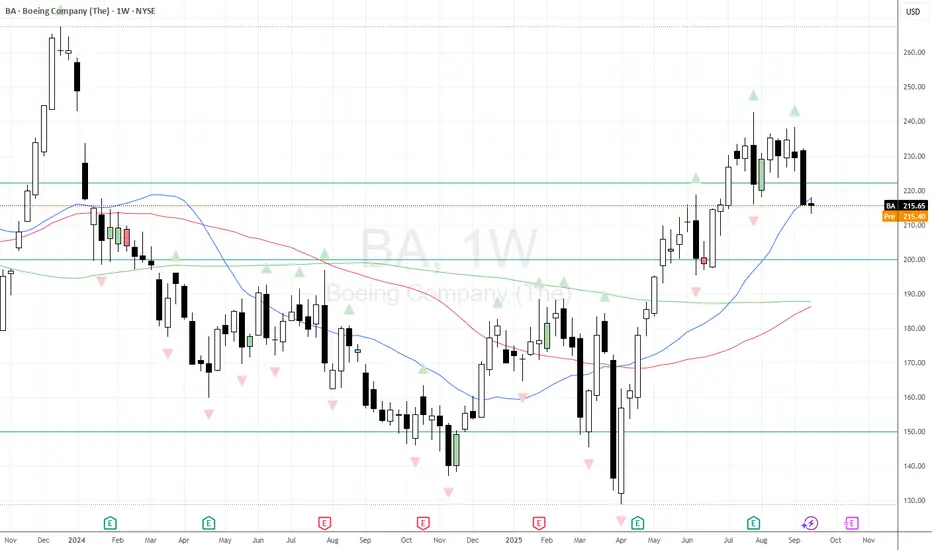
Boeing (BA) Share Price Could Reach 2025 HighsBoeing (BA) Share Price Could Reach 2025 Highs
As the Boeing (BA) stock chart indicates, the price rose by 3.5% yesterday, while the S&P 500 index (US SPX 500 mini on FXOpen) gained only 0.4%. Boeing’s stronger performance reflects optimism driven by news (and market rumours) reported in the media suggesting that:
→ Korean Air has purchased more than 100 aircraft during the newly elected South Korean president’s visit to the White House;
→ Boeing is negotiating the sale of 500 aircraft to China;
→ the Trump administration may acquire stakes in companies linked to the defence sector (Palantir, Boeing, Lockheed Martin).
Technical Analysis of BA Stock Chart
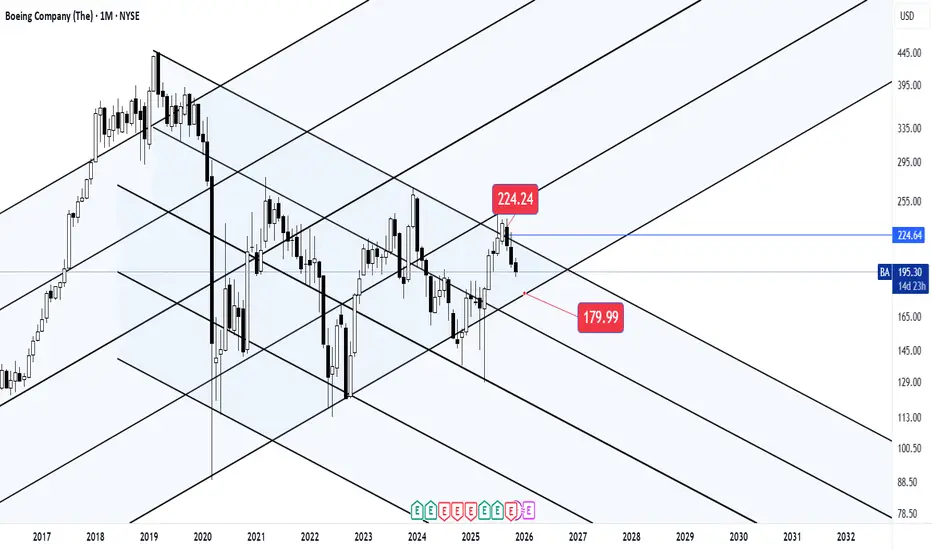
BA’s price fluctuations have formed an upward channel (shown in blue). However, at the end of July, the rally encountered resistance around the $235 level:
→ following a volatility spike at the end of July (triggered by the quarterly earnings release), the price retreated towards the lower boundary of the channel;
→ in mid-August, the price turned downwards again from this level.
At the same time, we can observe a sequence of higher lows (1-2-3), emphasising that the lower boundary of the channel is acting as key support, setting the pace for BA’s growth trajectory in 2025.
It is worth noting that the stock’s oscillation between support (the lower boundary) and resistance around $235 is creating bullish patterns such as an Ascending Triangle and a Cup and Handle.
Should reports of a potential Boeing share purchase by the US government be confirmed, the BA stock price could advance to new annual highs. In such a scenario, several factors could be important:
→ the price may subsequently consolidate around the channel’s median;
→ historically, the $250–260 zone has acted as significant resistance during 2021–2023;
→ the $235 level may switch roles to become support, similar to the way $218 previously did.
This article represents the opinion of the Companies operating under the FXOpen brand only. It is not to be construed as an offer, solicitation, or recommendation with respect to products and services provided by the Companies operating under the FXOpen brand, nor is it to be considered financial advice.

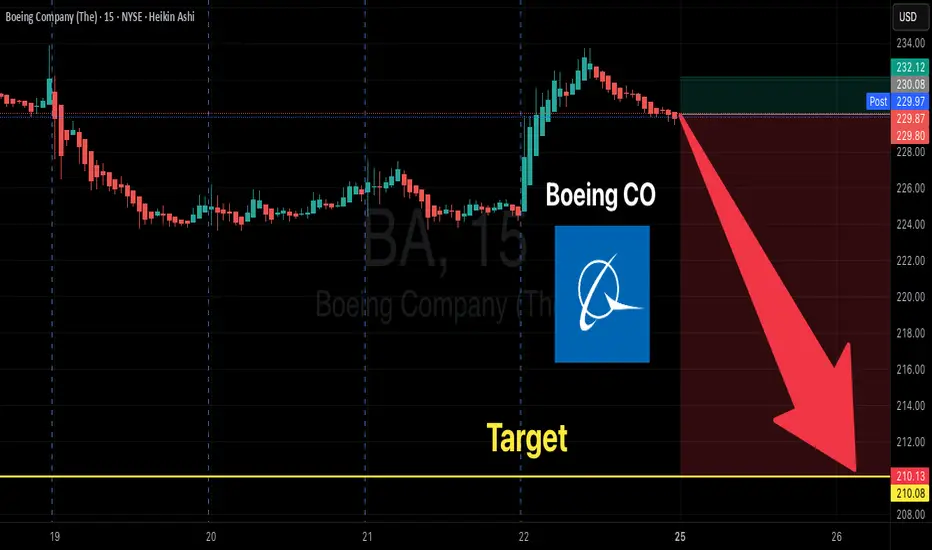
Boeing Breakdown? $210 LEAP Put Trade Could Explode🚨 BA LEAP Put Play – Bearish Setup Into 2026 🚨
📉 Boeing (BA) is setting up for a long-term downside move. With monthly RSI < 45, negative momentum, and a macro headwind backdrop, this is a high conviction bearish LEAP trade.
📊 TRADE DETAILS 📊
🎯 Instrument: BA
🔻 Direction: PUT (SHORT)
🎯 Strike: $210.00
💵 Entry Price: $19.30
🎯 Profit Target: $45.00
🛑 Stop Loss: $11.28
📅 Expiry: 2026-09-18
📈 Confidence: 75%
⏰ Entry Timing: Market Open
🔥 Why This Works
✔️ Bearish momentum confirmed 📉
✔️ RSI < 45 = weakness 🚨
✔️ LEAP structure avoids rapid time decay ⏳
✔️ Macro headwinds = pressure on BA 🌍
⚠️ Risk: Macro or sector rebound could limit downside.
BA (Boeing Co.) – Trade Setup Alert🚀✈️ A major new defense contract is on the horizon — and if confirmed, it could skyrocket BA’s valuation to new heights. This could be the catalyst that propels the stock far beyond its current range.
Boeing is showing renewed strength with a bullish setup developing. With multiple entry points and solid upside targets, this trade offers compelling potential for swing traders and long-term investors alike.
📌 Entry Points:
1️⃣ Market Price
2️⃣ $162
3️⃣ $147
🎯 Profit Targets:
✅ $200
✅ $230
✅ $260
⚠️ Disclaimer: This is not financial advice. All trading involves risk. Please do your own research or consult a licensed financial advisor before making investment decisions.
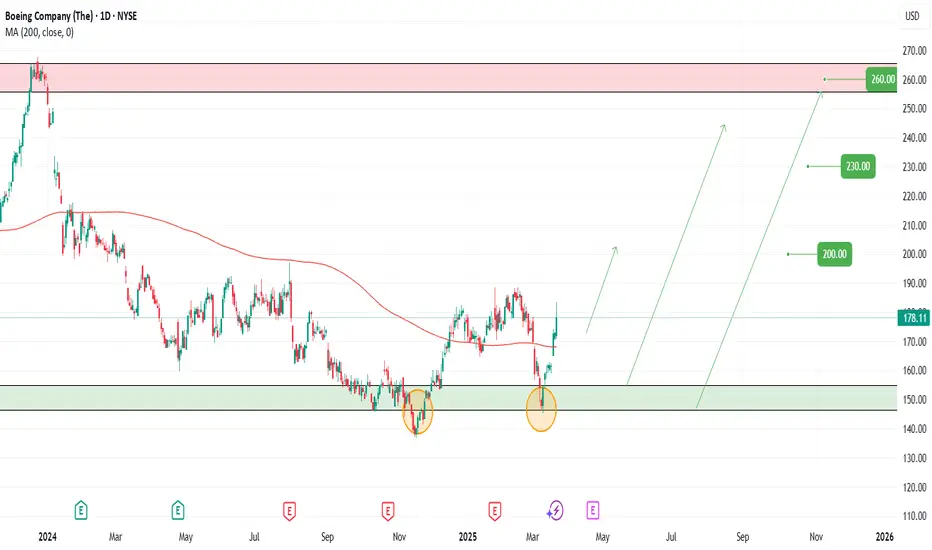
Boeing Headed back up to close gaps near 260 in the short term
Zoomed in you can see its a channel trade
The next best long entry is above 235.00
On your daily chart, go back and look at the gap from Jan 2024 at 234.00 now if you stroll back to last month you'll see all of the price action that reflected that gap resistance.
So the entry long will come over 235 with your first target 250. So set your alerts !
The bigger picture is the double bottom,
It will be completed before Boeing heads lower
Can Boeing break above 275 this time around after 5yrs of 100-250 range trade? I don't think so , but I would just trade the the numbers and treat 100-250 as supply and demand. Breakout over 300
