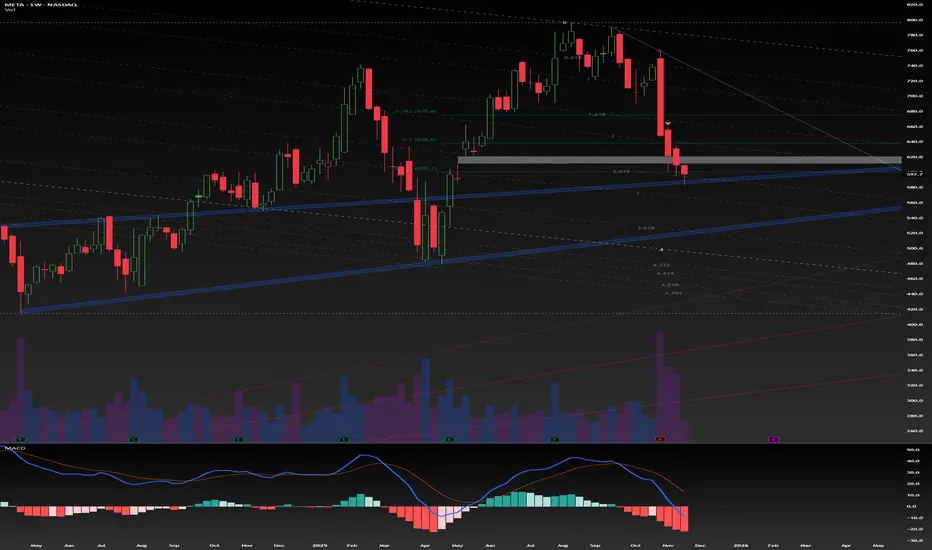
META now close to a critical trendlineMETA is approaching a significant technical region.
The trendline currently in focus originated on 31 October 2022, and it has remained relevant over time.
This same trendline was retested twice in April of this year, and price action is once again moving toward it after achieving a new all-time high.
At the moment, the asset is sitting at the Fibonacci 61.8% retracement level — a well-known zone where reversals often occur. Based on this structure, the asset may begin its upward move from the current region, or it may decline by an additional $10–$20 to retest the ascending trendline.
I have taken my initial positions in META during this pullback and may increase my exposure if price reaches the trendline.
Overall, my outlook remains bullish.
Trade responsibly.
Entry: RR is 1:3
Confidence: High
Trade ideas

Patience pays off? Long METAI've been patient with META. I've been wanting to go long here since earnings, but I also wanted to see if we'd get closer to the lower trendline. Luckily I waited. But I'm at a point I don't want to wait longer to start my position/trade.
The reasons:
1. That lower trendline has held since October 2022. I might do something I rarely do which is set a stop loss somewhere like $530, just in case. But I think the bulls will jump back in here.
2. Look at the MACD. The last time it looked like this, Meta went on a run from $490 to about $750.
3. There's bullish divergence starting to appear in the RSI which is also oversold at 26.5
4. For the past 2 quarters, the POC is almost exactly where we are. This volume should at least slow the drop, and potentially work as a floor to bounce off of.
I'm not planning on holding this long term, but I will if I have to.
I just bought 25% of my trade and I'll DCA 3 more red days as long as it stays above the trend line. If it drops below the trendline, I'll hold and wait to see what happens with the structure.
I have 3 targes as usual:
Take Profit 1 = $650 (I think the 200day will be there) and I'll sell 50% of my position.
Take Profit 2 = $680 (there's some volume resistance there) and I'll sell 50% of my remaining position.
Take Profit 3 = $850 or if it touches the upper trendline.
Good luck!

$META, rejection below $600, not perfect, nor a game changerNASDAQ:META
I remain heavily short.
The rejection below $600 wasn't ideal, but it's not the end of the world either.
For now, odds still favor we will lose $600 support in the coming weeks.

META – Structurally Oversold With a Completed Falling WedgeMETA – Structurally Oversold With a Completed Falling Wedge: Watching for a Counter-Trend ABC Recovery
META continues to trade under significant downside pressure, but the short-term structure is becoming increasingly constructive. Price action has carved out a well-defined falling wedge, accompanied by a clear five-wave internal decline that appears to be completing. Momentum is decelerating, candles are compressing tightly toward wedge support, and buyers are beginning to show initial absorption at the lower boundary.
META is showing early signs of stabilization after a prolonged decline. With a completed falling wedge pattern and evidence of structural exhaustion, the probability of a short-term bullish corrective phase is rising. A measured ABC recovery remains the primary scenario, contingent on a confirmed breakout above wedge resistance.
Close monitoring of intraday strength, breakout confirmation, and volume follow-through will be essential in validating the emerging reversal. A break from this support opens the door to the gap below.
These conditions set the stage for a potential relief rally into the final weeks of November and early December.

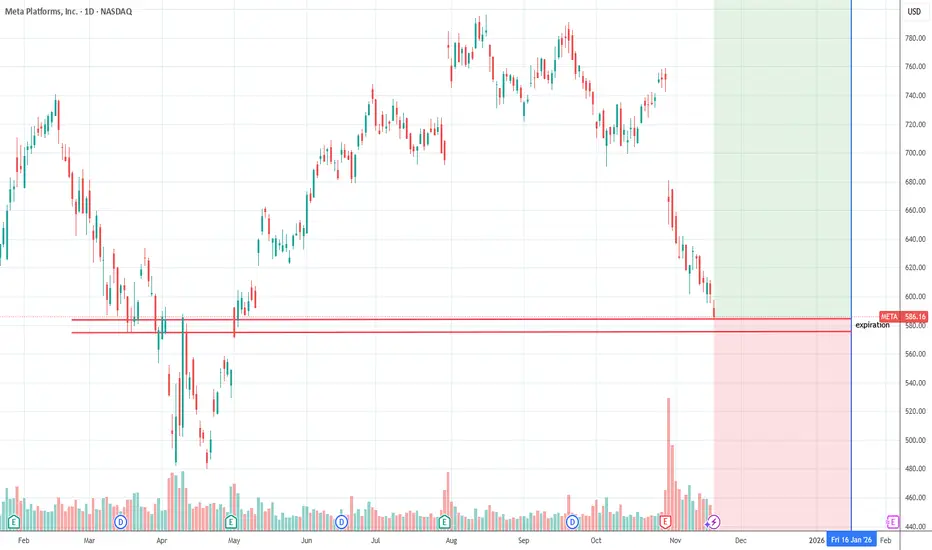
Meta Wins Major Antitrust Battle as Stock Remains Bullish Meta scored a major legal victory after a federal judge ruled that it is not an illegal monopoly, rejecting the Federal Trade Commission’s argument that the company should be forced to divest Instagram and WhatsApp. The FTC had claimed that Meta acquired both platforms to eliminate potential rivals, but Meta countered that the social media landscape is far more competitive today, with platforms such as TikTok and YouTube commanding massive user engagement.
Judge James Boasberg agreed, stating that Meta faces strong competitors and does not control the market. He also noted that the industry has shifted significantly since the case began, especially with the rise of AI-generated content reshaping user experiences. The decision prevents the forced breakup of Meta, safeguarding its highly profitable ecosystem built around Instagram ads, WhatsApp business tools, and Facebook’s global reach. Meta welcomed the ruling as a win for innovation, while the FTC voiced disappointment and said it is reviewing next steps.
On the technical front, Meta’s stock has pulled back sharply from its recent high near $796, dropping toward a long-term ascending trendline. Price is currently sitting around $601, where buyers may soon look for a rebound. The chart suggests a potential continuation of the larger bullish trend if price stabilizes above the trendline. Should a reversal form, the next upside target remains the earlier high near $796.
If bearish pressure continues, the trendline below $560–$580 acts as a key support zone. A breakdown from this level would delay bullish momentum, but for now the overall long-term structure remains intact.

$META: at the 100 WMANASDAQ:META : I believe April 2025 low started a new 5-wave sequence for $META. Wave 1-2 completed. Wave 1 of 3 completed and it's in Wave 2 of 3 correction.
Wave 2 can retrace very deep. It has already retraced 61.8% of Wave 1. There is also a trendline support formed by connecting 2022 low with April 2025 low.
It's also right at the 100 Week MA.
My count is invalidated if NASDAQ:META drops below the beginning of Wave 1 at $480.
My position
I'm a long term investor of $META. I'm holding my shares. It's already a large position so I do not plan to add. I'm comfortable with just holding my position long term.

QuantSignals V3 | META Counter-Trend CALL SetupMETA QuantSignals V3 – Swing CALL Trade (2025-11-19)
Trade Signal:
Direction: BUY CALLS (Long)
Strike Price: $550.00
Entry Range: $40.80–$41.20 (mid $41.00)
Target 1: $61.20 (50% gain)
Target 2: $71.40 (75% gain)
Stop Loss: $32.64 (20% risk)
Expiry: 2025-12-05 (16 days)
Position Size: 3% of portfolio
Confidence: 65% (Medium)
Market Analysis:
Trend: Oversold bounce play, RSI 17.5
Price Action: Current $41 near bottom of 16-day swing ($581.25–$613.68), MACD bearish but reversal potential
Support/Resistance: Support $574–$581, resistance near $600+
Volume: 1.0× prior swing, normal participation
Options Flow: Neutral-to-bullish, PCR 0.89, unusual $735 put activity
News Sentiment: Mixed – positive SAM 3/3D updates, minor compliance headwinds
Competitive Edge:
Capitalizes on extreme oversold conditions and Katy AI predicted bounce to ~$600+
Balanced risk/reward with 16-day horizon and Delta 0.778
Tight stop limits downside while allowing for recovery
Risk Notes:
Counter-trend play – monitor breakdown below $574 support
Medium conviction due to conflict with composite bearish guidance
Consider scaling in if initial position performs well
Strategy Rationale:
Overrides short-term bearish momentum due to clear oversold conditions, technical support, and Katy AI forecast
Swing horizon allows time for predicted recovery
META: The Reversal Zone | Short term Swing Long Trade PlanThe chart shows the price has fallen sharply and is currently testing a zone where three significant technical features converge:
Long-Term Trend Line (Yellow): The price has fallen back to the long-term ascending yellow trend line. This line represents the primary bullish trend established since the major low (around 2022/2023). A successful bounce here is essential for maintaining the longer-term uptrend.
Horizontal Pivot Line (Pink/White): The current price is sitting directly on the horizontal support/resistance line (pink or white line near the price). This level acted as a strong pivot point in the past, suggesting significant trading interest.
Breakout Retest (Red Line): The price is also re-testing the long-term descending red trend line from which it previously broke out. This former resistance line often turns into new support.
Conclusion: The convergence of the ascending yellow trend line, the horizontal pivot, and the retest of the old red resistance creates an extremely strong confluence support zone in the $573 to $590 region.
Trade Idea:
ENTRY $590 - $598 Enter upon confirmation of support holding (e.g., an intraday reversal candle).
TARGET 1 $652 This is the recent short-term resistance pivot shown on the chart. This is the primary target for a short-term swing trade.

Death Cross - Contrarian BuyRarely does the death cross actually provide a meaningful sell signal given its lagging components and, in some cases, can end up being a better buy signal. I think this is one of those times where META death cross is providing another meaningful buy signal as the price is well below the 200-day moving average. A similar setup was provided in April of this year after the tariff tantrum; this time it's on concerns post Q3 earnings on AI spending return model.
I see price safely returning above the 200-day moving average, then slow grind higher back above the 50- and 100-day moving average would have to be assessed but possible as it was climbing back from April lows. I give this setup a $700 price target which would be respectful under this framework to exit the trade.

ESG & Green Energy Investments1. What ESG Actually Means
ESG refers to a set of standards for evaluating how responsibly and sustainably a company operates. These three dimensions—Environmental, Social, and Governance—serve as a framework to understand non-financial risks that can influence long-term performance.
Environmental (E)
Focuses on how a company interacts with the natural world. Key considerations include:
Carbon emissions and net-zero commitments
Renewable energy usage
Waste management and circular economy practices
Water conservation
Pollution control
Biodiversity impact
Companies that manage environmental risks well are better positioned for regulatory changes, resource scarcity, and the transition to a low-carbon economy.
Social (S)
Covers how a company manages relationships with employees, suppliers, customers, and communities. Factors include:
Labor standards and worker welfare
Diversity and inclusion
Human rights compliance
Customer safety
Community development
Data privacy and cyber security
Strong social practices improve productivity, reduce legal risks, and enhance brand value.
Governance (G)
Refers to corporate leadership and internal controls. Key governance metrics include:
Board independence and diversity
Executive compensation
Anti-corruption policies
Shareholder rights
Ethical conduct
Transparency and accountability
Good governance reduces fraud, mismanagement, and regulatory penalties—factors that directly influence shareholder returns.
2. Why ESG Matters for Investors
There are several reasons why ESG has become integral to investment decision-making:
a. Risk Mitigation
Companies with strong ESG profiles tend to face fewer controversies, regulatory penalties, or reputational setbacks. Climate-related risks—such as extreme weather, carbon taxes, and energy transition timelines—now directly influence asset prices.
b. Superior Financial Performance
Numerous studies show that companies with strong ESG adherence have:
Lower capital costs
Higher operational efficiency
Better long-term profitability
More stable cash flows
Investors increasingly see ESG not as a cost but as a value-creation strategy.
c. Growing Global Regulations
Governments worldwide are mandating sustainability reporting and emissions reduction, pushing ESG integration into standard business practice. For example, the EU’s Corporate Sustainability Reporting Directive (CSRD) and India’s BRSR framework compel listed companies to disclose ESG metrics.
d. Institutional Investor Influence
Pension funds, sovereign wealth funds, insurance companies, and large asset managers now screen investments using ESG criteria. Their portfolios are shifting toward green sectors, influencing global capital flows.
e. Consumer and Market Sentiment
Consumers prefer companies aligned with sustainability. Firms with strong ESG profiles often benefit from brand loyalty and long-term demand stability.
3. Green Energy Investments: The Core of the ESG Transition
Green energy investments refer to capital allocated to renewable and sustainable energy sources such as:
Solar
Wind
Hydro
Geothermal
Biomass
Green hydrogen
Energy storage solutions
Carbon capture and renewable fuels
The energy transition is accelerating as the world moves away from fossil fuels. Several forces drive this shift:
a. Climate Change Imperatives
Global warming concerns and carbon reduction targets under the Paris Agreement have pushed governments to accelerate renewable energy adoption.
b. Declining Renewable Costs
Technology advancements and economies of scale have drastically reduced the cost per unit of solar and wind power, making them competitive with coal and natural gas.
c. Technological Breakthroughs
Innovations in battery storage, smart grids, electric mobility, and green hydrogen are reshaping the energy sector and creating massive investment opportunities.
d. Corporate Clean Energy Demand
Tech giants, manufacturing companies, and industrial firms are increasingly committing to 100% renewable energy to meet ESG goals.
4. Key Green Energy Investment Themes
1. Solar Energy
Solar remains the fastest-growing renewable sector due to falling panel prices and rising adoption across households, industries, and grid-scale plants. Rooftop solar, floating solar, and utility-scale installations represent major avenues for investors.
2. Wind Energy
Both onshore and offshore wind offer strong long-term growth, with offshore wind emerging as a trillion-dollar market driven by advanced turbine designs and coastal infrastructure investment.
3. Green Hydrogen
Seen as the "fuel of the future," green hydrogen can decarbonize heavy industries like steel, chemicals, and shipping. Massive government subsidies globally are accelerating the sector.
4. Electric Vehicles & Charging Infrastructure
EV adoption is surging, supported by clean energy policies and consumer demand. Charging networks, battery manufacturing, and EV components represent high-potential themes.
5. Energy Storage
As renewable usage increases, storage becomes essential to stabilize grids. Lithium-ion batteries, solid-state batteries, and flow batteries are attracting significant investment.
6. Carbon Capture & Utilization
Companies are developing carbon removal technologies to meet net-zero mandates. This includes direct air capture, storage, and carbon-to-fuels technologies.
5. ESG Investing Strategies
Investors approach ESG in several structured ways:
a. Negative Screening
Excluding harmful sectors such as:
Tobacco
Weapons
Coal
Oil & gas
Gambling
Alcohol
b. Positive Screening
Selecting companies with strong ESG scores or leadership in sustainability practices.
c. ESG Integration
Embedding ESG factors into fundamental financial analysis to improve risk-adjusted return potential.
d. Thematic Investing
Focusing on themes such as renewable energy, clean technology, water conservation, electric vehicles, or circular economy.
e. Impact Investing
Investing specifically to achieve measurable social or environmental outcomes alongside financial returns.
f. Best-in-Class Approach
Investing in industry leaders with the highest ESG performance within their sector.
6. Benefits of ESG & Green Energy Investing
Lower long-term risks
Increased portfolio resilience
Exposure to fast-growing sectors
Regulatory advantages
Improved brand value and stakeholder trust
Alignment with global sustainability goals
Potential for long-term outperformance
7. Challenges and Concerns
While ESG investing is powerful, it is not without challenges:
1. Greenwashing
Some companies exaggerate ESG claims without genuine action. Investors must verify data authenticity.
2. Lack of Standardization
Different ESG rating agencies use different methodologies, creating inconsistencies.
3. Short-Term Costs
Sustainability investments often require high upfront capital.
4. Policy Uncertainties
Changes in government regulations can influence renewable project viability.
8. The Future of ESG & Green Energy Investments
The future is characterized by:
Stricter sustainability regulations
Growth of carbon markets
Increased corporate and investor accountability
Scaling of green hydrogen and storage technologies
AI-driven ESG analytics
Trillions of dollars flowing into the global energy transition
ESG and green energy investments are expected to dominate global markets for decades as climate change, technological innovation, and policy support reshape the global financial landscape.

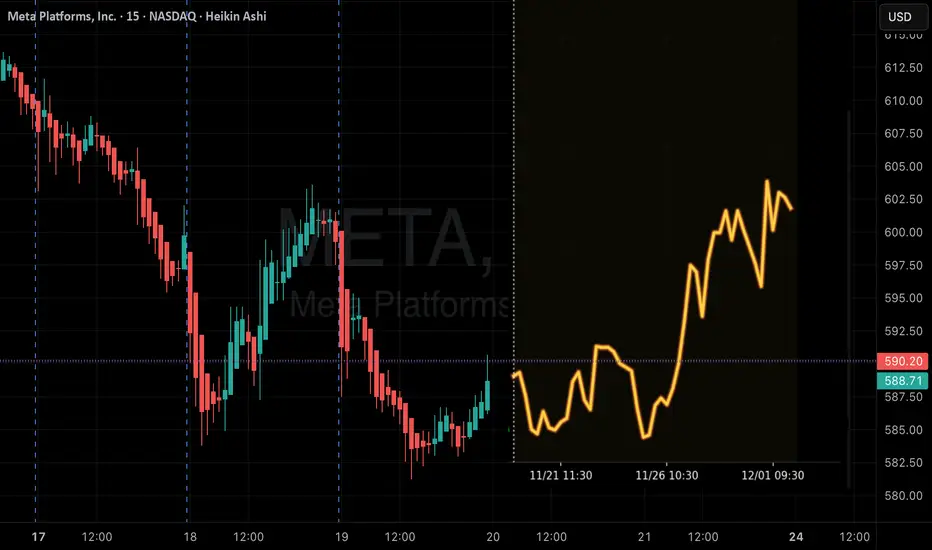
META at a Critical Breakdown Zone – Nov. 211️⃣ 1H Trendline Chart View
META continues trading inside a broad descending channel. Price recently bounced from the lower trendline, but momentum remains weak. Sellers continue to control unless META breaks above 590 and holds.
Key 1H levels:
* 612.5 – major resistance
* 610 – supply
* 590 – pivot
* 587.6 – minor support
* 583.3 – key support
* 581.2 – breakdown level
1H Bias: Still bearish under 590.
2️⃣ 15M Structure View (Smart Planner)
Trend: Bearish
Last Event: Liquidity Sweep (Low)
Bias: Mixed
Premium/Discount: Premium
Mode: Choppy
META remains below EMAs and VWAP. There is a small CHoCH inside a falling wedge, but buyers have not proven strength yet. Multiple supply zones remain overhead from 590 → 600 → 612.
For CALLS: Needs a clean reclaim of 590 with EMAs + VWAP aligned.
For PUTS: Break and retest of 583 confirms downside continuation.
3️⃣ 1H GEX View
GEX flow is still heavily bearish:
* 612.5 – strong CALL wall
* 600 – call resistance
* 590 – major GEX pivot
* 581–575 – highest negative NET GEX (PUT support cluster)
If META stays below 590, negative gamma continues to pull price toward 581–575.
4️⃣ Trade Plan
CALL Setup
* Entry: Reclaim + hold above 590
* Targets: 600 → 612.5
* Stop: Under 587
PUT Setup
* Entry: Reject 590 OR clean break of 583
* Targets: 581 → 575
* Stop: 592–595 depending on entry
Bias for Nov. 21
META stays bearish-to-neutral unless bulls reclaim 590.
Below 590 → sellers control toward 581–575.
Disclaimer
This analysis is for educational purposes only and not financial advice. Trade at your own risk.

Discounted Meta, Overhyped AI RisksMeta’s forward P/E around 20 is very low for the segment. The recent negativity about raising roughly $30 billion through bonds to build its own data centers is misguided. It makes perfect sense: investing in in-house infrastructure strengthens long-term AI capacity and reduces dependence on third-party providers.
META – Trade SetupMETA is currently trading around $596, holding a strong long-term bullish structure despite recent volatility. After a major run in 2024–2025 driven by AI monetization, Reality Labs improvements, and strong ad-revenue guidance, the stock is now consolidating and offering a cleaner risk-reward setup for medium-term buyers.
I’m approaching META with a scaled-entry strategy:
🔹 Entries
• Market entry around $596 to secure position during consolidation.
• $560 as an ideal pullback zone
• $525 as a deep-value re-entry
🔹 Profit Targets
• $645 – retest of local resistance.
• $705 – breakout continuation level.
• $800+ – long-term target aligned with analyst high-end projections and trend extension.
🔹 Disclaimer
This is not financial advice. This post reflects personal analysis and is for educational purposes only. Always do your own research and manage your own risk

META 1HRChart Description – META 1H Analysis
This chart presents a technical breakdown of Meta Platforms (META) on the 1-hour timeframe, highlighting a completed topping structure, a breakdown, potential support zones, and upside/downside targets.
1. Large Rounded Top Pattern (Bearish Structure)
The chart shows a large rounded-top arc, transitioning from green → yellow → red.
This shape indicates momentum exhaustion and a shift from strength to weakness.
Price ultimately broke down under the neckline.
2. Breakout / Breakdown Level
The horizontal yellow dashed line marks a key support level (the “neckline”).
Price broke below this level, confirmed by the red arrow, signaling a bearish breakdown.
3. Support Zones
Two immediate supports are illustrated:
Support 1 (Dotted Green Line)
A near-term rising trendline showing temporary relief or bounce potential.
Support 2 (Higher Dotted Green Line)
A longer-term diagonal support that could act as a deeper bounce point if Support 1 fails.
4. Upside Target
A green target zone around ~700–750 is labeled “TARGET”.
This is likely the projected upside if price reclaims the neckline and begins a bullish reversal.
5. Gap Fill Zones (Bearish Targets)
Two red/orange zones labeled “GAP FILL – TARGET” mark potential downside objectives:
Gap Fill Target 1 (~560–570 area)
First bearish target after the breakdown.
Gap Fill Target 2 (~500–520 area)
A deeper gap and major bearish target if selling fully extends.
These zones represent areas where previous price gaps may attract price back to “fill” them.
6. Current Position
Price is shown around $589–599, sitting just under the breakdown level.
Market sits between support test and gap-fill risk.
Overall Interpretation
The rounded-top formation and clean breakdown suggest bearish momentum.
Price is hovering near initial supports, deciding whether to bounce or continue lower into gap-fill territories.
A recovery above the neckline opens the door to the large $700+ upside target.
Failure at support points likely exposes the two gap-fill zones below.

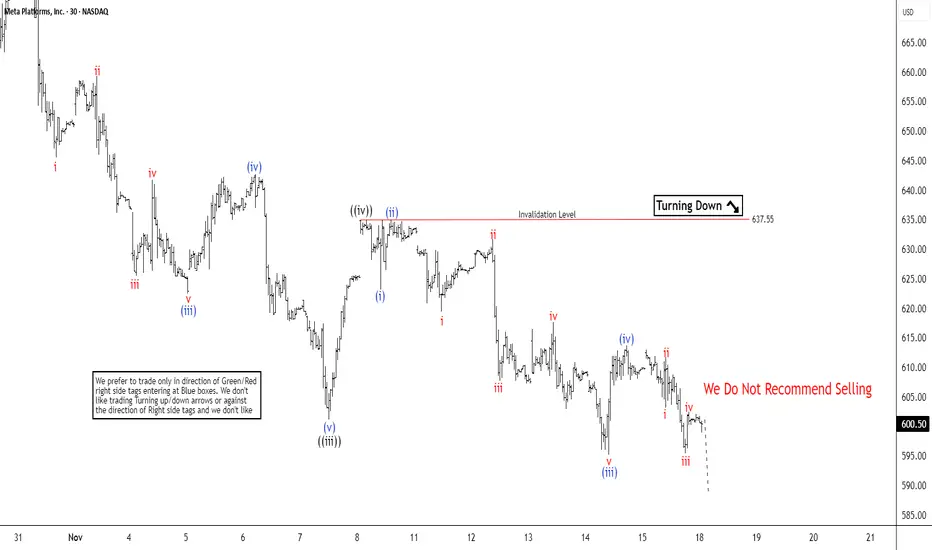
META Eyes Support Base with Corrective Rally PotentialThe short-term Elliott Wave outlook for META indicates that the cycle from the October 29 high remains in progress, unfolding as a five-wave impulsive structure. From the October 29 peak, wave ((i)) concluded at $650.17. A corrective rally in wave ((ii)) then followed which terminated at $680.96. Subsequently, the stock declined in wave ((iii)), reaching a low of $601.20. A rebound in wave ((iv)) then ended at $637.55, as illustrated in the 30-minute chart.
Currently, wave ((v)) appears to be unfolding as a lower-degree impulse. Within this structure, wave (i) completed at $623.23, and a brief rally in wave (ii) ended at $635. The decline resumed in wave (iii), which bottomed at $595.20. It was followed by a modest recovery in wave (iv) that concluded at $613.68. The final leg, wave (v) should extend lower, thereby completing wave ((v)) and the broader cycle from the October 29 high. Upon completion of this five-wave sequence, a minimum three-wave corrective rally should happen to retrace the decline from the October 29 peak. In the near term, as long as the $637.55 pivot remains intact, the stock retains potential for a marginal new low to finalize wave ((v)) and complete the current bearish cycle
Gold & Safe-Haven Asset Trading1. Why Gold Is Considered a Safe-Haven Asset
Gold is perceived as a safe-haven for several reasons:
1.1 Intrinsic Value
Gold is a physical asset with limited supply. It cannot be printed like fiat currency, and mining output grows slowly over time. This scarcity gives gold long-term value stability.
1.2 Universal Acceptance
Gold is accepted globally as a store of value by governments, central banks, banks, institutions, and retail investors. It is one of the few assets that retain value regardless of the political or economic system in place.
1.3 Hedge Against Inflation & Currency Depreciation
When inflation rises or a currency weakens—especially the USD—gold prices tend to increase. This is because investors shift capital into assets that preserve purchasing power.
1.4 Geopolitical Crisis Shield
During wars, conflicts, sanctions, or major political uncertainty, gold attracts strong demand. Institutions rotate out of risk assets like equities and into safer stores of value.
1.5 Negative Real-Yield Environment
When real interest rates (interest rate minus inflation) fall or turn negative, the opportunity cost of holding non-yielding gold decreases, making it more attractive.
2. What Are Safe-Haven Assets?
Safe-haven assets are those that retain or increase value during times of market volatility, economic crisis, or geopolitical stress. The key safe-haven categories include:
Gold
US Dollar (USD)
US Treasury bonds
Japanese Yen (JPY)
Swiss Franc (CHF)
Silver and other precious metals
Sometimes: utilities, consumer staples, defensive stocks
Gold remains the most universal and liquid among them.
3. Key Drivers of Gold Prices
To trade gold effectively, traders must understand the main price drivers:
3.1 US Dollar Index (DXY)
Gold is priced in USD globally.
A stronger USD → gold becomes expensive for holders of other currencies → gold falls
A weaker USD → gold becomes cheaper globally → gold rises
This inverse relationship is one of the strongest correlations in global markets.
3.2 Interest Rates (Especially US Treasury Yields)
Gold does not pay interest. When yields rise, gold becomes less attractive.
Rising yields → bearish for gold
Falling yields → bullish for gold
Real yields matter more than nominal yields.
3.3 Inflation
Gold is a traditional inflation hedge.
Higher inflation → gold demand increases → gold prices rise
Low/deflation → gold weakens
3.4 Geopolitical & Financial Risks
Gold spikes during:
wars
banking system stress
sovereign debt crises
market meltdowns
oil price shocks
trade wars
currency crises
Gold thrives when uncertainty rises.
3.5 Central Bank Gold Purchases
Many central banks buy gold to diversify reserves away from the USD.
Large purchases by China, India, Russia, and emerging markets support gold prices.
3.6 ETF Flows
Gold-backed ETFs (like SPDR Gold Trust – GLD) influence prices through physical purchasing.
4. Gold Trading Instruments
4.1 Spot Gold (XAU/USD)
The most traded instrument in gold markets.
XAU/USD represents gold priced in U.S. dollars.
4.2 Gold Futures (COMEX)
Highly liquid and used by institutional investors and hedgers.
4.3 Gold ETFs (GLD, IAU)
Useful for passive investors or those who want gold exposure without physical storage.
4.4 Gold Mining Stocks
Companies like Barrick Gold, Newmont etc.
Mining stocks are leveraged plays on gold prices.
4.5 Physical Gold (Bars, Coins)
Used mostly for long-term wealth preservation.
5. Safe-Haven Flow Dynamics
Understanding how capital flows during crises is key.
5.1 Risk-Off Environment
When market fear rises:
Equities fall
Bond yields drop
USD and gold rise
Gold attracts capital as a non-correlated asset.
5.2 Risk-On Environment
When markets recover:
Equities rise
USD strengthens
Gold often consolidates or corrects
Safe-haven demand decreases.
6. Trading Strategies for Gold & Safe-Haven Assets
6.1 Trend Following Strategy
Since gold often moves in strong directional trends:
Use moving averages (50/200 EMA)
Buy when price is above key MAs and forming higher highs
Sell when price breaks below MAs with strong volume
6.2 Breakout Strategy
Gold reacts strongly to breakouts from:
price consolidation zones
triangle patterns
wedge patterns
horizontal ranges
A breakout with high volume can signal a strong move.
6.3 Mean Reversion (Contrarian) Strategy
Gold frequently retraces after sharp moves.
Indicators:
RSI (overbought/oversold)
Bollinger bands
Price divergence
Use cautiously during trending markets.
6.4 Macro-Based Trading
Use fundamental triggers:
Fed interest rate decisions
CPI inflation releases
NFP jobs report
Geopolitical events
Central bank speeches
These can cause rapid volatility in gold.
6.5 Safe-Haven Correlation Trading
You can trade gold relative to:
DXY movements
US 10-year yield changes
JPY or CHF moves
VIX index spikes
When volatility rises, gold usually rallies.
7. Gold in Portfolio Diversification
Gold is one of the best hedges against:
inflation
currency weakness
economic slowdowns
stock market crashes
Historically, gold has low correlation with equities, making it ideal for diversification.
Portfolio strategies:
5–10% gold allocation for stability
15–20% during high inflation periods
Use gold to hedge global macro risks
8. Risks in Gold Trading
Despite being a safe-haven, gold trading carries risks:
8.1 High Volatility
Gold can move sharply around:
CPI
NFP
Fed meetings
geopolitical headlines
8.2 Interest Rate Shocks
An unexpected spike in yields can cause large downside in gold.
8.3 USD Strength
A strong, sudden USD rally can drag gold lower.
8.4 False Breakouts
Gold sees many fake breakouts due to liquidity-driven algorithmic trading.
8.5 Over-leveraging
Leverage in futures or CFDs can magnify losses during volatile phases.
9. Long-Term Outlook for Gold
Over decades, gold generally trends upward due to:
global inflation
rising debt levels
currency debasement
central bank gold accumulation
geopolitical risks
The long-term picture remains bullish, but short-term volatility is normal.
Conclusion
Gold and other safe-haven assets play a critical role in global financial markets, serving as stabilizers during periods of uncertainty and volatility. Gold remains the most trusted safe-haven due to its intrinsic value, global acceptance, and strong historical performance during crises. Understanding the correlations between gold, interest rates, USD, inflation, and market sentiment enables traders to anticipate market movements and trade profitably. Whether using technical setups, macro analysis, or multi-asset safe-haven flows, gold trading offers opportunities for both short-term traders and long-term investors. However, managing risk, avoiding over-leverage, and monitoring global macro signals are essential for success in gold markets.
Midterm Stock Forecast for METANASDAQ:META At $594, Meta enters a buy zone after the sharp decline since late October. H1 technicals show stabilizing momentum. First target stands at $660, and extension toward $760 remains possible if ad revenue and AI-driven engagement trends stay strong. Valuation still supports midterm upside after the recent correction.

I started looking for META callsWhile price makes new lows ($597), the Accumulation/Distribution momentum has flipped from Neutral to Green. This divergence suggests "smart money" absorption or passive limit-order buying is starting to occur under the surface.
Meta Platforms (META) – Strong Reaction at Key Demand ZoneMETA has retraced sharply and is now testing a major demand zone around 600 – 585, aligned with the 0.236 Fibonacci level (597). This area represents the first strong support after the recent corrective wave.
The latest candles show early signs of buyer interest, suggesting that the market may attempt a rebound if this zone continues to hold.
If META confirms support here, the next upside levels are:
637 (0.333 Fib)
665 (0.4 Fib)
707 (0.5 Fib)
749 – 755 (0.618 Fib)
811 (0.75 Fib)
A daily close below 585 would signal further weakness and expose the next downside level near 561 (0.15 Fib).
As long as the demand zone holds, the bullish recovery scenario remains valid, with the long-term target set at 916.23.

META: Daily Oversold, Weekly Vulnerable — Key Levels to WatchBull Case:
META is testing a long-term ascending trendline and a major demand zone between $579–$595. Daily RSI is oversold, suggesting a potential short-term reversal. If buyers defend this level, key upside pivots sit at $635, followed by $676–684, and a full mean-reversion target near $691. The broader uptrend remains intact as long as the stock holds above $562.
Bear Case:
While the daily chart is positioned for a bounce, the weekly structure is still weakening. META has lost multiple EMAs on the weekly timeframe, momentum remains bearish, and weekly RSI has broken its bull range. A breakdown below $579 opens downside continuation toward $562 and $548, with deeper support near the mid-$400s if selling pressure accelerates.
Summary:
The daily chart shows potential for a near-term rebound, but the weekly trend still favors caution. A sustained close back above $635 strengthens the bullish scenario, while a failure to hold $579 shifts control firmly to the bears.
Key Levels to Watch
Bullish Levels
$595 / $579 — must hold (trendline + demand)
$635 — first resistance / short-term trend flip
$676–$684 — major supply zone
$691 — full mean-reversion target
Bearish Levels
$579 — breakdown trigger
$562 — next liquidity zone
$548 — deeper support
$480s — weekly structural support if selling accelerates
How the Stock Is Leaning:-
Short-term (daily): Leaning bullish for a bounce — oversold, testing major support.
Medium-term (weekly): Leaning bearish — trend damaged, EMAs rolling over, RSI in a downtrend.
Overall: Two-timeframe divergence. Daily wants a reversal, weekly still argues for lower levels unless $635 is reclaimed.

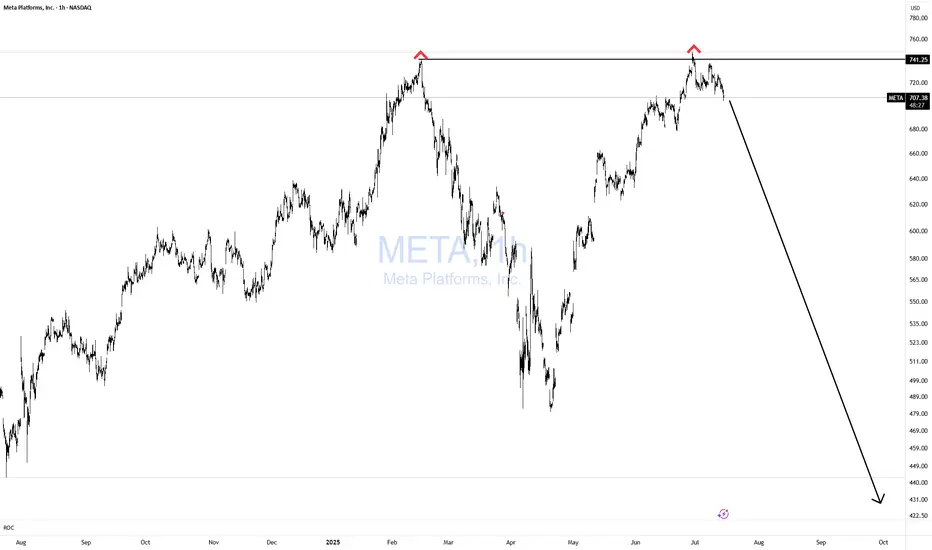
META Double Topping!Does it get any easier than this? NOPE!
If you can't spot this pattern from 1000 miles away, then you need a lot more time in the seat, training yourself in TA.
Simple with great risk reward!
Bulls GTFO!
Facebook (Meta) dip-buying momentum points to rebound this week
Current Price: $588.18
Direction: LONG
Confidence Level: 70% (Several professional traders highlight strong fundamentals and are actively buying dips; X sentiment leans bullish despite recent pullback)
Targets:
- T1 = $605.00
- T2 = $625.00
Stop Levels:
- S1 = $580.00
- S2 = $570.00
**Wisdom of Professional Traders:**
Bringing together the collective insights of numerous professional traders, the consensus is that Meta’s recent 20–27% pullback from the $750 highs is creating a buying opportunity. Many traders are accumulating positions below the $615 level, noting that the fundamentals—$189 billion in revenue, $58 billion net income, aggressive AI infrastructure investment—remain intact. Several traders characterize Meta as deeply undervalued compared to other tech peers, with fair values well above current prices. This crowd wisdom suggests the stock has room for a short-term rebound.
**Key Insights:**
The main thing I’m watching is the aggressive dip-buying discussed in multiple analyses. Several traders pointed out that the 20–23% correction from recent highs has brought the price into a strong support zone around $580–$590. This level has been mentioned repeatedly as a line-in-the-sand for stopping further downside. The bullish bias is reinforced by the fact Meta’s P/E ratio is far lower than that of many speculative tech names, giving it more resilience during market volatility.
What’s interesting is that despite near-term technical weakness (trading below the 233-day moving average), the majority of traders I’ve tracked believe this is a short-term oversold condition rather than the start of a deeper downtrend. Combining that with X sentiment showing a majority of bullish tweets suggests momentum could turn higher quickly if that support holds.
**Recent Performance:**
This all played out in the price action last week—Meta slid from $615 toward $580, marking over a 20% drop from its October highs. Large-volume selling early in the week was met with accumulation by dip buyers towards Friday. For context, this correction is in line with other Magnificent Seven stocks, but traders note Meta’s relative value is stronger than most, making it a prime candidate for a bounce.
**Expert Analysis:**
Multiple professional traders are watching for a rebound toward $605–$625 in the short-term, citing repeat tests of the $580–$590 support zone. Several identify upside catalysts in AI and infrastructure expansion, alongside share buybacks, which could bolster earnings per share. The trader consensus often references fair value estimates well above $660, meaning this week’s targets remain conservative, focusing on achievable levels based on near-term technicals.
The $615 line is widely watched as the first hurdle for upside momentum; closing above it would likely trigger heavier buying.
**News Impact:**
Recent headlines around Meta’s half-trillion-dollar AI data center investment over the next three years are bolstering long-term sentiment. While there have been concerns about high capital expenditures and VR product traction, these haven’t shaken long-term bullish fundamentals. The market’s reaction to the pullback appears more tied to sector-wide tech corrections than company-specific weakness. This creates an environment where news about AI initiatives and user scale—3.5 billion daily active users—could serve as upside catalysts.
**Trading Recommendation:**
Here’s my take: with strong underlying fundamentals, visible accumulation at current levels, and bullish sentiment on X, I’m going LONG Meta this week. I’d enter here with partial allocation, aiming for $605 first and $625 as a secondary target, keeping stops tight at $580 and $570 to protect against a breakdown. Position sizing should account for potential continued volatility in tech stocks, but given the widespread trader consensus on undervaluation and the clear support zone, the risk-reward here looks favorable for a short-term bounce.

#META The Next WaveHello everyone, I hope you are all well
Today I will be updating MetaTrader's stock for the coming months. The price has risen significantly after the recent crash, which was due to inflation and other geopolitical factors. I previously predicted the bottom, and the stock has reached almost all of its targets. You can see the idea below. Now I expect to see a decline in the coming months, and the targets are as outlined in the analysis. Warning: Be careful about using leverage. This is because we may see manipulation before the drop, and this will cause you losses
When I predicted the bottom previously
