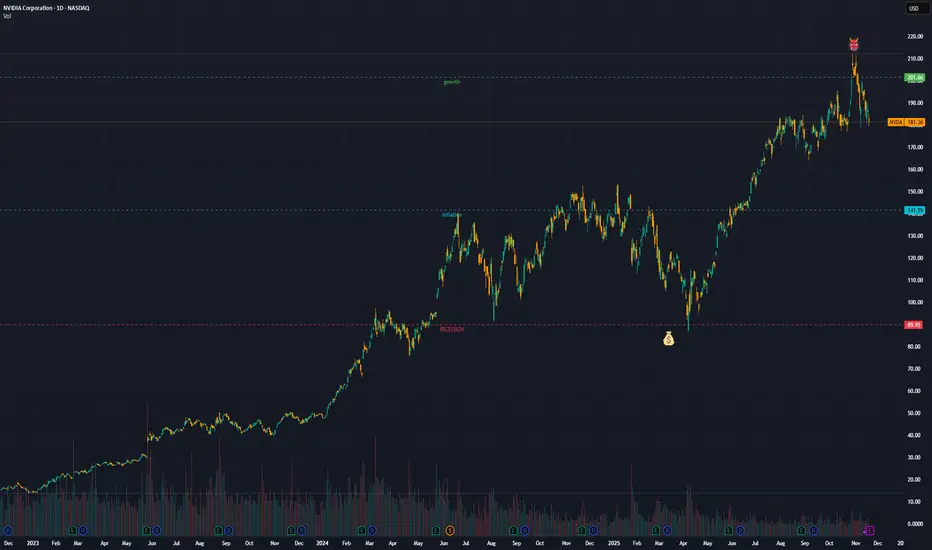
Nvidia Earnings Finally Ease Market Jitters. Are AI Bulls Back?It’s confirmed. This is Nvidia’s stock market and we all live in it.
Nvidia NASDAQ:NVDA reported yet another record-breaking quarter, instantly soothing market nerves after a week filled with talks of “AI bubble,” “valuation fever,” and “maybe Michael Burry is right again.” It was the cherry of the earnings season .
The chipmaking giant announced $57 billion in sales during the most recent quarter.
The figure is up 62% year-over-year and way above estimates. In other words, Nvidia didn’t just calm the market. It kicked the door open and shouted: “Get in losers, we’re going shopping.”
CEO Jensen Huang was even more enthusiastic, declaring that “AI is going everywhere, doing everything, all at once.” In classic Huang fashion, you could almost smell the leather jacket.
💽 Data Center Demand: Still Insatiable
Let’s cut to the headline number: $51.2 billion in data-center revenue. Analysts expected $49 billion. Nvidia delivered more.
The company’s new Blackwell GPUs, described by Huang as “off the charts” when it comes to demand, continue to fly off the production line the moment they’re made.
Quarterly net income hit a whopping $31.9 billion, up 65% from the year prior. At a time when most companies celebrate single-digit percentage growth, Nvidia is casually stacking double and triple digits.
📈 Markets Exhale, Futures Soar
The relief was immediate and widespread. You could say that Nvidia’s earnings are not just earnings anymore, but a macro signal.
Here’s what the picture looked like after the release:
CoreWeave NASDAQ:CRWV jumped 10%
Futures tied to the Nasdaq NASDAQ:IXIC climbed 2%
Every Magnificent Seven stock flashing green
Investors had been waiting for confirmation that the AI boom still had room. And Nvidia delivered enough reassurance to light up the entire tech complex.
“Okay. Maybe we don’t need to rotate into utilities just yet,” every tech bro, probably.
😬 The Stakes Were High. Really High.
The reaction, though, must be taken within the current context. Over the past few weeks, tech stocks were hit by deep selloffs as markets fretted over the same question: “Is AI too expensive?”
Between skyrocketing capital expenditures, absurdly ambitious data-center budgets, and the kind of spending plans that would make even sovereign wealth funds blush, investors wondered whether Big Tech was building an AI future or an AI money pit.
Even Michael Burry stepped in, revealing positions betting against Nvidia NASDAQ:NVDA and Palantir NASDAQ:PLTR . That move alone sent pockets of the market into a philosophical crisis.
After all, that’s the guy from “The Big Short” and he’s hedged against your favorite trade.
🤖 So… Are the Bulls Back?
Maybe. For now at least. But with conditions.
Nvidia’s stock more than doubled between April and late October, only to slide in recent weeks as bubble fears thickened. Year to date, the stock is still up about 30%.
Nvidia’s numbers prove that AI spending is still accelerating. But the broader question remains: Can companies actually turn those massive AI investments into profit?
Nvidia’s blowout quarter just reset the narrative:
AI demand is still real
Spending is justified
The cycle is still “virtuous,” in Huang’s words
After this earnings print, the bull case has something it desperately needed: momentum.
And momentum is a powerful thing, especially in a market that had started to doubt its favorite story.
Off to you : Do you still see room for growth in the AI space? Or is that rebound a short-term reflex? Share your views in the comments!
Trade ideas

Nvidia - Now is the time to go short!💣Nvidia ( NASDAQ:NVDA ) is now creating a top:
🔎Analysis summary:
Just a couple of days ago, Nvidia perfectly retested a major resistance trendline. Always in the past, such a retest was followed by a major move towards the downside. Therefore, Nvidia is preparing for a major drop, which could lead to another -25% drop in the future.
📝Levels to watch:
$180 and $140 and $100
SwingTraderPhil
SwingTrading.Simplified. | Investing.Simplified. | #LONGTERMVISION

NVDA Sitting on Critical Demand — Bounce or Breakdown? (Nov 19)NVDA has been sliding straight down inside a clean descending channel, and now price is pressing right into the major daily demand zone around 176–184. This is the same zone that saved NVDA back in September and October.
Tomorrow (Nov 19) will be all about whether buyers finally show up — or if this demand gets taken out and the next leg down begins.
📌 NVDA — Daily Structure (1D)
NVDA is sitting right on top of the rising macro trendline. This structure has held for months, so this is a real decision point.
Key levels:
* 184–186 → top of demand
* 176–178 → deeper sweep
* 164 → next liquidity if demand breaks
As of now, price hasn’t reacted strongly. It’s still controlled selling. This zone is the “make or break” for NVDA’s trend.
📌 NVDA — Intraday Trend (1H)
Your 1H chart is clean: lower highs, lower lows, and perfect trendline respect.
Short-term zones for tomorrow:
Resistance:
* 184–186 → first lid
* 190–192 → major lid + trendline rejection zone
Support:
* 177.5 → HVL + GEX support
* 175–176 → liquidity sweep
* 170 → next magnet if selling accelerates
Unless NVDA clears 186, the intraday trend stays bearish.
📌 NVDA — GEX Roadmap for Nov 19
This is the key layer for tomorrow’s behavior.
CALL Walls / Resistance
* 192 → primary wall
* 195 → secondary
* 200–207 → high resistance cluster
PUT Support / Downside Risk
* 178 → strongest support
* 175 → heavy put wall
* 170 → could magnetize if pressure increases
NVDA is literally sitting on the 178 region at the close.
📈 Bullish Scenario (Bounce)
NVDA must hold 177–180 early in the session.
If buyers defend demand:
1. Break above 184–186
2. Push into 190–192
3. Break 192 → momentum can extend toward 195 → 200
But no reclaim = no upside.
📉 Bearish Scenario (Continuation)
If NVDA opens weak or rejects 184–186 again:
1. First target → 177.5
2. Lose 177 → 175
3. Lose 175 → vacuum into 170
Structure stays bearish as long as we remain below 186.
🔎 My Outlook for Nov 19
NVDA is sitting on strong demand, but there’s still no real bounce.
GEX bias is neutral → leaning bearish unless we break above 186.
Bias:
* Neutral → Bearish below 186
* Bullish only above 190
Watch 186 early — that level decides everything.
📌 Summary
* Daily demand: 176–184
* Intraday trend: Bearish
* GEX support: 178 → 175
* Resistance above: 186 → 190 → 192
* Bearish continuation below 180
* Bullish only if NVDA reclaims 186 → 190
⚠️ Disclaimer
This analysis is for educational purposes only. Not financial advice. Always trade your own plan and manage risk carefully.

Continuation of the "AI Bubble" A chart for NVDA that illustrates the parabolic curve on this very large timeframe
To expect a curve like this to break is unlikely
AI will have huge implications
The potential of AGI aswell is huge for humanity in general. I don't see a bubble at all.
Weekly timeframe

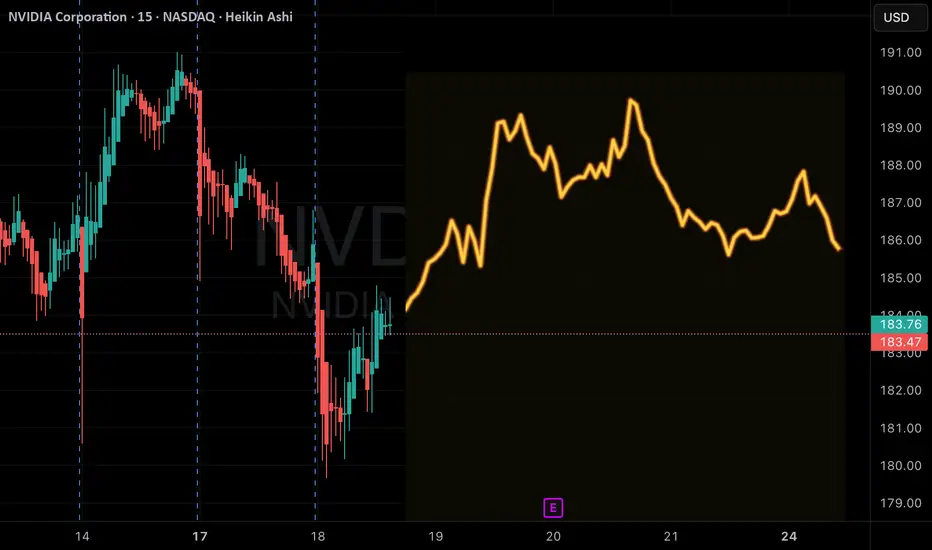
NVDA – First Signs of Stabilization After a Heavy Selloff (11/17NVDA finally showed the first real sign of stabilization after multiple days of controlled selling. The move off the lows wasn’t random — when you zoom into the different timeframes and combine it with the GEX landscape, the bounce actually makes a lot of sense. NVDA dropped right into a deep put zone, bottomed, and then climbed back with intent.
Let’s break down what’s really happening here.
1️⃣ 1-Hour Chart — Downtrend, but Buyers Finally Stepped Up
The 1H chart shows NVDA breaking every minor support for days, sliding cleanly down the descending channel. The selling pressure cooled only when price touched the 178–181 region. That’s where the trendline support met previous liquidity pockets, and buyers reacted instantly.
What’s notable is how quickly NVDA recovered back toward 190. That tells me two things:
1. Sellers covered aggressively at the low.
2. Buyers were waiting to step in near that trendline.
Important 1H levels:
* 190–192: First resistance test
* 194–195: Critical zone NVDA couldn’t reclaim last time
* 199–202: Bigger resistance if momentum expands
* 178–181: Strong demand zone that started the bounce
The 1H is showing the first shift from “straight down” to “controlled bounce.”
2️⃣ 15-Minute Chart — Momentum Turning Upward, but Needs Confirmation
The 15M chart shows NVDA reclaiming multiple small bullish FVGs on the way up. The most important part is how NVDA handled the intraday pullbacks — each dip was shallow and got bought quickly.
That’s what early reversal behavior looks like.
Key things I see on the 15M:
* Bullish FVGs forming under price → buyers absorbing dips
* Short-term resistance at 191–192 → price hesitating here
* Trendline reclaim gives NVDA room to test higher
The 15M doesn’t confirm a strong uptrend yet, but it shows a clear shift in character from sellers dominating to buyers at least competing.
3️⃣ GEX (1-Hour) — Explains Exactly Why NVDA Bottomed Where It Did
This is the part that ties the entire move together.
NVDA bounced precisely at the deep PUT wall around 178–181, where hedging pressure spikes. That’s why the reversal there was so sharp.
Upside Gamma Levels
* 191: First GEX pull
* 194–195: Heavy GEX cluster
* 200–203: 2nd call wall
* 210: Large GEX10 + 3rd call wall
If NVDA can reclaim 194–195, the move toward 200–203 becomes much easier than it looks on the chart alone.
Downside Gamma Levels
* 182: Pivot zone
* 178: Main put wall — the exact level that stopped the selling
* 175–170: Only activates if NVDA loses 178 decisively
The GEX structure is clean:
* Sellers lose power above 192
* Buyers lose control below 182
* Real battle zone sits between 188–192
This is the kind of GEX map that makes traders ask:
“Why does NVDA always bounce or stall at the same weird levels?”
(And yes — GEX gives the answer.)
🎯 How I’m Trading NVDA for 11/17
🔼 Bullish Scenario (Preferred Only Above 192)
NVDA needs to clear 192 with strength. If that happens:
Stock Trade Idea:
* Entry: 192.20–192.50
* Targets:
* 194
* 195
* 198
* 200–203 (call wall zone)
Options Idea:
* 195C or 200C
* Momentum-based trade IF NVDA reclaims 192 with volume
* Scale at each GEX zone
This is the cleanest setup.
🔽 Bearish Scenario (Only Valid If NVDA Rejects 192 or Loses 182)
Entry #1 (Aggressive):
* Rejects 192 → short into 188
Entry #2 (Stronger Confirmation):
* Break below 182
Targets:
* 180
* 178 (strong put wall)
* 175 (if volatility spikes)
Options Idea:
* 185P for quick moves
* 180P for continuation
* Below 178 → downside accelerates sharply
⚠️ Chop Zone: 188–191
This is the balance area where NVDA is likely to pause, fake out, and trap both sides.
Best avoided unless you’re scalping with tight risk.
Final Thoughts
NVDA finally caught a real bid after a long series of lower highs and lower lows. The bounce wasn’t accidental — it aligned with deep GEX put walls and a structural trendline. Now NVDA sits right below a key resistance at 192. That’s the line that decides whether this becomes a real reversal or just another lower high inside the downtrend.
Above 192 → the chart opens beautifully.
Below 182 → the bears take back control.
Anything between is noise.
Disclaimer
This analysis is for educational purposes only and does not constitute financial advice. Always trade with proper risk management.

NVDIA - Earnings Setup for This WeekHello Everyone , Followers,
NVDIA will release its financial reports on Wednesday after market closed. I would like to share my view and follow up level depends on good and bad reports
Bullish Scenario
If earnings beat + guidance strong → next target: 221 - 222
Bearish Scenario
Weak numbers → potential drop to between 173.00 - 176.00
🔹 Key Support Zones
First support: 184.00
Deeper support: 173.00
🔹 Resistance Levels
Main resistance: 199.00 - 200.00
Breakout target: 221 - 222
🔹 Outlook
As long as It stays above 190.00 , momentum remains bullish.
A breakdown below that level could open the door for a deeper pullback. This is depends on Results of financial reports.
🔹 My Plan
I will wait for the financial report before i buy it . With a bearish scenario my buy level is between 176-173 then probably i will hold it for next 5 years.
If it can achive to stay above 190 and if you like to take a risk then you can buy it above this level .
If you enjoy and like clean, simple analysis — follow me for more.
Have a lovelly and Sunny Weekend to all.
Ahead of Nvidia’s (NVDA) Earnings: How the Price Could MoveAhead of Nvidia’s (NVDA) Earnings: How the Price Could Move
On Wednesday, after the close of the main US trading session, Nvidia will release its quarterly results — a report seen not merely as another batch of corporate data but as a crucial test for the entire AI-driven bull run.
NVDA shares are up more than 40% since the start of the year, and the company must now prove that this surge is justified and that the AI revolution is still accelerating. According to media reports, Wall Street analysts remain optimistic:
→ Revenue: forecast around $54.9bn, implying roughly 56% year-on-year growth.
→ Earnings per share (EPS): about $1.25 (previous quarter: $1.05).
What should investors focus on?
Of particular importance will be:
→ data on Data Centre revenue, a key indicator of whether the AI boom remains intact;
→ forward guidance, as the market is looking for reassurance that Big Tech will continue to spend heavily on AI.
Technical Analysis of the Nvidia (NVDA) Chart
Recent price action in NVDA points to a sequence that can be interpreted as bearish:
→ 28 October: a strong rally above the psychological $200 level;
→ a failure to hold above that barrier;
→ a pullback on rising volumes (Nasdaq data) with expanding candles in early November.
In the broader market context, it is notable that early November has seen NVDA underperforming major equity indices, signalling firm resistance from sellers around $200.
From a bullish perspective, the decline from the all-time high resembles a correction pattern (shown in red) within a larger uptrend.
However, there is a risk that the market’s high expectations will not be met when the earnings report is published. If that happens, NVDA could extend its decline towards the lower boundary of the rising channel, where support lies near $165.
This article represents the opinion of the Companies operating under the FXOpen brand only. It is not to be construed as an offer, solicitation, or recommendation with respect to products and services provided by the Companies operating under the FXOpen brand, nor is it to be considered financial advice.

NVIDIA is CISCO 2.0 NVIDIA is a $20-$30 Stock without the Data Centers. There is zero demand for Data Centers. We are seeing the second Dot.com Bubble. NVIDIA is CISCO 2.0. CISCO dropped 80-90% after the Dot.com price discovery happened. This is coming in 2026.

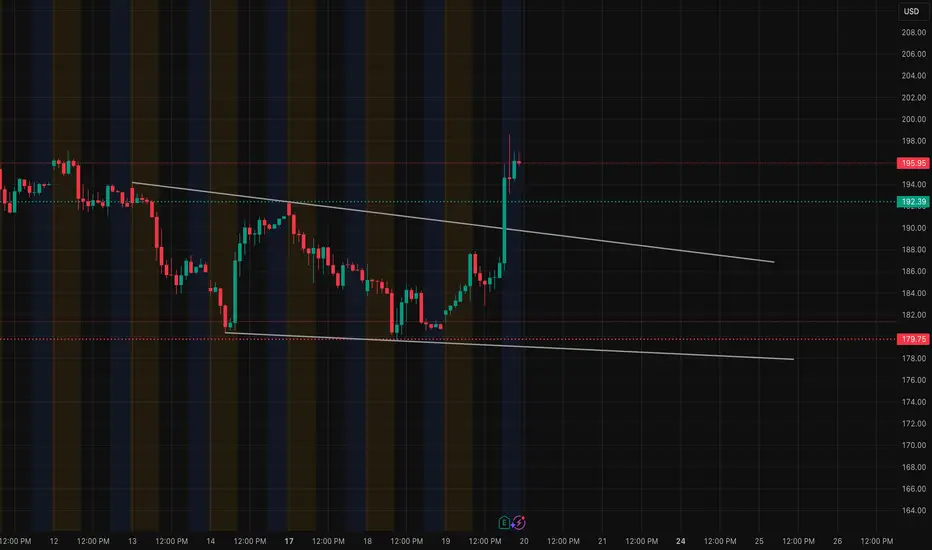
NVDA – Breakout or Pullback Setup? Nov. 20 Trade Plan1-Hour Outlook (Main Bias)
NVDA broke out of a multi-day descending channel and pushed straight into the 195.50–196 zone, which previously acted as heavy resistance on the 1-hour chart. The impulse was strong, reclaiming several key structure levels in one move.
1H Structure
* NVDA printed a strong bullish BOS after breaking the channel trendline.
* Price is currently consolidating near 195.95, right under the 200 psychological level.
* Momentum remains strong, with MACD expanding upward after a fresh crossover.
* Stochastic is elevated but not rolling over yet. Buyers still in control.
1H Key Levels
Breakout trigger: above 196
Upside targets:
* 200.00 (major psychological + GEX resistance)
* 202.50–203 (thin liquidity zone)
Support zone: 187.50–188
Bears gain control only below: 182.80
1H Trading Idea
Bullish scenario:
If NVDA holds above 192.50–193.00 and reclaims 196 cleanly, momentum favors an extension toward the 200–202.50 zone. Break above 200 opens the next leg of gamma pressure.
Bearish scenario:
Valid only if price rejects 196 with a full-body reversal candle. Downside magnets sit at 192 and 188.
15-Minute Outlook (Execution Timeframe)
NVDA is consolidating after a strong vertical impulse. Price formed a BOS on the 15M and is now pulling back slightly into the minor supply zone at 195–196.
15M Structure
* Clean sequence: CHoCH → BOS → impulsive breakout → consolidation.
* EMAs are stacked bullish and acting as dynamic support.
* The recent FVG at 191.50–192.20 held well, confirming bullish continuation structure.
15M Trading Setups
Bullish entry:
* Prefer retrace into 193.80–194.30
* Look for bullish engulfing or a wick rejection
* Targets: 196 → 200
* Stop: below 192.70
Breakout entry:
* Enter on clean break of 196
* Stop below last swing low
* Targets: 198.50 → 200–202
Bearish scalp:
* Only valid if NVDA repeatedly rejects 196
* Target: 193.50
* Invalid if price breaks 196
GEX Confirmation
Based on the NVDA GEX chart:
Bullish Signals
* Highest positive NETGEX sits at 200, creating a natural upside magnet.
* Large call walls at 196, 200, 202.50, supporting upward drift.
* Positive GEX blocks (GEX9, GEX10) align with continuation toward 200–203.
* Put walls are weak above 188 — little downside defense for bears.
Interpretation
GEX strongly favors upside continuation as long as NVDA remains above 192–193.
A break above 196 triggers dealer hedging, pushing price toward 200.
Options Trading Plan (GEX-Based)
Bullish Plan
If price breaks above 196 with momentum:
Contracts to consider:
* 197.5C
* 200C
Targets:
* 198.50 → 200 → 202.50
Reason:
Above 196, market makers are forced to hedge upward, accelerating price toward the strongest GEX cluster at 200.
Bearish Plan
Only valid if NVDA rejects 196 with strong selling:
Contracts to consider:
* 193P
* 190P
Targets:
* 193.50 → 192.00
Reason:
Below 193, GEX becomes lighter and liquidity flows toward 188.
Final Bias for Nov. 20
NVDA is showing strong bullish structure after breaking the descending channel.
As long as price holds above 192–193, the probability of testing 196 and pushing toward 200 remains high.
Bearish setups only activate with a clean rejection at 196.
Disclaimer
This analysis is for educational purposes only and not financial advice. Always perform independent research and manage risk appropriately.
Concerns on market specifically NVDA - Not financial adviceSome thoughts and concerns watching the market as an amateur investor looking at historical shifts and trends. This is not a prediction and not to be considered financial advice in any manner shape or form. It is simply a personal opinion based on my impression of the market. Please discuss any choice you make in the market regarding trades with a financial advisor or planner as this opinion is just an uneducated perspective to be taken with a grain of salt from someone who does not work in the financial industry. There are several factors I have taken into account regarding the economy, job losses, looming Debt Wall, real estate market concerns, tariff pain points for US, recession chatter, dollar weakness, US debt and my personal gut check.
Disclosure - I do not currently hold NVDA but I have a standing buy order for my personal account for NVDA at $50. I do not know the market well enough to short.

NVDA Earnings Setup – Massive Opportunity AheadNVIDIA NASDAQ:NVDA has surged +48% since our last analysis, continuing to lead the AI rally with exceptional momentum. Now, all eyes are on earnings—and the setup is massive. The options market is pricing in a ±7.5% implied move, which could mean a $345B shift in market cap. That’s one of the biggest potential earnings moves in history.
🔥 Key Catalysts:
Strong institutional buying
AI/data center demand in focus
Sky-high expectations priced in
💡 Trade Setup:
Entry: $180–$182
Take Profit Targets: $200 / $210
Stop Loss: $174
This is a high-volatility event. Manage risk accordingly and size positions carefully.

NVDANVIDIA is still in an uptrend. Last week, the price hit a new high of $210, but the price was unable to break through this level, so it adjusted down. It is expected that the price will likely test the important support zone at $167-155. If the price cannot break through $155, the price still has a chance to rise.
However, if the price continues to rise in the near future, a correction may also occur.
Long-term trading plan: Wait for the correction to complete before buying.
** This is not financial advice.
🔥Trading futures, forex, CFDs and stocks carries a risk of loss.
Please consider carefully whether such trading is suitable for you.
>>GooD Luck 😊
❤️ Like and subscribe to never miss a new idea!

Elliott Waves Don’t Lie: NVDA’s Path to $26,000Summary: “Elliott Waves, Fibonacci, and Smart Money align perfectly — NVIDIA’s long-term chart points to an AI-powered Supercycle with massive upside." 💎📊
🚀 NVDA | The Supercycle of the AI Era! 💚
🌀 Elliott Wave Supercycle Breakdown
NVIDIA’s price action over the past two decades is a textbook example of a multi-decade Elliott Wave Supercycle — where technical , fundamentals , and Smart Money flows perfectly align to form a once-in-a-generation structure 🌎
Let’s break it down step-by-step 👇
Super Cycle Wave (1) — launched in the early 2000s, marking NVDA’s first growth phase during the birth of consumer GPUs 🎮.
Super Cycle Wave (2) — deep correction into 2002, retracing a 0.786 Fibonacci, cleansing early euphoria and creating the foundation for institutional accumulation 💼.
Then began the Super Cycle Wave (3) — the most powerful phase of all. Within it, we have distinct macro sub-waves:
1️⃣ Macro Wave (1) — ended in 2007 , aligning with the first institutional wave of adoption.
2️⃣ Macro Wave (2) — retraced 0.618 in 2008 , coinciding with the global financial crisis (perfect Smart Money shakeout).
3️⃣ Macro Wave (3) — the current dominant leg, fueled by exponential AI and data center growth . It’s extending toward the 3.618 Fibonacci extension (~$256) , confirming wave strength and institutional conviction.
4️⃣ Macro Wave (4) — expected between 2026–2027, likely retracing 0.236–0.382, a natural cooling period before the next breakout.
5️⃣ Macro Wave (5) — projected to rally toward 4.618 extension (~$2,500) , completing Super Cycle Wave (3) near 2029 🏁
From there, a larger Super Cycle Wave (4) correction could unfold before the final parabolic Super Cycle Wave (5) run to the 5.618 Fibonacci extension (~$26,000) — the climax of NVDA’s decades-long AI expansion super-trend 🌕
💰 Smart Money Concept (SMC) Perspective
The chart structure clearly shows Smart Money accumulation patterns in every correction phase:
Re-accumulation ranges appeared at every 0.618 retracement level 📊
Liquidity grabs below previous swing lows before strong impulsive moves ⚡
Fair Value Gaps (FVGs) filled during corrections, creating perfect liquidity imbalances that institutional players exploit
Currently, NVDA trades near a premium zone of Macro Wave (3), but Smart Money will likely reaccumulate during the upcoming Macro Wave (4) discount phase (2026–2027).
Expect Order Block re-tests and liquidity sweeps around discounted Fibonacci retracement zones (0.236–0.382) before the next major rally 📉➡️📈
📈 Price Action Structure
NVDA’s macro structure remains strongly bullish:
The multi-decade trend has respected every higher high and higher low sequence since 2008.
Each impulse is followed by a healthy re-accumulation range, never breaking long-term structure.
Expect distribution near the $250–$300 (split-adjusted) region as Wave (3) matures, followed by a macro correction that offers generational entries for long-term investors 🧠
🔢 Fibonacci Confluence & Technical Harmony
Fibonacci has been the invisible hand guiding NVDA’s growth 👇
0.786 retracement (2002) → deep liquidity reset
0.618 retracement (2008) → institutional re-entry
3.618 extension (256) → current macro resistance target
4.618 extension (2500) → Super Cycle Wave (3) final target
5.618 extension (26K) → ultimate Super Cycle Wave (5) projection
Each impulse and retracement aligns perfectly with Fibonacci’s geometric rhythm , proving the power of confluence between time, price, and sentiment.
🧠 Fundamentals — The Energy Behind the Waves
Behind the technicals lies unmatched fundamental growth :
💾 AI & Data Centers: NVIDIA is the core infrastructure for modern AI compute and cloud training workloads.
🧩 CUDA Ecosystem: A software moat that ties developers and enterprises directly to NVIDIA’s architecture.
🌐 Omniverse & Robotics: Positioning NVDA as a leader in 3D simulation, robotics, and digital twins — future trillion-dollar markets.
⚙️ Strategic Partnerships: Expanding across hyperscalers, automotives, and enterprise AI.
Each innovation wave fuels a new Elliott Wave impulse , with the AI revolution now driving the strongest macro leg in NVDA’s history.
⚡ Macro Outlook & Timeline
✅ Now (2025): Completing Macro Wave (3) of Super Cycle (3) → heading toward $256 target
⚠️ 2026–2027: Macro Wave (4) correction to 0.236–0.382 (Smart Money entry)
🚀 2028–2029: Macro Wave (5) push → Super Cycle (3) peak near $2,500
🌊 2030–2032: Super Cycle (4) correction — consolidation phase
💎 2035–2040+: Super Cycle (5) → ultimate 5.618 target near $26K
💬 Final Thoughts
"Every correction is a setup for the next expansion. Smart Money buys fear — not euphoria."
NVIDIA is the heartbeat of the AI revolution , the core of data-driven computing , and a living Fibonacci sequence in motion.
As long as fundamentals stay aligned with the wave rhythm, NVDA’s Supercycle will continue to redefine what’s possible in long-term growth. 🌌
#NVDA #ElliottWaveAnalysis #SmartMoneyConcept #PriceActionTrading #FibonacciMagic #AIRevolution #StockMarket #Investing #TradingViewCommunity #TechSupercycle #NVDAtoTheMoon #LongTermInvesting
💬 Traders, analysts, and wave watchers — your insights matter!
Have you spotted NVDA’s next move? Drop your Elliott Wave counts, confirmations, or constructive critiques below 👇 Let’s discuss NVIDIA’s structural evolution, AI-driven Supercycle, and long-term growth potential together 🚀💚
Every comment adds perspective — let’s decode this massive wave as a community! 🌊📈
— Team FIBCOS ⚡💎

$NVDA | The Next Big Leg?NVIDIA has been a textbook case of Smart Money structure this cycle.
✅ Break of Structure (BOS) confirmed
✅ Trendline + MA confluence support at ~$177
✅ Strong premium zone rejection near $195
✅ Fibonacci extension eyeing $231.80
🔑 Levels to Watch:
$177 = Key support (trendline + MA)
$195 = Resistance zone (premium supply)
$231 = Next target if bullish momentum continues
💡 Game Plan:
Above $177 = Long bias toward $195 → $231
Break below $177 = Retrace toward $153 equilibrium
⚡️ Tech + AI flows remain strong; NVDA could be gearing up for another explosive move.
📢 Question to the community:
👉 Do you think NASDAQ:NVDA pushes through $195 straight to $231, or do we retest $153 first?
#NVDA #TradingView #Stocks #Fibonacci #SmartMoneyConcepts #AI #Bullish

NVDA LongBroader Market Structure
NVDA has been in a short-term bullish corrective structure after forming a BOS at $179.91, which marked the end of the prior bearish leg. Since that break, price has been forming higher lows and higher highs on the intraday structure. However, the most recent swing into the $194–$195 supply produced a sharp rejection, showing that the bullish structure is still counter-trend relative to the larger bearish swing from the $202–$205 highs. No new CHoCH has printed yet, but the aggressive selloff from $195 signals a potential short-term shift in control back toward sellers unless demand holds.
Supply & Demand Zones
The upper supply zone at $194–$195 remains strong; price dropped sharply from this level with long-bodied bearish candles, showing active institutional selling and low willingness from buyers to absorb orders. The deeper supply above, between $199–$202, is an even stronger zone because it originated the major downside impulse that broke structure.
On the buy side, the demand at $185–$183 previously showed clear strength—buyers stepped in aggressively and pushed price upward with momentum—which tells us the zone still carries validity. The lower demand between $181–$178 is even more important, as it’s the origin of the BOS at $179.91 and represents the last confirmed defensive line for bulls.
Price Action Within the Marked Region
Price is currently falling from the $195 rejection and heading toward the $185–$183 demand you marked. Candles show increasing wick size on the way down, suggesting early signs of selling exhaustion but not yet a reversal. As price enters this demand, we should see either absorption or continuation. If buyers defend the zone as they did previously, a corrective bounce toward $192–$194 is likely. If demand fails, price will unwind quickly into the deeper $181–$178 liquidity pocket.
Expectation, Bias & Invalidation
Trade bias: short-term bullish, expecting price to dip into demand and bounce into the lower supply.
Expected direction: a pullback into $185–$183, followed by a rally into $192–$194.
Invalidation: a clean close below $183, which would signal sellers have regained full control and shift the outlook to bearish continuation toward $181–$178.
Momentum & Candle Behavior
Momentum currently favors sellers, given the fast drop from supply, but the decline is becoming more controlled—suggesting momentum is fading as price approaches demand. No confirming reversal candles have appeared yet; we will need to see a long-wick rejection, engulfing candle, or clear absorption footprint at demand to confirm the bounce scenario.

Nvidia (NASDAQ: $NVDA) Smashes Q3 Expectations on AI Demand Nvidia (NASDAQ: NASDAQ:NVDA , XETRA:NVD) posted another blockbuster quarter as its fiscal Q3 results exceeded Wall Street expectations, powered almost entirely by explosive demand for its AI-focused data center chips. Revenue reached $57.01 billion, beating the $55.19 billion consensus and climbing 62% year-over-year. Adjusted EPS came in at $1.30, up 60% from last year and 24% sequentially.
The data center division once again carried the quarter with $51.2 billion in revenue, outperforming analyst estimates of $49.34 billion and rising 66% from a year ago. Nvidia highlighted record demand for its Blackwell platform, which delivers industry-leading performance and 10x throughput per megawatt compared to previous generations. CEO Jensen Huang said AI compute demand continues to accelerate across both training and inference, calling it a “virtuous cycle of AI.”
Other business segments posted mixed results. Gaming revenue grew 30% year-over-year to $4.3 billion but dipped slightly from the previous quarter. Professional visualization revenue increased 56% to $760 million, and automotive revenue rose 32% to $590 million, reflecting steady diversification outside core AI markets.
Nvidia reported adjusted operating income of $37.75 billion and adjusted net income of $31.77 billion, both well above expectations. Free cash flow hit $22.09 billion, and the company returned $37 billion to shareholders through dividends and buybacks in the first nine months of fiscal 2026.
For Q4, Nvidia guided revenue of $65 billion, well above the $61.98 billion consensus, and projected gross margins around 75%. The company expects global AI adoption to accelerate further as more startups, enterprises, and countries ramp up model development.
Shares rose 3.7% in after-hours trading following the earnings release.

NVDA Head and Shoulders- Neckline BrokenNvidia’s bear case rests on one core idea: the stock price assumes a flawless, world-eating AI future, and markets almost never deliver on “perfection narratives.” NVDA trades at extreme valuation multiples for a hardware-driven, highly cyclical business. Those multiples only hold if AI infrastructure spending keeps compounding at its current breathtaking pace for years. But that demand is dangerously concentrated in a handful of hyperscalers who are spending now and rationalizing later. Michael Burry’s recent argument sharpens this point: he claims true end-demand for AI horsepower is vastly overstated, and that much of the current GPU frenzy is a self-reinforcing loop of capital, hype, and accounting gimmicks rather than broad, organic need. If boards pause to question real ROI — or if the circular funding loop breaks — Nvidia’s revenue curve can flatten quickly, dragging the valuation down with it.
Competition, long dismissed by NVIDIA bulls, is another structural headwind. AMD is now shipping accelerators that hyperscalers are actually integrating, and every major cloud provider is building in-house silicon to reduce dependence on NVDA’s margins. Even if Nvidia maintains leadership, it doesn’t need to lose the crown to lose the multiple — slight shifts in workload allocation or a handful of missed design wins are enough to pressure margins. And Burry’s critique deepens this point: he argues Nvidia’s reported profitability is flattered by depreciation assumptions and massive stock-based compensation that buybacks have failed to offset — meaning the “true” economic profit is less bulletproof than headlines suggest. Add to that the fact that U.S. export controls have effectively erased the China data-center market — once 20–25% of revenues — and expectations of a seamless global TAM look increasingly unrealistic.
Technically, NVDA is doing exactly what a euphoric, overowned stock does when gravity starts tugging: momentum is fading, the price is slipping under short-term moving averages, and reactions to spectacular earnings have been strangely sluggish. That’s often the early signature of distribution rather than accumulation. And this lines up directly with Burry’s broader thesis: when a narrative becomes crowded and reflexive, the slightest wobble triggers violent air pockets. NVDA has become the ultimate proxy for the AI boom, the most crowded long in the market — meaning it’s the first thing funds sell when risk appetite cools, and the last thing buyers chase during corrections.
Put simply, Nvidia is a phenomenal company priced as if nothing can ever go wrong — while Burry is arguing that much of what looks “perfect” is not what it seems. The bear case isn’t that Nvidia collapses. It’s that the AI boom normalizes, competition accelerates, accounting realities catch up, margins slip toward something earthbound, and investors recalibrate how much they’re willing to pay. In that world, NVDA doesn’t need bad news to fall. It only needs the news to arrive slightly less euphoric than the fantasies currently baked into the price.
#NVDA #Bearish #HeadandShoulders #MichaelBurry

NVDA Head and Shoulders- Dec Rate Cuts has changed setupNvidia’s setup has shifted. With the Fed signaling a likely rate cut on December 10th, the market will start baking that optimism into asset prices ahead of time. When monetary conditions ease, high-valuation tech often gets an extra tailwind, which means the expected head-and-shoulders pattern on NVDA may fail to play out cleanly. The chart might still roll over, but the macro backdrop now works against a decisive breakdown. Short positions here demand caution.
Original post
Nvidia’s bear case rests on one core idea: the stock price assumes a flawless, world-eating AI future, and markets almost never deliver on “perfection narratives.” NVDA trades at extreme valuation multiples for a hardware-driven, highly cyclical business. Those multiples only hold if AI infrastructure spending keeps compounding at its current breathtaking pace for years. But that demand is dangerously concentrated in a handful of hyperscalers who are spending now and rationalizing later. Michael Burry’s recent argument sharpens this point: he claims true end-demand for AI horsepower is vastly overstated, and that much of the current GPU frenzy is a self-reinforcing loop of capital, hype, and accounting gimmicks rather than broad, organic need. If boards pause to question real ROI, or if the circular funding loop breaks Nvidia’s revenue curve can flatten quickly, dragging the valuation down with it.
Competition, long dismissed by NVIDIA bulls, is another structural headwind. AMD is now shipping accelerators that hyperscalers are actually integrating, and every major cloud provider is building in-house silicon to reduce dependence on NVDA’s margins. Even if Nvidia maintains leadership, it doesn’t need to lose the crown to lose the multiple, slight shifts in workload allocation or a handful of missed design wins are enough to pressure margins. And Burry’s critique deepens this point: he argues Nvidia’s reported profitability is flattered by depreciation assumptions and massive stock-based compensation that buybacks have failed to offset, meaning the “true” economic profit is less bulletproof than headlines suggest. Add to that the fact that U.S. export controls have effectively erased the China data-center market, once 20–25% of revenues and expectations of a seamless global TAM look increasingly unrealistic.
Technically, NVDA is doing exactly what a euphoric, overowned stock does when gravity starts tugging: momentum is fading, the price is slipping under short-term moving averages, and reactions to spectacular earnings have been strangely sluggish. That’s often the early signature of distribution rather than accumulation. And this lines up directly with Burry’s broader thesis: when a narrative becomes crowded and reflexive, the slightest wobble triggers violent air pockets. NVDA has become the ultimate proxy for the AI boom, the most crowded long in the market, meaning it’s the first thing funds sell when risk appetite cools, and the last thing buyers chase during corrections.
Put simply, Nvidia is a phenomenal company priced as if nothing can ever go wrong, while Burry is arguing that much of what looks “perfect” is not what it seems. The bear case isn’t that Nvidia collapses. It’s that the AI boom normalizes, competition accelerates, accounting realities catch up, margins slip toward something earthbound, and investors recalibrate how much they’re willing to pay. In that world, NVDA doesn’t need bad news to fall. It only needs the news to arrive slightly less euphoric than the fantasies currently baked into the price.
#NVDA #Bearish #HeadandShoulders #MichaelBurry

NVDA: The Bubble Beneath the Brilliance A deep dive into Nvidia’s AI-fueled rally — and the cracks forming under the surface.
🐺 Hello Traders 🐺
Nvidia’s been the poster child of the AI revolution — no doubt about it.
But every time a narrative gets “too perfect,” I hit pause… and zoom out.
Because NVDA’s been here before.
And every time, the chart whispered the truth long before the headlines caught up.
So let’s ask the real question:
Not “Is Nvidia a great company?” — we already know it is.
But rather:
“Are we pricing in a future that might not arrive fast enough?”
That’s where things get interesting.
🔹 The Hidden Cost of the AI Boom
AI is revolutionary — but it’s also a cash furnace.
Training, inference, datacenters, energy, hardware… it all comes with a brutal price tag.
And if returns don’t scale fast enough, guess where the market cuts first?
Hardware.
Which puts NVDA right at the heart of the risk zone.
Great company ≠ infinite valuation.
🔹 NVDA’s History of Hype & Hangovers
Let’s zoom out and look at the cycles:
1️⃣ Dot-Com Era (2000–2002)
Nvidia rode the internet wave hard.
Then the bubble popped — and NVDA got crushed.
Narrative > fundamentals… until reality showed up.
2️⃣ 2006–2007 GPU Mania
Gaming hype sent NVDA vertical.
Then came 2008 — and wiped the slate clean.
3️⃣ 2015–2018: Growth Meets Hype
This one was different.
Real growth + real hype.
Drivers included:
- 4K gaming and esports explosion
- AI research adoption
- Tesla’s self-driving push
- Crypto mining boom
- Datacenter demand
- Explosive revenue and margin growth
Outcome? A solid run with a mini-bubble at the tail end — which corrected during the crypto winter.
4️⃣ 2018 Crypto Crash
Mining demand collapsed.
NVDA dropped over 50%.
5️⃣ 2023–2024 AI Supercycle
The biggest rally in NVDA’s history.
Parabolic. Vertical. Narrative-fueled.
But here’s the thing:
Every vertical move in history cools off when expectations outrun execution.
🔹 Why This Cycle Feels Fragile
This isn’t just hype — it’s built on massive capex from Big Tech.
But capex isn’t infinite.
And the ROI of AI? Still foggy.
Here’s what’s brewing beneath the surface:
- Monetization is early
- Margins could shrink
- Custom chips are rising
- Spending could slow
And when it does, NVDA feels it first.
That’s why calling this an “unstoppable cycle” is dangerous.
🔹 My Technical View
I treat parabolic charts with caution — always.
- Strong trend ≠ invincible
- Steeper slope = weaker base
- Euphoria = warning sign
- Breaks are rarely gentle
NVDA still looks bullish long-term…
But no parabolic trend lasts forever.
I’m watching:
The price is currently reacting very well to the parabolic curves. Every time it hits the top, a downtrend begins, and the price crashes hard before retesting the support curve!
If AI spending slows even a little, NVDA will be the first domino.
🔹 Final Takeaways
Nvidia isn’t in trouble.
It’s one of the strongest tech players on the planet.
But history doesn’t care about greatness — it cares about gravity.
And every time NVDA flew too close to the sun, it came back down hard.
This cycle checks all the bubble boxes:
- Parabolic price
- Euphoric narrative
- Crowded positioning
- Sky-high expectations
- Capex dependence
As long as the slope holds, momentum traders run the show.
But when it breaks… it breaks fast.
That’s the bubble beneath the brilliance.
🎯 Why This Post Matters
Because most traders only see the surface.
They chase hype.
They follow headlines.
But they ignore the deeper forces — the ones that actually move the chart.
This post is a reminder:
Stay sharp.
Stay skeptical.
And never treat any narrative — even AI — as invincible.
🐺 Discipline is rarely enjoyable, but almost always profitable 🐺
🐺 KIU_COIN 🐺

NVDA Earnings Breakout Setup — QuantSignals V3 | Bullish CallNVDA QuantSignals V3 Earnings 2025-11-18
Instrument: NVDA
Date: 2025-11-18
Signal Type: Earnings (Pre-Earnings Position)
Model: QuantSignals V3
Direction: Calls
Confidence: 65%
Conviction: Medium
Earnings Date: 2025-11-19
Earnings Estimate: $1.27
Expiry: 2025-11-21
Options Setup
Strike Focus: $185.00
Entry Range: $6.45 – $6.55
Implied Move: $14.15 (7.7%)
Profit Target: $13.00
Stop Loss: $3.25
IV: 106.5% (elevated due to earnings)
PCR (Flow Intel): 0.37 (bullish)
24h Move: –1.91%
Price & Technicals
Current Price: $183.79
Katy Prediction Target: $184.60 (+0.44%)
Trend Classification: Neutral (50% confidence)
RSI: 31.3 (near oversold)
MACD: +2.17
Momentum (ROC): –7.42%
Support: $179.65
Resistance: $187.55
AI Forecast (Katy Model)
• Time-series predicts steady upward movement
• Range projection: $183.79 → $184.80 (+0.55%)
• Confidence moderate, trajectory shows bullish bias despite neutral label
Fundamental & News Notes
• Strong historical earnings performance (100% beat rate)
• Mixed news sentiment but leaning optimistic
• Nvidia positioned as key market driver for earnings week
• Pre-earnings selling pressure suggests potential reversal
Risk Notes
• Moderate risk due to high implied volatility
• Earnings event introduces binary outcome
• Premiums elevated; smaller sizing recommended
• Monitoring pre-market on 11/19 essential
NVDA Earnings Play: Bullish Calls Despite Katy Neutral BiasNVDA QuantSignals V3 — Earnings Play (2025-11-19)
Direction: BUY CALLS
Confidence: 68% (Medium Conviction)
Risk Level: Moderate
🎯 Trade Setup
Strike: $180
Expiry: 2025-11-21
Entry Range: $9.30 – $9.40
Target 1: $18.60
Target 2: $27.90
Stop Loss: $4.65
Position Size: 3%
📈 Key Metrics
Current Price: $185.06
Implied Move: $13.15 (7.1%)
PCR: 0.46 (Bullish)
24h Move: +0.48%
RSI: 31.3
Support: $180.52
🧠 Analysis Snapshot
Katy AI Prediction: Neutral → slight bearish drift toward $183.56–184.20
Technical Indicators: Mixed (MACD bullish, ROC bearish)
News Sentiment: Strongly Bullish
$100B AI infra deal w/ Brookfield
Presidential endorsement
AI chip testing breakthroughs
Options Flow: Heavy call activity; institutional size at higher strikes
Volatility: VIX 23.25 — elevated
⚡ Why This Trade Works
Bullish news + strong call flow overpowers Katy’s neutral/slightly bearish modeling
Earnings volatility + catalysts create a favorable upside skew
0.63 delta strike gives balanced risk/reward
⚠️ Notes
Moderate confidence → consider smaller sizing
Expect heavy volatility due to 7.1% implied earnings move
Low pre-earnings volume → scale entries if possible

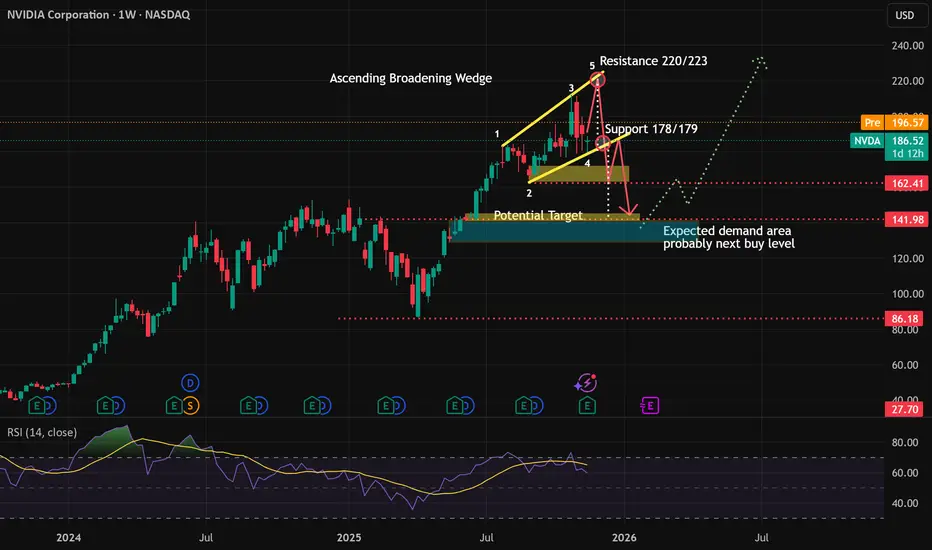
Ascending Broadening Wedge for NVIDIA Weekly ChartThe downtrend probably won't be happen in the near term, but the rebound alson have limited upside. But at least there are 2 possibilities ahead of the price.
I suspect Ascending Broadening Wedge is in process in weekly chart for Nvidia. The concern is the potensial downtrend pressure, especially if support trendline break.
I devide it on 2 scenario :
1. Rebound to 220/223 first. This mean no immediate breakout support anytime soon based on the count. The price will have to raise first with maximum target 220/223 before followed with rejection. But the raise don't have to be exactly 220/223. It can also retest the previous high (3) before rejected and fall.
2. No rebound, support 177/178 immediately broken, the downtren continues to the target area.
There area possibilities to go up first if Santa Claus Rally succeed to push the price above or near resistance, then after the seasonal trade for Santa Claus or January effect will face the profit taking and underpressure through the supportline.
After the pressure, we probably will see some demand on blue area to push the price back on the uptrend..that ofcourse..if no "AI-buble" coming in coming months
DISCLAIMER
Do with your own risk!
This is not suggestion! This is my personal view on the opportunities that could happen to Nvidia.
The Hidden Truth Behind Buybacks & Cash Flow 🔥 The Hidden Truth Behind Buybacks & Cash Flow: What Investors Miss in NVIDIA’s Numbers
Why RSUs and Working Capital can distort the real story
Most investors see two big numbers and get excited:
✔ huge buybacks
✔ huge operating cash flow
But rarely do they understand what’s actually happening behind the scenes.
Let’s break down NVIDIA’s latest filings in simple, real numbers.
🔹 1. RSUs Inflate Share Count — Buybacks Don’t Always Reduce It
Everyone loves to hear “the company is buying back shares.”
But here’s what most investors don’t realize:
RSUs (employee stock awards) create new shares → dilution.
Buybacks must first neutralize that dilution before reducing total shares.
Let’s look at NVIDIA’s own numbers (Q1 FY2026 – Apr 2025):
▶ Shares Issued from Stock Plans: +50M
▶ Shares Withheld for Taxes (RSU taxes): –13M
▶ Shares Repurchased: –126M
📌 Net share reduction = 126 – 50 + 13 = 89M
This means:
Although NVIDIA spent $14.5B on buybacks, the true reduction was only 89M shares.
And the cost?
▶ “Issuance (Retirement) of Stock, Net” = –$13.725B (Q1)
▶ Q2: –$23.445B
▶ FY: –$33.216B
This is not real reduction — it’s a treadmill:
RSUs add shares
the company buys back shares
RSUs add more
the company buys back again
If NVIDIA ever stopped buybacks for even one quarter,
shares outstanding would jump instantly.
🔥 Simple Example (for investors):
Start of quarter: 1,000M shares
RSUs issued: +40M → 1,040M
Buybacks: –50M → 990M
The investor thinks they bought back 50M shares.
In reality?
➡ True reduction = only 10M.
➡ 80% of buybacks were just neutralizing dilution.
This happens every quarter.
🔹 2. Working Capital Boosted Cash Flow — Not Operations
Look at NVIDIA’s operating cash flow (OCF):
Q1 FY2026 OCF: +$27.414B
But the key line is this:
Changes in Working Capital: +$8.654B
This means:
$8.6B of the operating cash flow came from timing of receivables, payables, and inventory — NOT from actual operations.
This is crucial because:
✔ It’s cyclical
✔ It’s temporary
✔ It reverses next quarter
Example from the next periods:
Q2 FY2026 “Changes in WC”: –$2.368B
FY2025: –$9.383B
Q4 FY2025: –$3.520B
Working capital swings can boost or crash cash flow without any change in real profitability.
🔥 Why This Matters
Investors often misinterpret:
🚫 A jump in Operating Cash Flow
= “Strong business performance”
But many times:
✔ It’s just Working Capital cycling
✔ Not improved EBITDA
✔ Not improved margins
✔ Not better demand
✔ Not better efficiency
It’s accounting timing, not operational strength.
🔹 3. The Combination Can Mislead Investors
In a single quarter, NVIDIA showed:
✔ +8.6B boost from WC
✔ $14.5B spent on buybacks
✔ Net true share reduction only 89M
This creates the illusion of:
higher OCF
higher EPS
fewer shares
But much of this stems from:
accounting timing (WC)
neutralizing dilution (RSUs)
Not from:
organic profitability
sustainable improvements
🔥 Conclusion: What Every Investor Should Watch
If you want to understand the real strength of a company, focus on:
✔ Net Shares Change (after RSUs)
Not just “buybacks.”
✔ OCF minus Changes in Working Capital
Not the headline OCF.
✔ True organic cash generation
Not timing effects.
✔ SBC (Stock-Based Compensation)
Because SBC = dilution = more future buybacks.
📌 Final Wake-Up Call
RSUs inflate share count.
Buybacks only offset them.
Working capital inflates cash flow.
Neither guarantees stronger fundamentals.
If you want to see the real story,
you must look beneath the headline numbers.