How to Filter for Trading CandidatesIntroduction
This post explores how to filter tradable assets using structural and behavioral criteria. While the examples focus on swing trading stocks, the same principles apply across other markets.
A structured selection process helps refine the list of candidates and supports a more consistent approach. The use of filters can reduce the universe of stocks to those that fit the chosen method. For example, in momentum trading, the purpose is to find stocks that have already shown strong movement and may offer continuation opportunities.
There are multiple approaches to selection. This chapter focuses on two practical methods: scan-based filtering and a top-down approach.
Foundational Filters
These basic criteria can be applied across all scans and serve to exclude assets that are illiquid or incompatible with standard execution. The specific thresholds used may depend on personal account size, capital allocation and trading style. This guide focuses on swing trading, where moderate liquidity and price stability are important to ensure consistent fills and manageable risk.
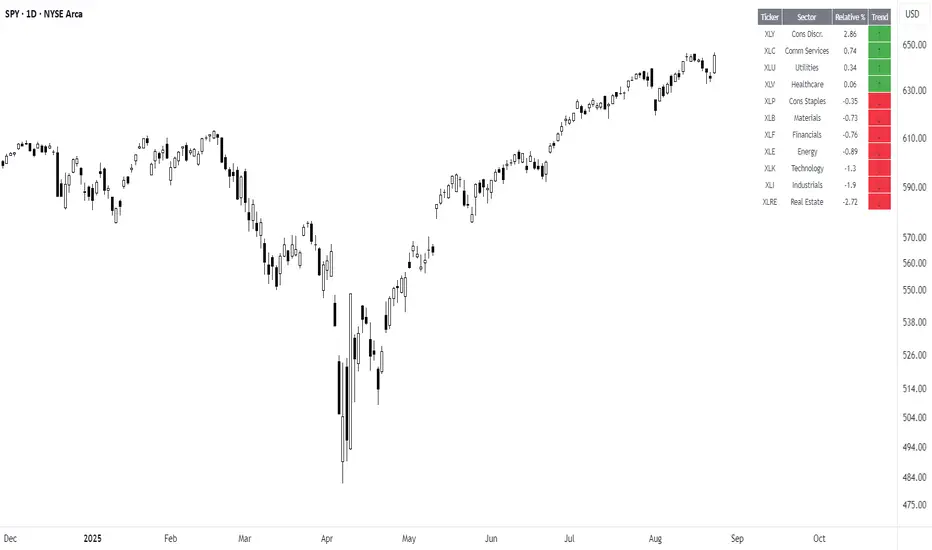
The Sector Relative Strength tool can help show leading sectors versus the S&P 500 Index over the longer term. This optional top-down approach highlights which areas of the market are outperforming and can support manual refinement.
Setup-Based Filters
These examples demonstrate criteria for identifying potential continuation setups following recent momentum. The filters shown are for bullish conditions; for bearish setups, the logic is reversed. For other approaches, such as fading, filters based on excursion/overextension would be applied instead.
Use the Momentum Tracker to visualize when stocks historically met each of these criteria. This helps evaluate the behavior that preceded meaningful setups and refine your filters over time.
Optional Refinement Filters
These filters can help focus the scans further and improve candidate quality.
Candidates can also be sorted based on preference. A common method is to sort by recent volatility, such as ATR%, or distance from the mean price to prioritize price retracement or contraction.
Momentum Scan Example
This sample scan uses normalized momentum to identify new highs in price. The method is standardized and adapts well across different markets. In case the number of candidates is extensive, filters can be more restrictive or additional criteria applied to narrow the selection.
Market Context
Market breadth is the equilibrium between the number of stocks in advance to those in a decline, in other words a method to determine the current market environment. In a positive phase, bullish setups will have improved probabilities and presence, whereas in a bearish phase the opposite would be true. There tends to be a correlation in the market, where stocks often move in line with their sector or the broader index. Being aware of where capital is flowing helps align trades with the broader environment. In case one has an effective scan and review process, much of this assessment is implicitly accounted for.
This guide will not cover these in depth, but there are numerous ways to evaluate market context; such as reviewing index or sector performance, market breadth, and monitoring economic or macro events. The most important part is to be consistent and apply discretion within the chosen process.
Trade ideas
SPY: Short Trade Explained
SPY
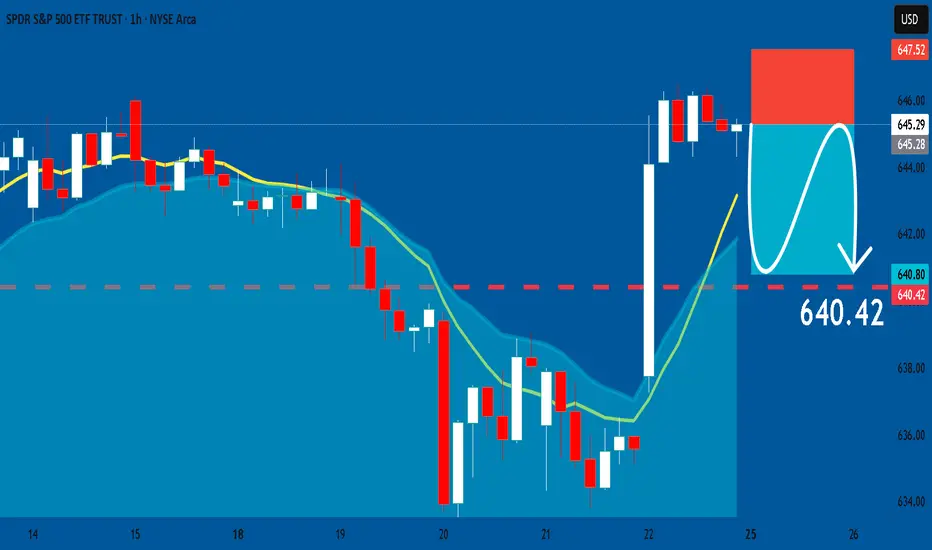
- Classic bearish formation
- Our team expects pullback
SUGGESTED TRADE:
Swing Trade
Short SPY
Entry - 645.29
Sl - 647.52
Tp - 640.42
Our Risk - 1%
Start protection of your profits from lower levels
Disclosure: I am part of Trade Nation's Influencer program and receive a monthly fee for using their TradingView charts in my analysis.
❤️ Please, support our work with like & comment! ❤️
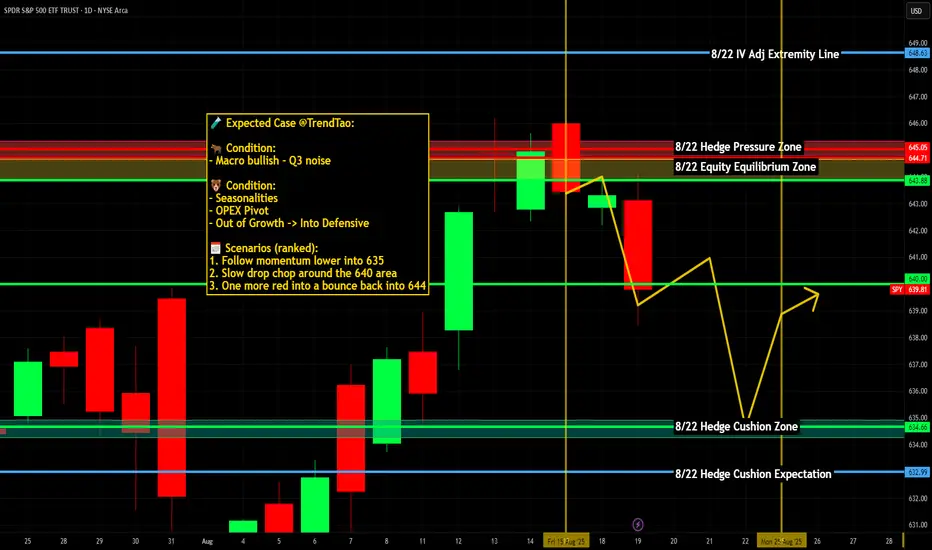
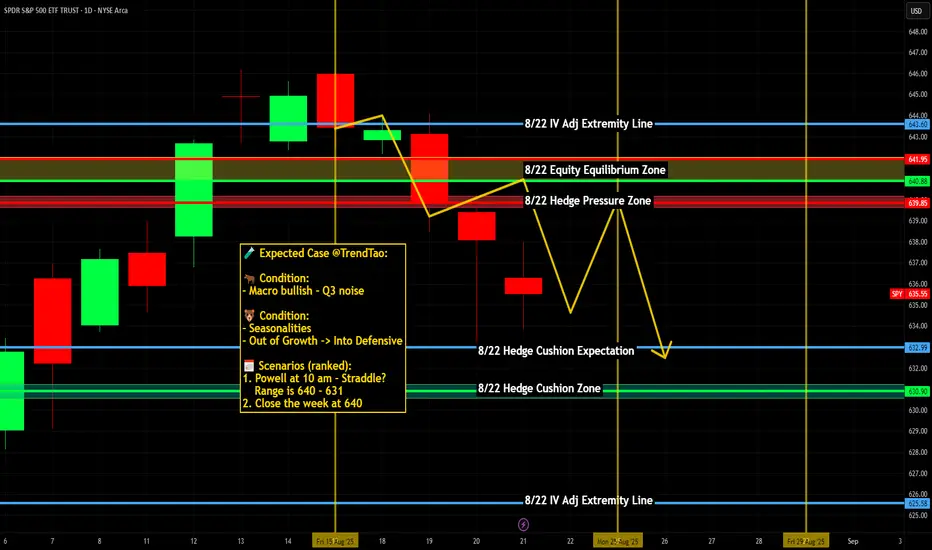
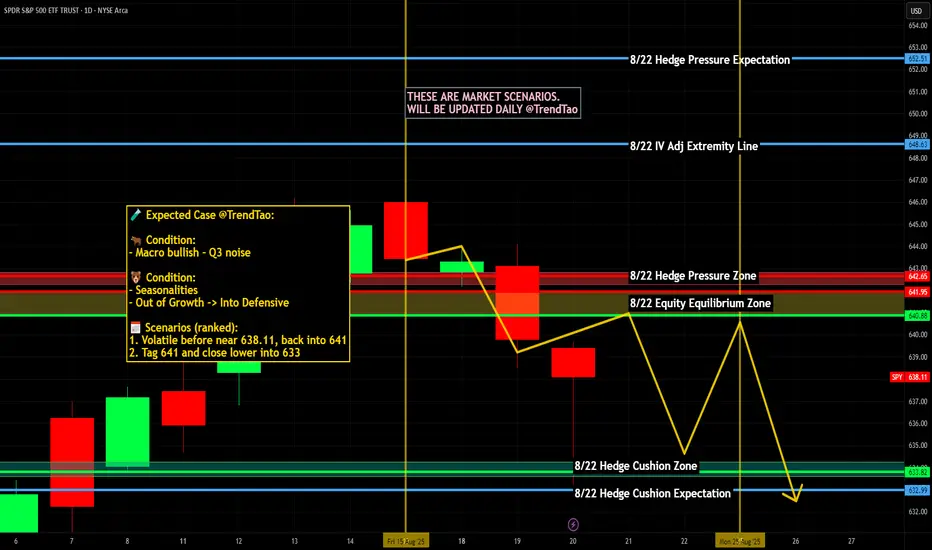
SPY/QQQ Plan Your Trade Update For 8-22 : Is This The Top?This is a follow-up to my recent video to help answer questions and to share my analysis of the SPY/QQQ, Gold/Silver, and Bitcoin for all viewers.
This video also addresses the tools I use to stay on top of the swings in price movement and highlights why I believe the markets may continue to unwind from these lofty highs.
Get some.
#trading #research #investing #tradingalgos #tradingsignals #cycles #fibonacci #elliotwave #modelingsystems #stocks #bitcoin #btcusd #cryptos #spy #gold #nq #investing #trading #spytrading #spymarket #tradingmarket #stockmarket #silver

SPY | Leap of Doom?SPY just jumped...
The wrong way up!
To sustain you must conserve. To climb up a hill, you need energy, resources like food and water. The energy they give you far out-weighs their absolute mass. Therefore it makes sense for you to carry them.
And they have taken you very far...
But now you have run out of energy.
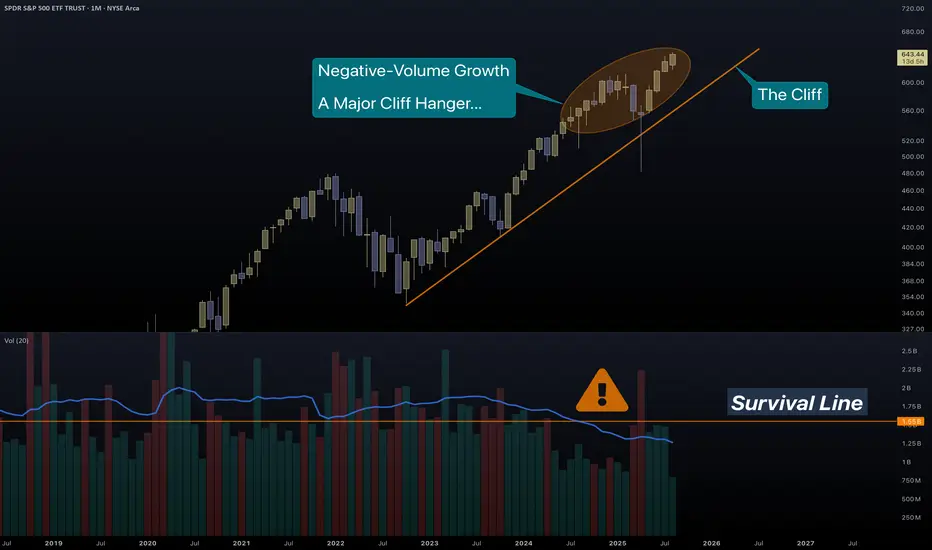
Price growth needs transaction volume to have strength and meaning.
You are too light(headed) to realize that moving further up is a dead-end.
THIS IS NOT SOMETHING SMALL.
SPY is one of the largest Funds in the world. A first-ever major violation of volume trend, in such a big index, must not be ignored. Imagine what is happening underneath...
Look at some examples:
NVDA
The most massive of companies, has a multi-year issue with volume.
MSFT
Unlike its first growth, Microsoft has a tremendous loss of strength in volume metrics.
Such long-term drop in volume means that companies offload real stocks for cheap futures .
We witness the same with Bitcoin...
And gold...
Not quite doomed yet, but troublesome still.
TSLA
Tesla with their shiny and financially pointless cars, has made a pointless growth. Just like many stocks as you will soon realize.
AAPL
The masses, even though their name suggests that they have some matter, in reality they don't. 10% of people have 90% of wealth. Investors have long left Apple, leaving the hoard inside to bubble up the dream.
There is more and more proof that the Fab5 (well the Fab500 as we can see from SPY/SPX) are replacing stocks with derivatives. Real money replaced by weapons of mass destruction, just like Warren Buffett said.
Good luck to us all...
PS. Something irrelevant to stocks, but relevant to the fundamentals of investing in AAPL.
Judging by the recent UI decisions, they trapped the users in bubbles and they are unable to see the truth. Brilliantly, they changed the name of soap bubbles to liquid glass. (bubbles are shiny, crystals are rough).
As a long-time Apple user, now not much of an Apple lover, I know quite well the changing philosophy of them. iPhone (and all products) began as a phone for the "smart" ones and ended up the No1 desire for the masses.
After a decade, I have switched to Fedora Silverblue for 90% of my leisure.
SPY Daily Chart: Uptrend Intact, Key Supports in Focus
SPY Daily Chart: Uptrend Intact, Key Supports in Focus
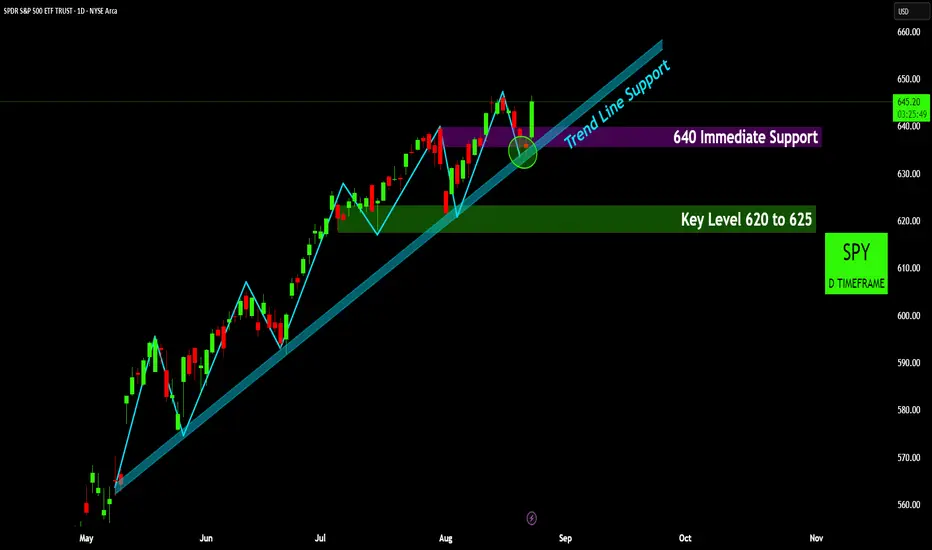
Established Uptrend with Strong Trend Line Support: SPY continues to display a clear upward trend on the daily timeframe, with price consistently finding support along the depicted trend line. The recent pullback in mid-August saw price effectively test and bounce off this crucial trend line, reaffirming its strength.
640 as Immediate and Confluent Support: The 640 level has proven to be an immediate support zone, coinciding with the recent touch of the upward trend line. The market has shown a decisive bounce from this confluence of support, suggesting current bullish momentum for the short term.
Key Level 620-625 as Deeper Support: Should the immediate 640 support and the upward trend line fail to hold, the next significant 'Key Level' to monitor is the 620 to 625 range. This area has previously acted as a strong demand zone and would represent a more substantial correction within the prevailing uptrend.
Powell’s dovish Jackson Hole speech signaling potential rate cuts amid labor market slowdown and inflation risks, fueled a surge in growth and tech stocks, reinforcing today’s rally.
Disclaimer:
The information provided in this chart is for educational and informational purposes only and should not be considered as investment advice. Trading and investing involve substantial risk and are not suitable for every investor. You should carefully consider your financial situation and consult with a financial advisor before making any investment decisions. The creator of this chart does not guarantee any specific outcome or profit and is not responsible for any losses incurred as a result of using this information. Past performance is not indicative of future results. Use this information at your own risk. This chart has been created for my own improvement in Trading and Investment Analysis. Please do your own analysis before any investments.
Opening (IRA): SPY September 19th 500 Short Put... for a 5.02 credit.
Comments: Adding at intervals at strikes better than what I currently have on, targeting the <16 delta strike paying around 1% of the strike price in credit. Will look to manage positions as I come to them.

Nightly $SPY / $SPX Scenarios for Friday, August 22, 2025🔮 Nightly AMEX:SPY / SP:SPX Scenarios for Friday, August 22, 2025 🔮
🌍 Market-Moving News
Powell’s Jackson Hole keynote is the main event (10:00 AM ET). Markets want clarity on the path to cuts and any framework tweaks; the Fed’s own calendar lists the speech and KC Fed confirms the Aug 21–23 agenda. $SPY/$TLT/ TVC:DXY are the most sensitive.
Risk tone turned cautious into the speech. Stocks faded Thursday as traders de-risked ahead of Powell; positioning is tight and headline-sensitive.
Dollar firm / gold steady into Jackson Hole. Classic pre-keynote safety bid; futures price a high probability of a September cut, keeping two-way risk for rates and equities.
Global cues: Japan CPI lands overnight; UK retail sales postponed. Japan’s July inflation print hits before U.S. cash open; the U.K.’s July retail sales were pushed to Sep 5, trimming one macro catalyst from the tape.
📊 Key Data & Events (ET)
10:00 AM — Fed Chair Powell @ Jackson Hole (Keynote). Why it matters: Sets near-term curve path and risk appetite; watch $TLT/ TVC:TNX and TVC:DXY → AMEX:SPY reaction.
1:00 PM — Baker Hughes U.S. Rig Count. Why it matters: Energy activity → supply expectations → $CL_F/ AMEX:XLE ; persistent rig drift can nudge inflation expectations. (Released weekly at noon CT/1 PM ET.)
Overnight — Japan CPI (Jul). Why it matters: Yen rates and global FX spillovers; a surprise could ripple into U.S. risk before the keynote.
All day — Jackson Hole Symposium continues. Why it matters: Secondary speakers can color post-Powell reaction as positioning resets.
⚠️ Disclaimer: Educational/informational only — not financial advice.
📌 #trading #stockmarket #SPY #SPX #Fed #JacksonHole #Powell #DXY #TLT #Gold #Energy #RigCount
SPY WEEKLY LIVE RECORDED 21st AUG 2025This is the price action of SPY. I have clearly discussed the levels where charts are showing us the probability of buying levels.
If you have any doubts, feel free to leave a comment or DM me.
NOTE:FORGET ABOUT TRADING & FOCUS ON PROTECTING YOUR CAPITAL

August 21st 2025 - Testing New all time high res on S&P 500 SPYS&P 500 SPY ... is testing the new all time high at 646.19 ..... bullish channel support at 634.34 ... watching the bounce off that level today ...

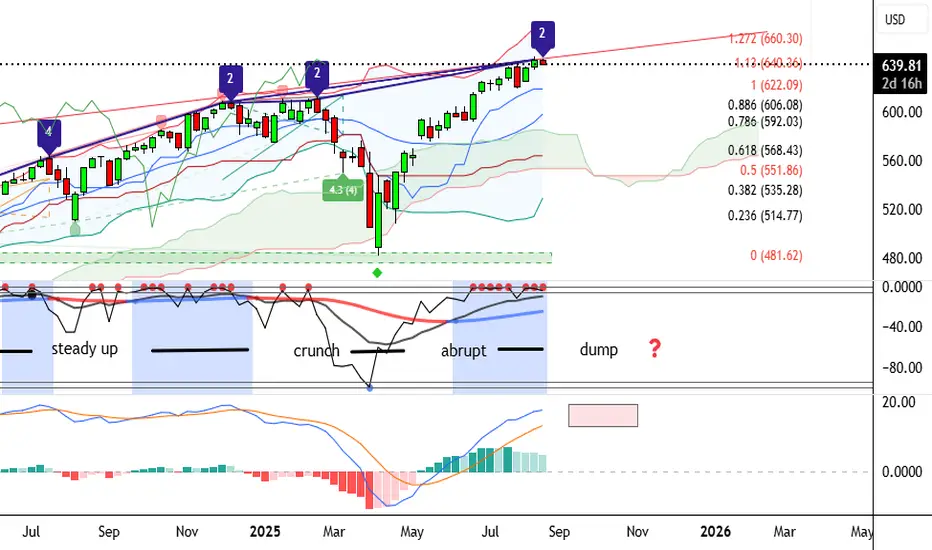
SPX Long Term TrendSPX seems to be in a 5 wave upward trend. We see alternation in waves 2 (subdividing) and 4 (sharp move down). We also see that 1 = 3 and 5 so far is 5 = 0.618*1 hence the pullback. Both 2 and 4 have retraced 1 and 3 exactly 50%. The target for wave 5 should either be 0.618*1 or 1.618*1 giving us a pretty bullish move ahead. Will publish short term view in a separate post.

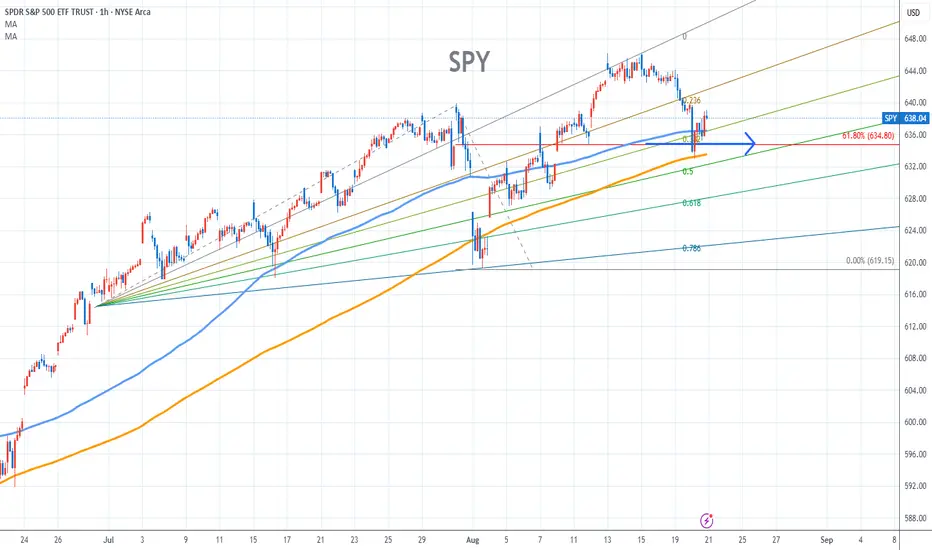
SPY Stock Chart Fibonacci Analysis 082025Trading Idea
1) Find a FIBO slingshot
2) Check FIBO 61.80% level
3) Entry Point > 634/61.80%
Chart time frame:B
A) 15 min(1W-3M)
B) 1 hr(3M-6M)
C) 4 hr(6M-1year)
D) 1 day(1-3years)
Stock progress:A
A) Keep rising over 61.80% resistance
B) 61.80% resistance
C) 61.80% support
D) Hit the bottom
E) Hit the top
Stocks rise as they rise from support and fall from resistance. Our goal is to find a low support point and enter. It can be referred to as buying at the pullback point. The pullback point can be found with a Fibonacci extension of 61.80%. This is a step to find entry level. 1) Find a triangle (Fibonacci Speed Fan Line) that connects the high (resistance) and low (support) points of the stock in progress, where it is continuously expressed as a Slingshot, 2) and create a Fibonacci extension level for the first rising wave from the start point of slingshot pattern.
When the current price goes over 61.80% level , that can be a good entry point, especially if the SMA 100 and 200 curves are gathered together at 61.80%, it is a very good entry point.
As a great help, tradingview provides these Fibonacci speed fan lines and extension levels with ease. So if you use the Fibonacci fan line, the extension level, and the SMA 100/200 curve well, you can find an entry point for the stock market. At least you have to enter at this low point to avoid trading failure, and if you are skilled at entering this low point, with fibonacci6180 technique, your reading skill to chart will be greatly improved.
If you want to do day trading, please set the time frame to 5 minutes or 15 minutes, and you will see many of the low point of rising stocks.
If you want to prefer long term range trading, you can set the time frame to 1 hr or 1 day
Nightly $SPY / $SPX Scenarios for Thursday, August 21, 2025 🔮 Nightly AMEX:SPY / SP:SPX Scenarios for Thursday, August 21, 2025 🔮
🌍 Market-Moving Headlines
Tech jitters spill as Jackson Hole kicks off. Global equities slipped following a tech sell‑off driven by concerns over U.S. intervention in chipmakers, while traders await Fed Chair Powell’s policy cues. AMEX:SPY and NASDAQ:TLT under pressure as rate‑cut expectations waver.
Sony hikes PS5 prices amid tariffs. Effective August 21, PlayStation 5 models in the U.S. see a $50 price increase—tariff impact spilling into consumer electronics. Raises inflation whispers amid already elevated tech cost narrative.
Healthcare activism heats up. Boards at firms like Medtronic, Pfizer, and Novo Nordisk shift under investor pressure—governance shake‑ups adding a layer of corporate risk and potential M&A signals.
⏱ Key Data Releases & Events (ET)
10:00 AM — Advance Services Report (Q2) (Census bureau). Quarterly weight of service economy—strong print supports Pro side of markets; weak could dial back rate‑cut hopes.
10:00 AM — Summer Youth Labor Force Survey (Annual). Goes with job‑market narrative from July—may tweak Fed sentiment depending on labor softening/stability.
Jackson Hole Symposium begins. Markets now fully focused on Powell; tone could make or break short‑term equity and bond positions.
⚠ Disclaimer: Educational/informational only — not financial advice.
📌 #trading #stockmarket #Fed #JacksonHole #SPY #SPX #TLT #Sony #tech #tariffs #services #labor #activism #healthcare
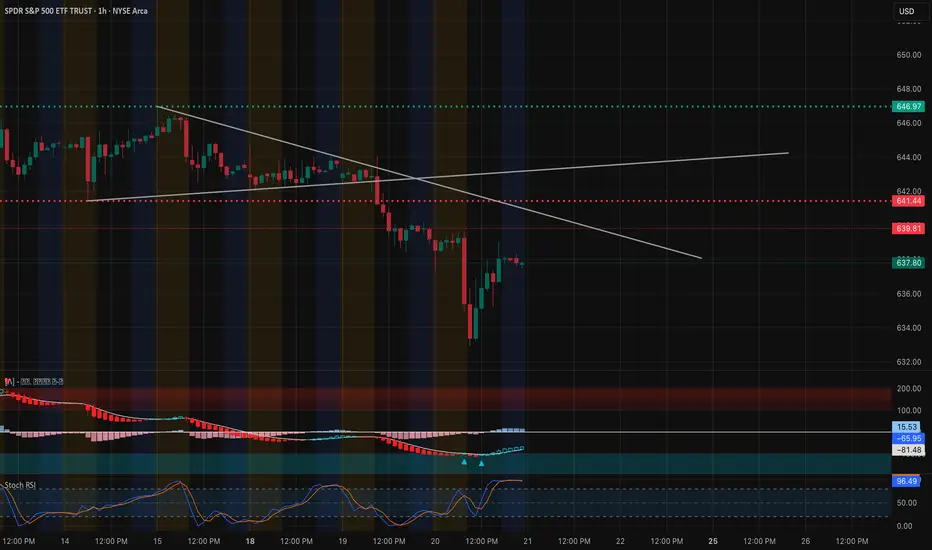
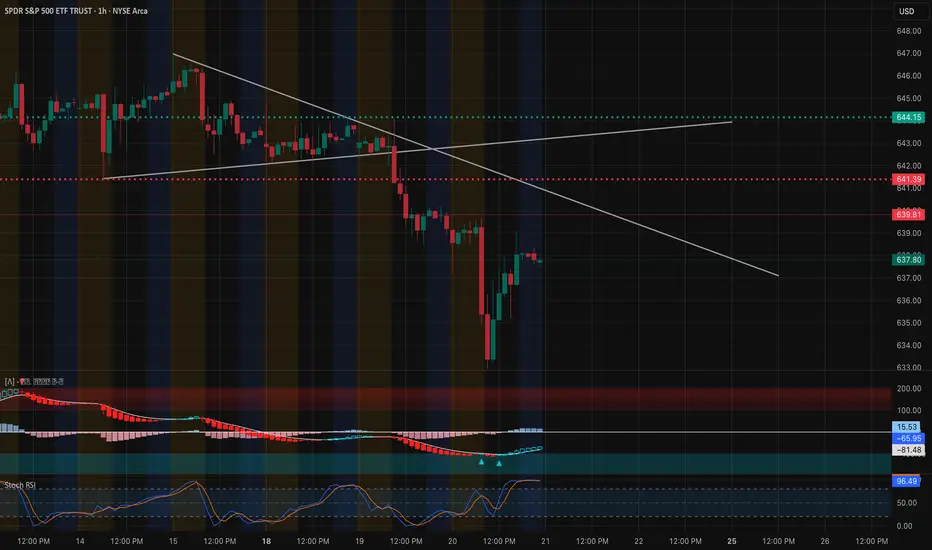
SPY at a Decision Point – Aug. 21SPY at a Decision Point – Will 639 Hold or Break? 📉📈
Technical Analysis (1H Chart)
SPY is showing a classic bounce attempt after the sharp selloff. Price is sitting around 637–638, just under the downtrend resistance line. The chart highlights:
* Trendline Pressure: Multiple touches of the descending trendline; rejection risk remains high unless bulls reclaim 641–642.
* Key Support: Buyers defended the 635 zone, with the next strong support down at 632–633. Losing this area could trigger another wave lower.
* Momentum Indicators:
* MACD is trying to curl bullish from oversold, but momentum is shallow.
* Stoch RSI is already extended near overbought — suggesting rallies may stall soon if not confirmed with volume.
* Structure: If SPY fails to clear 641.5–642, we may see another lower-high formation and retest of 635.
Trading View (Intraday):
* Bullish case → Clear break + hold above 642, targeting 646–647 supply zone.
* Bearish case → Failure under 639–641 could drag SPY back toward 635–633.
GEX / Options Sentiment
Options positioning confirms this tight battle zone:
* Call Walls / Resistance:
* 640 → First big resistance, aligning with HVL zone.
* 642–644 → Multiple call walls (9–10% concentration).
* 647–648 → Extreme upside wall, likely gamma cap.
* Put Walls / Support:
* 637 (GEX7 / -11%) → First downside magnet.
* 635 (2nd Put Wall / -20%) → Strong support cluster.
* 632 (GEX10 / -5%) → Deeper downside target if selling extends.
* Net Options Flow:
* Puts dominate ~87% (bearish tilt).
* IVR low (14.4) → cheap options pricing, directional plays favored.
* GEX heavily negative at 639, meaning dealer hedging could accelerate volatility around this pivot.
Thoughts & Suggestions
* Market is heavily leaning bearish, but intraday scalps can flip quickly if bulls reclaim 642.
* For options traders:
* Bullish scalp setup → Calls only if breakout above 642 with momentum confirmation.
* Bearish setup → Favor puts on rejection under 639–641, with 635/632 as profit zones.
* Risk management is key here: chop is possible between 637–641 before a decisive move.
🔔 Conclusion: SPY is at a tight inflection between 639 support and 641–642 resistance. Dealer flow favors downside, but if bulls can reclaim 642, a short squeeze toward 646–647 opens up. Until then, bias stays slightly bearish.
Disclaimer: This analysis is for educational purposes only and not financial advice. Always do your own research and manage risk before trading.
PLTR Bouncing Off Capitulation Zone-Aug 21PLTR Bouncing Off Capitulation Zone – Can Bulls Reclaim Control? 🚀
🔹 Technical Analysis (1-Hour Chart)
PLTR sold off sharply, finding a temporary bottom around $149–150, which aligned with high volume support. The rebound has been strong, with price now pressing into the $159–160 resistance shelf. This zone is critical because it coincides with a previous breakdown level.
* Trend: Still bearish overall, but the sharp bounce shows buyers defending the $150 zone.
* Momentum: Stoch RSI is turning up from oversold, while MACD shows early bullish momentum.
* Resistance Levels: $160 (current HVL and breakdown shelf), then $162.5 and $167.5.
* Support Levels: $155 (minor shelf), then $150 (major support). A loss of $150 opens the door toward $145.
If $160 is reclaimed and held, PLTR can attempt a short-term recovery back into the mid-$160s. Failure at this resistance risks another leg lower toward $150.
🔹 GEX / Options Sentiment
Options positioning highlights the same pivot:
* Call Resistance: Heavy walls at $162.5 (45%) and $167.5 (26%), with another layer at $170 (41%). Dealers are short here, so breakouts above $162.5 could squeeze.
* Put Support: Strongest put wall around $155, with extreme negative GEX at $150 and $145. If $150 breaks, downside could accelerate.
* IV & Sentiment: IVR 25.9 with calls only 7.9% → options sentiment still leans bearish/hedged.
Interpretation: GEX suggests a tug-of-war between $155–160. Bulls must clear $160 to ignite call wall hedging up toward $167+. Bears will defend this zone aggressively, and a rejection here drags us back toward $150.
🎯 Trade Thoughts
* Bullish Setup: Break & hold above $160 → entry long with targets $162.5 → $167.5. Stop under $155.
* Bearish Setup: Rejection at $160 → short targeting $155 → $150. Stop above $162.5.
Conclusion:
PLTR is at a decision point. $160 is the key battleground for bulls vs bears. Options data aligns with the chart — reclaiming $160 could spark a gamma squeeze higher, while rejection keeps pressure back to $150 support.
Disclaimer: This analysis is for educational purposes only and not financial advice. Always do your own research and manage risk accordingly.
SPY Long From Rising Support! Buy!
Hello,Traders!
SPY is trading in an
Uptrend along the
Rising support and we
Are already seeing a
Bullish rebound from
The line so we will be
Expecting a further
Bullish move up
Buy!
Comment and subscribe to help us grow!
Check out other forecasts below too!
Disclosure: I am part of Trade Nation's Influencer program and receive a monthly fee for using their TradingView charts in my analysis.

SPY wave 5 to 630ishSPY should complete wave 5 to 630 area which will complete higher degree wave 1, you can also use channels to determine where waves will begin and end

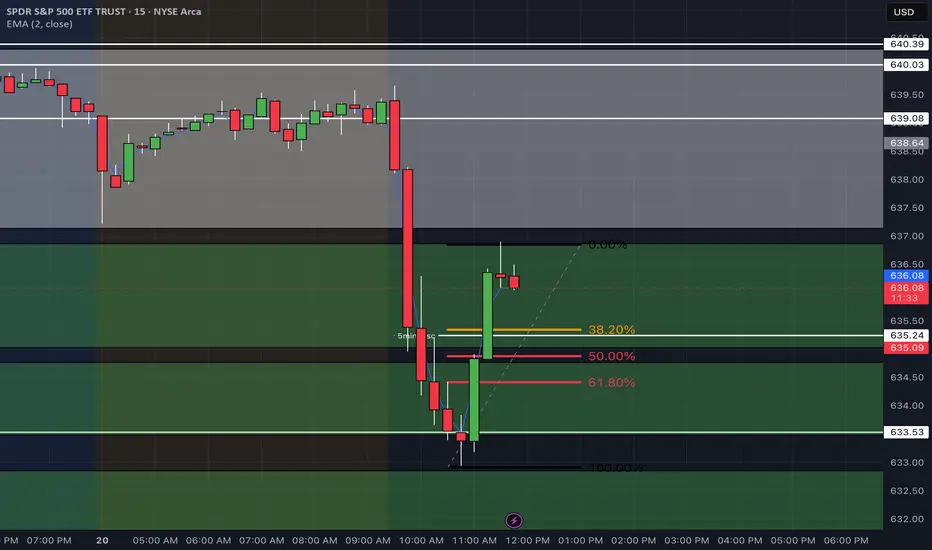
If bullish momentum continue....So far Spy may be changing directions from the bearish momentum we were facing for the remainder of the week we will continue to look for bullish scalping opportunities and i will share my analysis.
Today caught a clean scalp from demand and Fib confluence
the setup was built on Demand, Fib, and strong bullish momentum
quick in and out.
Options Trader:)

Scalp Trade
Price flushed down hard into demand and multiple timeframe demand zones overlap.
May take a quick bullish scalp today looking for confirmation on reversal on lower timeframes (15 - 5min) entry somewhere between 635 and 636 with a TP at 638.50.
Risk management due to high volatility around these zones
if price slices below 633.50 scalp will be invalidated and next leg may be lower.
look for next post for lower timeframe chart

SHORT | SPYAMEX:SPY
SPY Daily – Bearish Setup Developing
Trend Structure
SPY recently printed a Higher High near 646 but failed to hold momentum.
Current structure remains bullish overall, but the short-term is weakening.
A break below 627 would put the Higher Low sequence at risk.
EMA Context
Price rejected under the 9 EMA, signaling short-term weakness.
The 35 EMA around 629–630 is the first key support.
The 100 EMA near 607 aligns with demand/FVG zones and represents a major inflection.
Targets
TP1: 633.77
TP2: 627.04
Invalidation
A daily close above 646 would negate the bearish bias and re-open upside continuation.
Bias
Short-term bearish, expecting tests of 633.77 and 627.04.
If 627 breaks, next levels are 614–607.

SPY – No hocus-pocus – Now the witch is hunting the bullsHappy Hump-Day y'all!
In the last post (see linked chart), I explained what the witch sees in the future.
A possible scenario that is long overdue: the markets are letting out air.
With the candles from yesterday and the day before, we have confirmation that the S&P 500 is heading south. That has consequences that not many want to see right now.
The bulls will be overrun, panic selling will kick in and drive the markets into the ground even faster. The current profit target is still the Centerline, as marked with the red arrow.
Whoever doesn’t cash in at least 50% of their gains now will end up in the witch’s cauldron §8-)
Let’s see how this develops.
The YT Video will be up tomorrow - gotta feed the witches cat §8-)
May the broom be with you!

Nightly $SPY / $SPX Scenarios for Wednesday, August 20, 2025🔮 Nightly AMEX:SPY / CBOE:SPX Scenarios for Wednesday, August 20, 2025 🔮
🌍 Market-Moving News
Jackson Hole in focus; dollar firms. Traders lean ~84% odds of a 25bp cut in September; watch TVC:DXY vs. $SPY/ NASDAQ:TLT as Powell risk approaches.
Retail baton passes from HD to LOW/TGT. After HD’s hold-guidance rally, attention shifts to Lowe’s/Target for read-throughs on DIY vs. pro spend and tariff pass-through.
Risk tone jittery into minutes. Tech led a pullback Tuesday; positioning lightens ahead of Fed minutes and Jackson Hole.
📊 Key Data Releases & Events (ET)
7:00 AM — MBA Mortgage Applications (weekly). Prior: +10.9% w/w (8/13). Why it matters: housing demand pulse → rates/affordability → AMEX:XHB and growth tone.
10:30 AM — EIA Weekly Petroleum Status. Prior crude change: +3.036M bbl. Why it matters: oil balance → gasoline/diesel → inflation & AMEX:XLE path.
1:00 PM — U.S. 20-Year Treasury Auction. Typical close: 1:00 ET; also 17-week bill today. Why it matters: term-premium & risk appetite; tails/stop-throughs can shake $TLT/$TNX.
2:00 PM — FOMC Minutes (July 29–30). Watch for: depth of cut debate, tariffs → inflation, labor cooling. Why it matters: reprices path-of-rates across curve and equities.
Earnings (before open): LOW, TGT, TJX, ADI (+ others). Why it matters: U.S. consumer & capex reads; category mix shifts. Lowe’s call 9:00 AM.
⚠️ Disclaimer: Educational/informational only — not financial advice.
📌 #trading #stockmarket #SPY #SPX #Fed #FOMCMinutes #JacksonHole #DXY #TLT #XLE #LOW #TGT #TJX #ADI