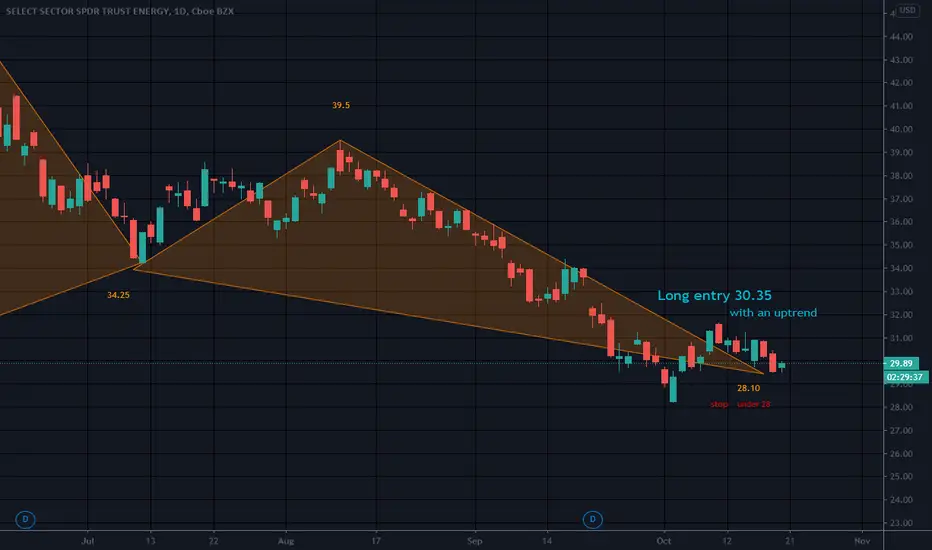
Bullish Bat Bottom Fishing Falling WedgeCan oil go much lower?
Upper trendline of FW is at 30.70
Long at entry level with an UPTREND
Possible T2/Long term/ 58.6 to 67
op 10 Holdings
XOM - Exxon Mobil Corp22.86%
CVX - Chevron Corp22.77%
COP - ConocoPhillips4.77%
KMI - Kinder Morgan Inc Class P4.58%
WMB - Williams Companies Inc4.55%
PSX - Phillips 664.32%
SLB - Schlumberger Ltd4.12%
EOG - EOG Resources Inc3.99%
MPC - Marathon Petroleum Corp3.64%
VLO - Valero Energy Corp3.37%
Not a recommendation
Trade ideas


Oil and Energy Markets finding a Perfect Storm?It wasn't market makers who named the latest U.S. Hurricane "Delta," but they probably would have suggested the same name if anyone asked them. With the storm about to hit the gulf shores in the U.S. causing lockdowns in oil and gas facilities in the region, supplies of oil and natural gas are both constrained. This comes right at time when demand is increasing in the U.S. economy, and buyers are returning to the market. It could be a perfect storm for the Energy sector AMEX:XLE in U.S. stocks, and for commodity currencies such as the Aussie FX:AUDUSD , Loonie FX:USDCAD , and Pound FX:GBPUSD .

XLE break to the upside. Target 31.50Plotting the XLE index with 4 hour candles, we observe a clear downward tendency since mid August. However, the 20 MA suggests a bottom at around 29.75, with the price closing above the MA for the last 8 candles (roughly 4 days). If the price can close above 31.50 tomorrow, we are bullish towards 32.50 as our first objetive.

OPENING (IRA): XLE NOVEMBER/DECEMBER/JANUARY 26/27/28 SHORT PUT... ladder for a total of 2.17 in credit.
Notes: 30-day implied at 39.47% with expiry-specific implied at 43.4%, 42.9%, and 43.4% for November, December, and January, respectively. Current yield of 6.71%, so am fine with taking on shares and covering or just keeping the premium.

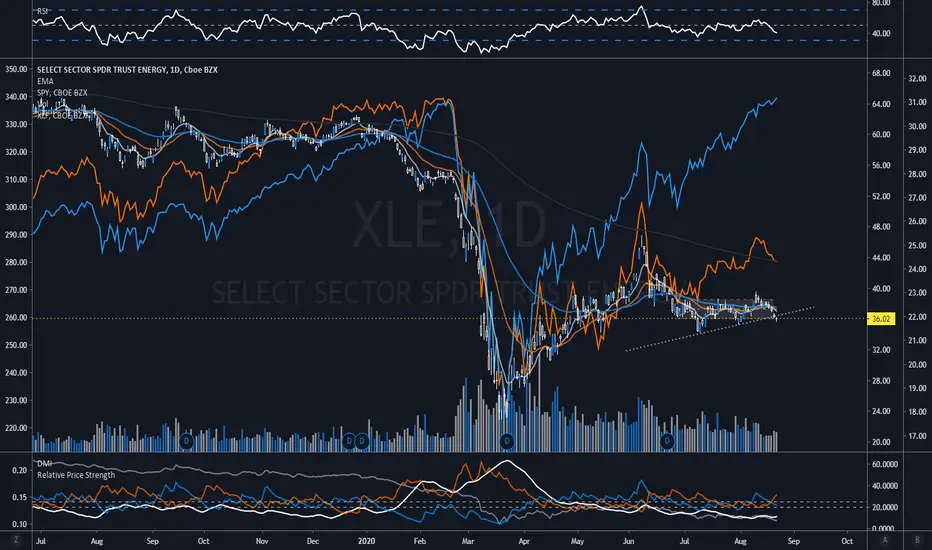
XLE OutlookXLE looks for further down side. The RSI is down on the floor, but I am not expecting a bounce until the purple box.
I am expecting this to revisit it yearly lows in the next few weeks.

Good opportunity to short XLE on this recent popXLE looks extremely bearish. Might be a good idea to sell some call credit spreads to benefit from the last pop and ride it more to the downside.

Price of Oil rising while XLE fallsFutures on crude oil is increasing while XLE is flat or declining. The gap is widening. Bottom indicator is taking the 100 day % change of each and comparing.
How much does XLE need to move to catch up?
Is the tech bubble holding XLE down?
How resilient would XLE be against the market further correcting?


$XLE ; the one XL with a good call/put ratio , targeting $40its oversold conditions and its 0.7 put/call ratio on open interests is the only bullish XL etf in the sector

LONG XLE Nice long here. XLE broke (purple) triangle bearish but saw no follow through as it got bid up from 35.30 support on 08/27. Huge support between 34.26 & 35.30 with 34.88 being the 50% retracement of Covid low to high of Covid bounce. This support area has held since early May and should continue to hold unless we see a significant sell off in the broader markets. Falling wedge (yellow) coinciding with this support also. Could really see an explosive move here, and accompanied with a hard 34.30 stop Risk/Reward is highly favorable.