Trade ideas

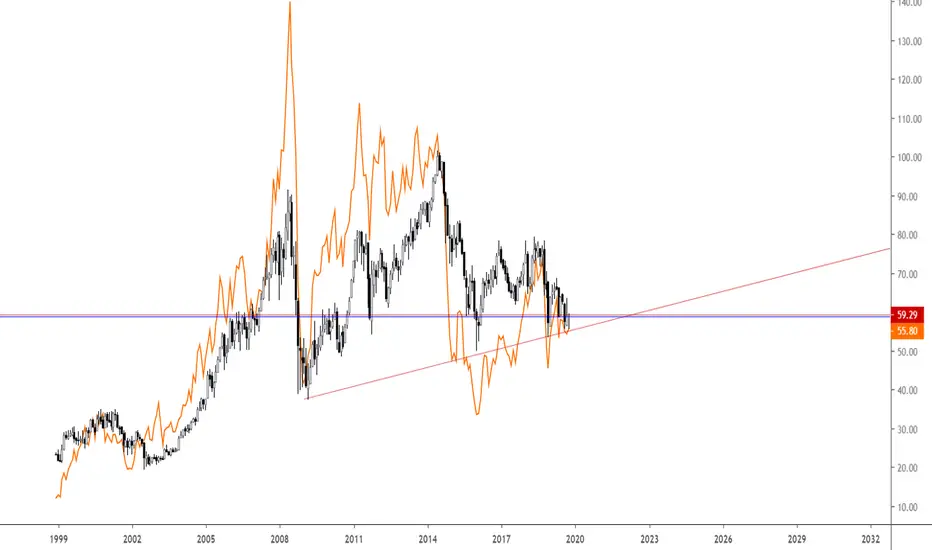
Both oil and Energy in a Make or break situation here double topwe are right at the trendline here $62 … cross it up and we could move higher or are we moving down lower …..

XLE Above red area bullish. Below red area bearishNice move up in oil today so far but everyone will still be thinking short until XLE gets above this red area and find support.


XLE - Just a boost of energyThere is a double bottom pattern dating back to late August. Energy has been the laggard YTD & is the only sector in the red over the last year. This may be the beginning of the sector finding some strength.
If you take the Fibonacci 161.8% extension that gets you to a target of $68.79. The actual pattern breakout price target would be $71.60.

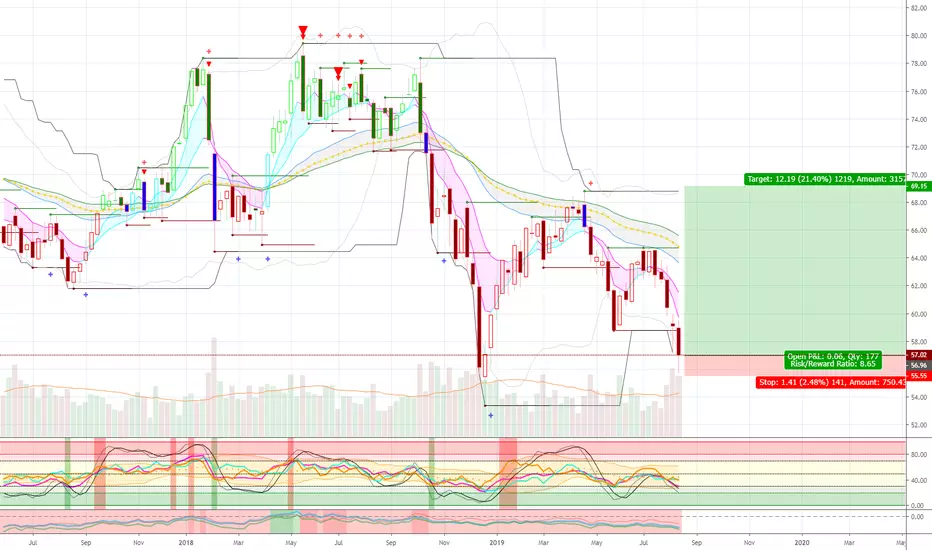
Long Energy Idea22/Oct/2019 01:20 PM AUTHOR: Brandon Gum
--
Stop marked in pink. Not sure on target.
Objective here is to think level to level moving forward.
======================


Energy; The Contrarian PositionEnergy is now historically low in regards to it's percentage allocation in the S&P 500 components.
Likely going to build a long term position if we reach the target, likely early 2020
XOP 3x levered GUSH is trading in the $2's haha... going to need to split soon

SPDR energy sector double bottom and upside divergence XLE has a good double bottom and modest upside divergence. grabbing some oct 11 57.5 calls at 41c

XLE - The time has comeAs the last published idea, I recommended to Buy when price re-test the old bearish trendline. Besides, the price now is supported by a short-term bullish trendline. I believe the time has come for us to get a long position. However, we should consider the possibility that the price would continue to fall and return the bearish trend.
There are 2 strategies:
1. Buy and set SL around 59-59.5
2. If the price breaks down the trend and hit SL. => Wait


Dark matter Energy. Been tracking sectors for opportunities..
This one is a nice entry on the monthly.

XLE - Chance to hold As we can see from the chart, the price had increased over the bearish trendline - which had stood for months, and reached the resistance of EMA 200-period. Besides, the price still created a long tail, although there was massive Sell Volume.
=> XLE would have a great chance of going up.
There are two strategies for this:
1. Going long whenever the price close above the EMA 200-period
2. Wait for the price to test the bearish trendline again and get a long position.


XLE - Quick Short. Bear Call SpreadLong Term Trend Downwards.
Increase in Volume.
RSI >85
PA recent Short term push but looking for Revert to Mean Lower.
Taking 57/58 Call Credit Spread
Also 56 Put for Directional Bias Lower.
Sept 20th Exp
Good Luck - Watch your $$$ RISK

XLE - possible upsideProbably too early to have much confidence in this count, especially with that large red monthly bar, but is this count a possibility for the energy sector going forward?

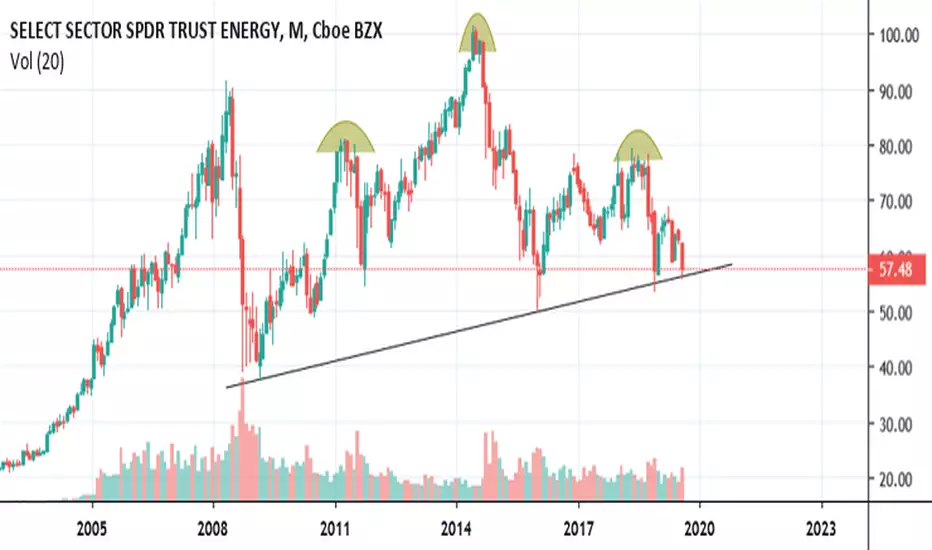
$XLE Possible H&S on multi year chart.Needs to stay above the bottom trend line, or it gets ugly. lots of selling volume recently.
When to Buy a DownTrendThree factors; Seasonals are positive for the next sixt weeks, we broke down through two standard deviations of the channel and reversed higher, and our Momentum Reversal signal flashed a buy (Trade genius Money maker). This is a tradeable event. Now go and search the components and select the trade that fits your criteria.

56.5 xle line in the sand xle has not had a monthly close below 56.5 for many years, ...scratching at the door
