Amgn on SupportAmgn has bounced from this level 3 times before. Daily Macd is about to turn. RSI is indicating Oversold. Might go 230+
Trade ideas

Amgen (AMGN) Swing- Solid company
- Has had downward trend for weeks but is now at support
- For the six months ended 30 June 2021, Amgen, Inc. revenues increased less than 1% to $12.43B.
- Net income decreased 42% to $2.11B. Revenues reflect Prolia segment increase of 20% to $1.57B
- Other revenues segment increase of 28% to $721M, also reflect Enbrel segment decrease of14% to $2.07B, Neulasta segment decrease of 19% to $968M.
- Net income was partially offset by Research and development increase of 7% to $2.05B (expense), Selling.

$AMGN with a Neutral outlook following its earnings #Stocks The PEAD projected a Neutral outlook for $AMGN after a Negative Under reaction following its earnings release placing the stock in drift D with an expected accuracy of 71%.
If you would like to see the Drift for another stock please message us. Also click on the Like Button if this was useful and follow us or join us.

Bias: UpOverall in a triangle formation. Expecting a break of the triangle in future. Potential buy trade. Make sure to apply SL & TP.

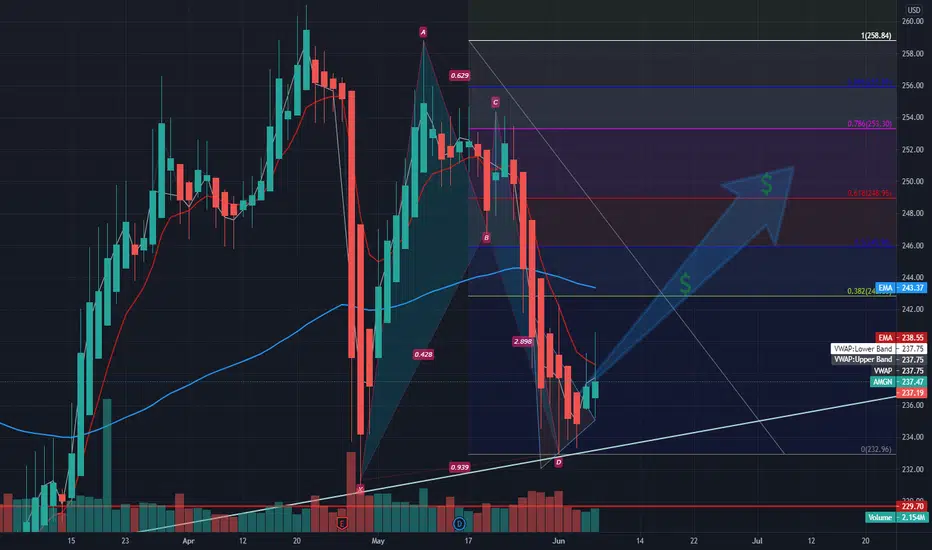
Buy on Break-Out - AMGN [S] 1 June 2021AMGN
Relative Volume: 1.23
Fib Extension 0.618: Swing price target 251.75
Annual Performance: 4.86%
Monthly Performance: 4.8%
Trend
Monthly: Uptrend
Weekly: Side
Daily: Uptrend
EMA: Potentially bullish on breakout
Slow Stochastics: Golden Crossover
RSI: Overbought zone
Put/Call Ratio: 0.292
Wait for breakout during final trading hour
TF1D Break-out at 241
TF1H Confirmation: Green Volume

Symmetrical TrianglePattern is neutral until a trendline has been broken.
No recommendation.
This does not appear to be a tight triangle, yet.

$AMGN with a Neutral outlook following its earnings #Stocks The PEAD projected a Neutral outlook for $AMGN after a Negative Under reaction following its earnings release placing the stock in drift D
If you would like to see the Drift for another stock please message us. Also click on the Like Button if this was useful and follow us or join us.


another rejectionwhy would Amgen breakout here? Well, maybe it won't, and the goons pumping it on national television are taking the other side as it approaches a perennial resistance ceiling...or maybe the assumption of it's inclusion in the XLV weighted at 3.4% is enough for fund flows to push it over $260.
With COVID raging in the prior December quarter, they could miss on earnings, and give strong guidance going forward, but at 21x, looks baked in. And this thing could get swept up in a market decline.


Buy $AMGN - NRPicks Feb 14Amgen is a leader in biotechnology-based human therapeutics, with historical expertise in supportive care products for kidney disease and cancer. Flagship drugs include the red blood cell stimulators Epogen and Aranesp, the immune system stimulants Neupogen and Neulasta, and Enbrel and Otezla for inflammatory diseases.
Amgen is one of the best positioned in the pharmaceutical industry. In 2020, the company generated higher earnings than in 2019, due to its strong product pipeline. Financially speaking, the company maintains controlled debt levels that it will be able to meet without any problems.
Fundamentals:
- Value
- 8.8% estimated net earnings growth over the next 3 years.
- P/E 19x vs. 29.6x industry P/E
Technicals:
- Price level cross MA 200 - 50
- Williams R% at -91% levels
- RSI (41) Neutral
- -2.8% average upside during the month
On January 28th there was a market correction, which also affected Amgen. Although the correction lasted a couple of days, the share price continued to fall until $232.10. From this point, the stock recovered 2.5% and remains at these levels; however, the recovery channel should continue as there are no clear retracement fundamentals. In terms of technical factors, we can see that the SMA and Williams R% favor a buy decision.

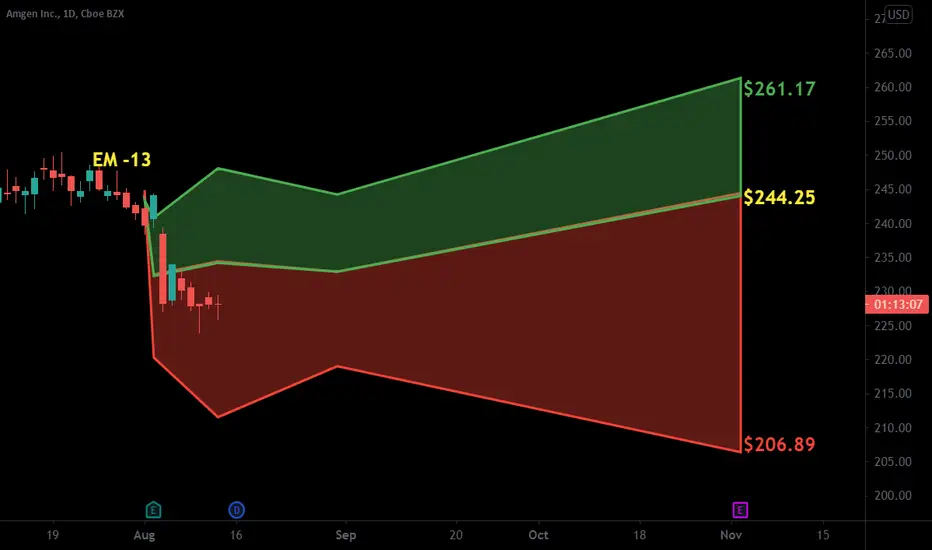
Amgen might move down soon according to the RSI....I have changed up how to best display projected movement. In the case of AMGN triggered a SELL on my RSI algorithm on March 19, 2021. Equities nearly always obey the signal and move down, but sometimes it may continue to move up first.
I have placed two red boxes and two green boxes on the chart. The larger red box depicts all of the historical movement, from a percentage standpoint, that this stock has moved on the Daily chart after a SELL signal occurred. Therefore, this box represents 100% of previous movement upward before the stock finally moved downward. The smaller red box represents 50% of all historical movement upward, before the stock moved downward. The smaller box is more of a precise target for the potential top in this instance.
The green boxes represent the same thing. In this instance, the smaller green box would be my projected target for the final bottom.
The black dotted arrow represents median historical movement. Medians are a good metric, but they are just one of many I use when forecasting future movement.
As always, the stock could decline the very next bar after the signal without looking back (therefore the red boxes would not come into play) or the stock may never decline (and the green boxes may never come into play).
All statistics and the full analysis are available for free as always at the site below.

$AMGN with a Bullish outlook following its earnings #Stocks The PEAD projected a Bullish outlook for $AMGN after a negative Over reaction following its earnings release placing the stock in Drift C
If you would like to see the Drift for another stock please message us. Also click on the Like Button if this was useful and follow us or join us.
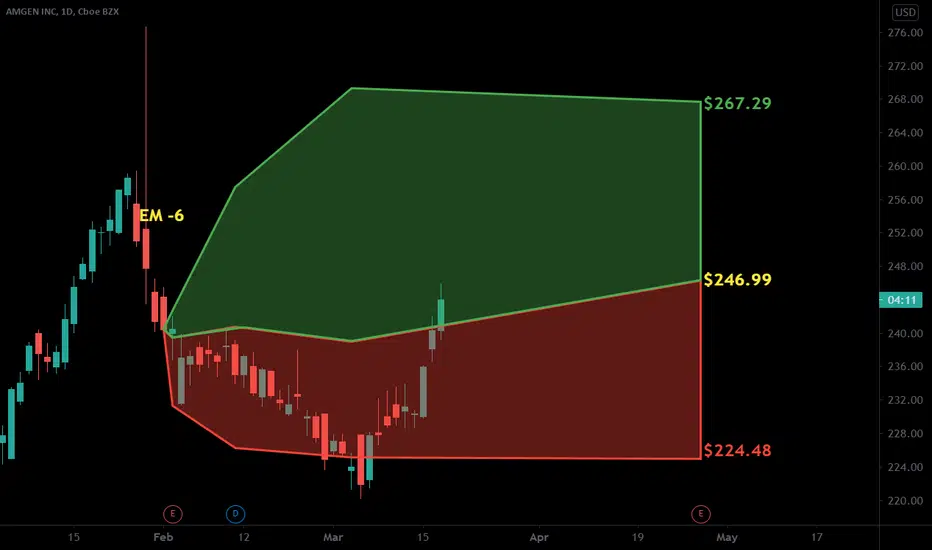
Amgen: Ready for Take-Off? 🚀As we have predicted, the Amgen stock has decreased and entered the green box between $242.09 - $223.78. From here, we expect the stock to jump over $276.69. For this primary scenario, we have calculated a probability of 68%. In order not to endanger this scenario, the price needs to stay above $218.97. Below that mark, there is a 32% chance of a further drop all the way down to an area around $187.02.
Happy trading!


AMGN Attractive 237$ levelAMGN is at an attractive buying zone at 237$ per share. I see stock going up 5-10% where I would start taking profits. Using leverage or options would be a good play for this stock.
Technical Info:
Stock is at a confluence of several moving averages which will help rebound.
The stock is trading in sideways/up pattern and therefore is likely to continue or go up.
RSI is neither overbought or oversold. Once RSI gets above 50, high probability of stock going up 5%-10%.


AMGN BOUNCE Good reaction in Fibo clusters. Near strong dynamic support, makes sense to get in now. First thought is seeing this in $247 in the near future and then going back to the $258 resistance. My stop loss goes with the dynamic trendline acting as a support. I am in!

Potential AMGN long?Hi guys, I'm new to trading and this is my first post so could do with some feedback. Noticed a clear resistance and support line on the AMGN ticker. With a low RSI score does this stock have the potential for a breakout if it bounces off the support line again?

Understanding range highs and lows are all you need. #stocksBack on October 27th I made a post highlighting a potential reversal as we approached the range lows from back in June. Over the future months the stock tested the lows, found support, and is not heading toward highs. Range highs and lows and major support and resistance areas have value because they indicate where there is likely to be heavy order flow. In this case it AMGN reacted well and held the lows creating a great risk/reward opportunity.

NASDAQ:AMGN Possible Breakout Opportunity (Longer Term)I like the Weekly setup on this NASDAQ stock, the breakout target if reached would be near the Yearly R2 Pivot @ ~310
