Seems like a strong breakout for $AMGNSymbol: AMGN
AssetType: Common Stock
Name: Amgen Inc
Description: Amgen Inc. discovers, develops, manufactures, and delivers human therapeutics worldwide. It focuses on inflammation, oncology/hematology, bone health, cardiovascular disease, nephrology and neuroscience areas. The company's products include Enbrel to treat plaque psoriasis, rheumatoid arthritis, and psoriatic arthritis; Neulasta, a pegylated protein to treat cancer patients; Prolia to treat postmenopausal women with osteoporosis; Xgeva for skeletal-related events prevention; Aranesp to treat a lower-than-normal number of red blood cells and anemia; KYPROLIS to treat patients with relapsed or refractory multiple myeloma; Sensipar/Mimpara to treat secondary hyperparathyroidism; and EPOGEN to treat anemia caused by chronic kidney disease. It also markets other products in various markets, including Nplate, Vectibix, Repatha, Parsabiv, BLINCYTO, Aimovig, NEUPOGEN, Otezla, AMGEVITA, KANJINTI, EVENITY, IMLYGIC, MVASI, and Corlanor. Amgen Inc. serves healthcare providers, including physicians or their clinics, dialysis centers, hospitals, and pharmacies. It distributes its products through pharmaceutical wholesale distributors, as well as direct-to-consumer channels. The company has collaboration agreements with Novartis; UCB; Bayer HealthCare LLC; BeiGene, Ltd.; QIAGEN N.V.; Adaptive Biotechnologies; and Eli Lilly and Company, as well as has a strategic agreement with McKesson Corporation to help improve cancer care in community oncology settings. Amgen Inc. was founded in 1980 and is headquartered in Thousand Oaks, California.
Exchange: NASDAQ
Currency: USD
Country: USA
Sector: Healthcare
Industry: Drug Manufacturers-General
Address: One Amgen Center Drive, Thousand Oaks, CA, United States, 91320-1799
FullTimeEmployees: 23400
FiscalYearEnd: December
LatestQuarter: 2020-09-30
MarketCapitalization: 142916681728
EBITDA: 12647000064
PERatio: 19.7992
PEGRatio: 1.5407
BookValue: 18.781
DividendPerShare: 7.04
DividendYield: 0.0287
EPS: 12.399
RevenuePerShareTTM: 42.405
ProfitMargin: 0.2942
OperatingMarginTTM: 0.3757
ReturnOnAssetsTTM: 0.0945
ReturnOnEquityTTM: 0.6718
RevenueTTM: 24987000832
GrossProfitTTM: 19006000000
DilutedEPSTTM: 12.399
QuarterlyEarningsGrowthYOY: 0.049
QuarterlyRevenueGrowthYOY: 0.12
AnalystTargetPrice: 255.28
TrailingPE: 19.7992
ForwardPE: 13.7741
PriceToSalesRatioTTM: 5.5562
PriceToBookRatio: 12.4317
EVToRevenue: 6.4341
EVToEBITDA: 12.4492
Beta: 0.7616
52WeekHigh: 261.431
52WeekLow: 173.5108
50DayMovingAverage: 229.69
200DayMovingAverage: 238.9139
SharesOutstanding: 582169024
SharesFloat: 581126530
SharesShort: 6958047
SharesShortPriorMonth: 6912555
ShortRatio: 2.82
ShortPercentOutstanding: 0.01
ShortPercentFloat: 0.012
PercentInsiders: 0.188
PercentInstitutions: 77.988
ForwardAnnualDividendRate: 7.04
ForwardAnnualDividendYield: 0.0287
PayoutRatio: 0.3993
DividendDate: 2021-03-08
ExDividendDate: 2021-02-11
LastSplitFactor: 2:1
LastSplitDate: 1999-11-22
Trade ideas

AMGN LONG compared with the DOWIn order to enhance your plays when it comes to options(stocks), it will help to compare the stock to its relative index it is in. This was a stock I happened to come across just doing some random backtesting and saw a nice 4hr candle that could potentially cause a reaction for more upside. I forgot about it and came back about 2weeks later and saw my area was triggered. We got a reaction to the upside exactly what I was looking for. The second entry came at a time when the indexs (SPX, US30, NAS100) were selling off, so I was looking for any divergence between the stock and its pair. As you can see, the DOW created a lower low basically running for stops while AMGN was holding structure. This was a very strong confirmation of this trade panning out because whenever the DOW would gain strength, it would push AMGN higher and that is seen through current price. The target price is $250 where lies a gap in the market so I am looking for that to get filled. Divergence in the market is when two correlating assets are doing opposite things. If you can spot a divergence aligned with any other confirmations you may have, the trade will most likely playout nicely

AMGEN keeps pressing along from BUY signal. ATH here we come!Follow up to the AMGN video post.
$AMGN has been going strong, other than the brief respite for the bulls.
Earnings run up should take us to .786 FIBO and perhaps past all-time highs?
Happy Trading, from CJ -- aka the greatest FURU.
To find out more about The Ultimate Stock Indicator on Tradingview, please check my public profile.


AMGN triangle break out If you follow me for a while, you know I like to play triangle patterns and somehow familiar with it. This one is also pretty easy to notice, however target is being blocked by the trendline resistance, be patient for entry 15 30 days play.


$AMGN - in a new trendAMGN has broken its down trend and is slowly snaking upwards. Watch for a pull back, reanalyze for entry for continued climb north.


AMGN - Bullish TriangleStill bouncing inside the setup as consolidation move. Waiting for the price to bounce outside.

ABC BullishAmgn fell from a rw at 239ish and put a damper on the prior rally..it seems to be recovering ..
Looks like amgn made some sideways movement with R overhead..
Possible stop under C..
Pick a good entry if you like this stock and trade safely..
Long term uptrend...(20 yr monthly) with turbulence as of late..trend are hard to change though..like a big steam ship...they can't stop on a dime..but they can eventually stop and turn around...
Not a recommendation


$AMGN - NR Picks Nov 22Amgen se dedica a descubrir, desarrollar, fabricar y ofrecer terapias humanas en todo el mundo. Se centra en las áreas de inflamación, oncología / hematología, salud ósea, enfermedades cardiovasculares, nefrología y neurociencia.
La compañía tuvo una reacción positiva a inicios de mes cuando presentó una actualización de su fármaco para la psoriasis, durante el mes el precio de la acción fue cayendo hasta estar cerca a los niveles pre-reacción.
Este retroceso se ve como una oportunidad para Amgen , recordemos que esta compañía es una de las mas importantes del sector. Creemos que el interés de los inversores durante el mes ha cambiado a compañías que están brindando actualizaciones sobre el desarrollo de la vacuna contra el COVID-19.

$AMGN - NR Picks Nov 22Amgen se dedica a descubrir, desarrollar, fabricar y ofrecer terapias humanas en todo el mundo. Se centra en las áreas de inflamación, oncología / hematología, salud ósea, enfermedades cardiovasculares, nefrología y neurociencia.
La compañía tuvo una reacción positiva a inicios de mes cuando presentó una actualización de su farmaco para la psoriasis, durante el mes el precio de la accion fue cayendo hasta estar cerca a los niveles pre-reacción.
Este retroceso se ve como una oportunidad para Amgen, recordemos que esta compañía es una de las mas importantes del sector. Creemos que el interes de los inversiores durante el mes ha cambiado a compañías que estan brindando actualizaciones sobre el desarrollo de la vacuna contra el COVID-19.

AMGN UP or DOWNWe see all time triangle for amgn/spx,
recent descending channel and breakout with attempt to return to the channel
we possibly can go either way

Amgen Nears a Death CrossMany stocks have hit new highs this month, but Amgen isn’t one of them.
The biotech may be showing signs of topping out. The main thing jumping off its chart now is the falling 50-day simple moving average (SMA). Current prices have dropped back to the 200-day SMA. If the trend continues, it could produce a “death cross.”
Next, why is AMGN’s 50-day SMA falling? The reason can be found on October 8 when a potential heart drug failed to reduce death in a phase 3 trial. Its partner, Cytokinetics , lost more than 40 percent of its value on the news.
Third, AMGN’s last peak occurred at almost exactly the same price around $241 where it ended 2019. It’s back in negative territory YTD and at risk of potentially bearish window dressing into December.
Fourth, stochastics have been overbought -- even as the stock made a lower high versus early October.
Finally, relative strength has been poor in big pharma. Most of the gains in health care lately has been in HMOs, hospitals and medical devices. For an example of the weakness, just look at Pfizer or Gilead Sciences. Even with Covid products, they haven’t been able to advance.
Investors should always be wary of stocks falling when the market’s rising because it can foreshadow broader distribution.
TradeStation is a pioneer in the trading industry, providing access to stocks, options, futures and cryptocurrencies. See our Overview for more.


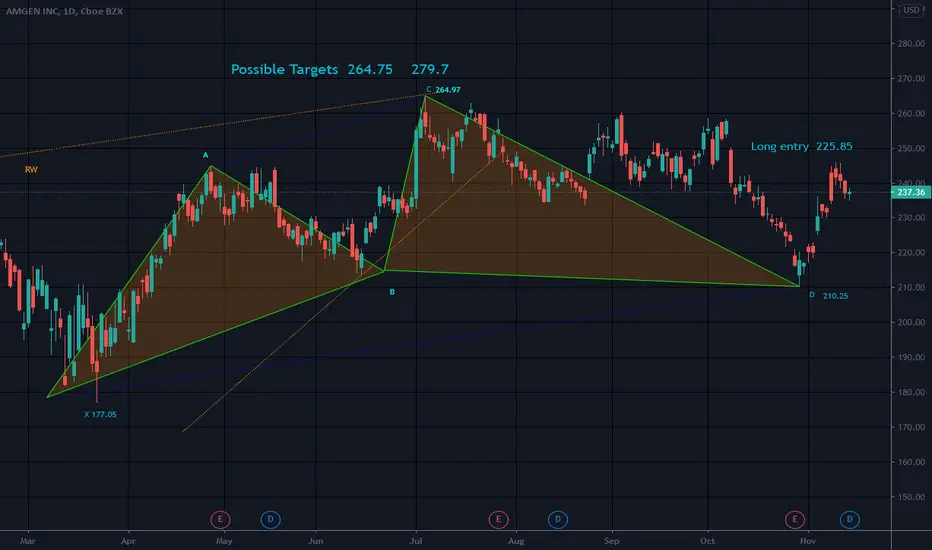
Bullish Cypher PatternPossible stop below D or 210.75
Possible long term targets 321.9 to 352
Amgen tried to break out several weeks ago and did not hit targets. Perhaps the bearish rising wedge won the battle
It has been a bit stagnant for a while but is over LE level for this pattern
The cypher is a five point harmonic chart pattern, made up of points XABCD. The cypher is easy to spot on a chart because it has a characteristic wave like appearance displaying either rising peaks or falling valleys.
In any cypher, points X, C and D are the critical points. For a bullish cypher, X should be the pattern low and C the pattern high. A bearish cypher makes its high at X and its low at D.
The cypher is a technical wave pattern in which the market is trending but is making sharp reversals along the way.
Will earnings create a new up wave for Amgen?Price has entered the same region its last major up wave started. An earnings surprise could be the catalyst.

Bullish Gartley PatternA clean harmonic trading setup.
Pls wait for furtherconfirmation like candlestick pattern in the blue zone, before executing the trade!


