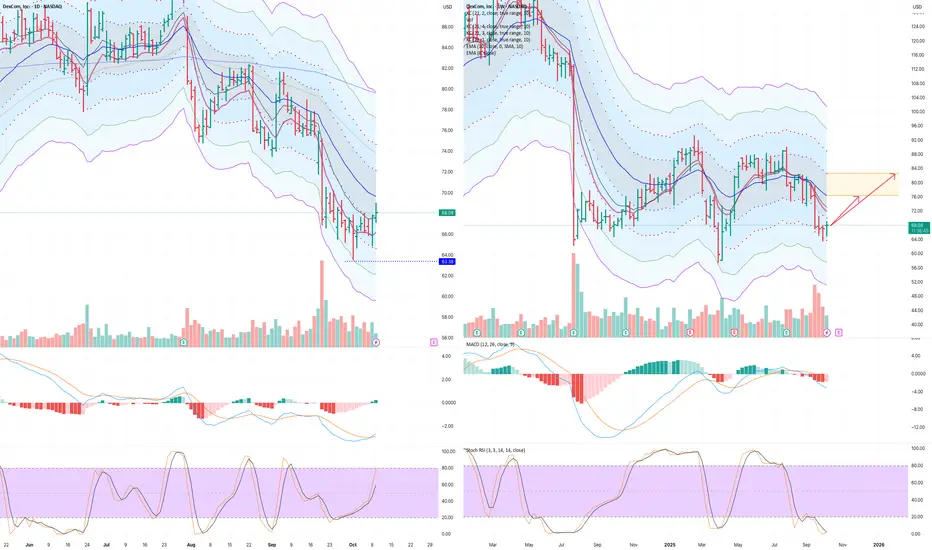
Bullish divergence + finger pattern Weekly DXCM (Dexcom)Bullish divergence incl finger pattern on weekly.
Also support has been tested and stochastic RSI maximally oversold. I expect this to turn up
TP1
76,8
TP2
82,62
Entry
68,08
SL
63,49
R/R TP1
1.9
Trade #00013
Key facts today
Next report date
—
Report period
—
EPS estimate
—
Revenue estimate
—
1.467 CHF
523.30 M CHF
3.66 B CHF
384.35 M
About DexCom, Inc.
Sector
Industry
CEO
Jacob S. Leach
Website
Headquarters
San Diego
Founded
1999
ISIN
US2521311074
FIGI
BBG00LVD7CL3
DexCom, Inc. is a medical device company, which engages in the design, development, and commercialization of glucose monitoring systems for ambulatory use by people with diabetes. Its products include Dexcom G6, Dexcom G7, Dexcom Stelo, Dexcom Share, Dexcom Real-Time API, and Dexcom ONE. The company was founded by John F. Burd on May 13, 1999 and is headquartered in San Diego, CA.
Related stocks
TradeUSAsignals RecommendationsDXCM - Short (5% of your portfolio) - Order filled @ 75.7
We have a downtrend dominated by bargain hunters, with a strong break below the lower boundary of the channel

$DXCM – Bearish Setup Developing📉 NASDAQ:DXCM – Bearish Setup Developing
DexCom ( NASDAQ:DXCM ) took a major hit today after cutting revenue guidance by 12% to $1.2B.
A 30% drop in user base triggered an 11% selloff, confirming structural weakness.
Options flow shows strong bearish positioning:
🔻 3,000-lot block of Nov $65 pu
Breakout coming soon Price is ready to break 90$ resistance (light blu line) !
A large GAP is also waiting to be filled above 90$
I think everything is ready to push price up

DXCM DexCom Options Ahead of EarningsAnalyzing the options chain and the chart patterns of DXCM DexCom prior to the earnings report this week,
I would consider purchasing the 90usd strike price Calls with
an expiration date of 2025-2-21,
for a premium of approximately $1.65.
If these options prove to be profitable prior to the earnings

BreakoutPrice finally breaking out of green channel up
A lot of GAPs are waiting to be filled upward

$DXCM - Breaking Out Now! 46% Upside!Chart #20/ 40: NASDAQ:DXCM 🏥
-Symmetrical Triangle Breakout with breakdown Retest
-H5 Indicator is Green
-Williams Consolidation Box Support Created
-AVP Shelf to launch off with Massive VOLUME GAP
🎯$110📏 $91 ⏳ Before APR2025
NFA


DXCM LongLong on Diabetes. Diabetes will only get worse as we continue to eat garbage everyday. Fib level.

See all ideas
Summarizing what the indicators are suggesting.
Neutral
SellBuy
Strong sellStrong buy
Strong sellSellNeutralBuyStrong buy
Neutral
SellBuy
Strong sellStrong buy
Strong sellSellNeutralBuyStrong buy
Neutral
SellBuy
Strong sellStrong buy
Strong sellSellNeutralBuyStrong buy
An aggregate view of professional's ratings.
Neutral
SellBuy
Strong sellStrong buy
Strong sellSellNeutralBuyStrong buy
Neutral
SellBuy
Strong sellStrong buy
Strong sellSellNeutralBuyStrong buy
Neutral
SellBuy
Strong sellStrong buy
Strong sellSellNeutralBuyStrong buy
Displays a symbol's price movements over previous years to identify recurring trends.
Frequently Asked Questions
The current price of DC4 is 52.389 CHF — it has increased by 13.28% in the past 24 hours. Watch DexCom, Inc. stock price performance more closely on the chart.
Depending on the exchange, the stock ticker may vary. For instance, on BX exchange DexCom, Inc. stocks are traded under the ticker DC4.
DC4 stock has risen by 13.28% compared to the previous week, the month change is a −1.04% fall, over the last year DexCom, Inc. has showed a −11.99% decrease.
We've gathered analysts' opinions on DexCom, Inc. future price: according to them, DC4 price has a max estimate of 89.95 CHF and a min estimate of 54.61 CHF. Watch DC4 chart and read a more detailed DexCom, Inc. stock forecast: see what analysts think of DexCom, Inc. and suggest that you do with its stocks.
DC4 stock is 11.72% volatile and has beta coefficient of 1.41. Track DexCom, Inc. stock price on the chart and check out the list of the most volatile stocks — is DexCom, Inc. there?
Today DexCom, Inc. has the market capitalization of 20.53 B, it has increased by 1.39% over the last week.
Yes, you can track DexCom, Inc. financials in yearly and quarterly reports right on TradingView.
DexCom, Inc. is going to release the next earnings report on Feb 5, 2026. Keep track of upcoming events with our Earnings Calendar.
DC4 earnings for the last quarter are 0.49 CHF per share, whereas the estimation was 0.46 CHF resulting in a 5.85% surprise. The estimated earnings for the next quarter are 0.52 CHF per share. See more details about DexCom, Inc. earnings.
DexCom, Inc. revenue for the last quarter amounts to 963.20 M CHF, despite the estimated figure of 942.84 M CHF. In the next quarter, revenue is expected to reach 998.79 M CHF.
DC4 net income for the last quarter is 226.05 M CHF, while the quarter before that showed 142.65 M CHF of net income which accounts for 58.46% change. Track more DexCom, Inc. financial stats to get the full picture.
No, DC4 doesn't pay any dividends to its shareholders. But don't worry, we've prepared a list of high-dividend stocks for you.
As of Dec 8, 2025, the company has 10.3 K employees. See our rating of the largest employees — is DexCom, Inc. on this list?
EBITDA measures a company's operating performance, its growth signifies an improvement in the efficiency of a company. DexCom, Inc. EBITDA is 814.10 M CHF, and current EBITDA margin is 20.28%. See more stats in DexCom, Inc. financial statements.
Like other stocks, DC4 shares are traded on stock exchanges, e.g. Nasdaq, Nyse, Euronext, and the easiest way to buy them is through an online stock broker. To do this, you need to open an account and follow a broker's procedures, then start trading. You can trade DexCom, Inc. stock right from TradingView charts — choose your broker and connect to your account.
Investing in stocks requires a comprehensive research: you should carefully study all the available data, e.g. company's financials, related news, and its technical analysis. So DexCom, Inc. technincal analysis shows the sell today, and its 1 week rating is sell. Since market conditions are prone to changes, it's worth looking a bit further into the future — according to the 1 month rating DexCom, Inc. stock shows the sell signal. See more of DexCom, Inc. technicals for a more comprehensive analysis.
If you're still not sure, try looking for inspiration in our curated watchlists.
If you're still not sure, try looking for inspiration in our curated watchlists.