Head and shoulders forming on FTNTThankfully I sold my calls on this when they were up a few hundred %, didnt get to hit price targets as tech stocks corrected. Head and shoulders forming nonetheless.
Fortinet, Inc.
No trades
Trade ideas

FTNT check-in on call setup, exit pricesMy colleague pointed this one out fundamentally right after the irrational sell-off. I entered an October call setup at a favorable level and have watched the slow uptrend. Exit prices marked in green for first sell and the horizontal blue above.

Fortinet FTNT Overreaction - What now?Slightly after earnings Fortinet Gapped down. Which are my favorite kind of stocks to trade because 9 times out of 10 Gaps close.
Fortinet had many analyst reiterate Bullish price targets some up to $70. I'm looking for a retest at $60.
Forecasting out to nov 2nd. The next earnings should be interesting.
Williams, MACD, & RSI are all showing Oversold in this situation. This could be a solid entry for someone to start a small position.
This is not financial advice.
Trade Responsible,
#TradeTheWave 🏄🏽♂️🌊

FTNT to 74FTNT (Fortinet, Inc.) has been performing well since November 2022, with a breakout in February 2023. Currently, it’s retesting the breakout level, which aligns with an upward trend line from November. There’s also a support area at 54.57 due to a daily gap . If FTNT holds its current level, it could target 74, in line with a gap above.

FTNT finding strong support after irrational selloffFTNT was pointed out by MoC as the top cybersecurity play in the market. This stock has sold off at irrational levels even after strong earnings. Looking for call setups into Oct-Jan.

Fortinet Inc (NASDAQ:FTNT)Fortinet, Inc. provides cybersecurity solutions to a variety of businesses,
such as enterprises, communication service providers and small businesses.
The stock has enjoyed a steady rise in price since February and is currently
up +46.43% year to date.
The recent boost in buying volume and relative strength suggests the move
may not yet be over.
This content is provided for general information purposes only and is not to be taken as investment advice nor as a recommendation for any security, investment strategy or investment account.

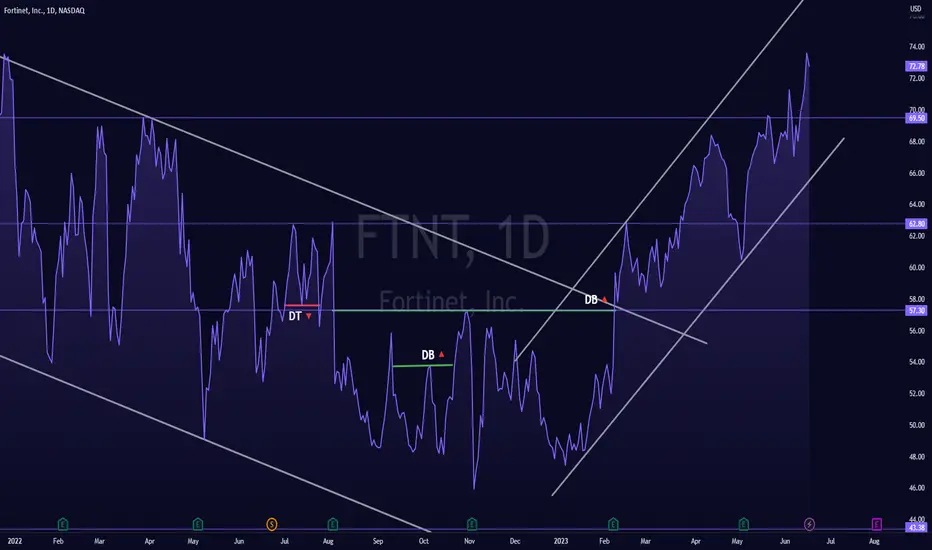
FTNT - Rising Trend Channel [MID TERM]🔹FTNT is in a rising trend channel in the medium long term.
🔹FTNT surges after double bottom formation break through resistance at 57.16.
🔹supports at 69.50 for negative reaction.
🔹Overall assessed as technically positive for the medium long term.
Chart Pattern;
🔹DT - Double Top | BEARISH | 🔴
🔹DB - Double Bottom | BULLISH | 🟢
🔹HNS - Head & Shoulder | BEARISH | 🔴
🔹REC - Rectangle | 🔵
🔹iHNS - inverse head & Shoulder | BULLISH | 🟢
Verify it first and believe later.
WavePoint ❤️

ftnt for the futureforget when this was charted but looks like its headed twords the upside! pushing for new ath? potential

FTNT - Breakout Rising Trend Channel- FTNT has broken the floor of the rising trend channel in the medium long term, which indicates a weaker initial rising rate.
- FTNT has met the objective at 66.36 after a break of the double bottom formation.
- FTNT has support at 62.70 and resistance at 69.40.
- Overall assessed as technically positive for the medium long term.
*EP: Enter Price, SL: Support, TP: Take Profit, CL: Cut Loss, TF: Time Frame, RST: Resistance, RTS: Resistance to be Support LT TP: Long Term Target Price
*Chart Pattern:
DT - Double Top | BEARISH | RED
DB - Double Bottom | BULLISH | GREEN
HNS - Head & Shoulder | BEARISH | RED
REC - Rectangle | BLUE
iHNS - inverse head & Shoulder | BULLISH | GREEN
Verify it first and believe later.
WavePoint ❤️

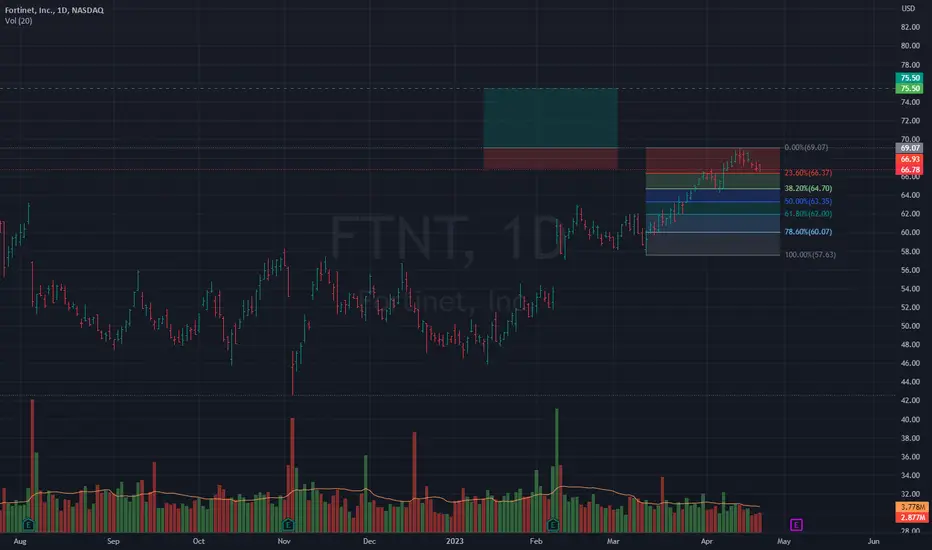
FORTINET Stock Chart Fibonacci Analysis 050423Trading Idea
1) Find a FIBO slingshot
2) Check FIBO 61.80% level
3) Entry Point > 62/61.80%

FTNT - Entry, Volume, Target, StopEnter when price clears 69.07
With daily volume greater than 4M
Target: 75.50 area
Depending on your risk tolerance: 66.93 gets you 3/1 Risk/Reward
FTNT - Breakout Ceiling Falling Trend- FTNT has broken through the ceiling of a falling trend channel in the medium long term.
- The stock has met the objective at 57 after a break of the double bottom formation.
- The price has now fallen, but the formation indicates further rise.
- The stock has support at 63 and resistance at 71.
- The RSI curve shows a rising trend, which could be an early signal of the start of a rising trend for the price as well.
- Overall assessed as technically positive for the medium long term.
*EP: Enter Price, SL: Support, TP: Take Profit, CL: Cut Loss, TF: Time Frame, RST: Resistance, RTS: Resistance to be Support LT TP: Long Term Target Price
Verify it first and believe later.
WavePoint ❤️

Buy FORTINET - high momentumStrong momentum on cybersecurity
CAGR 20% over the next 3 years on the top line
CAGR 25% over the next 3 years for the bottom line

Long FTNTFortinet's GAAP profit margins are higher than peers.
Margins remain in line with the prior year.
Fortinet reported a good quarter that saw revenue grow 29% and operating margin around 25%.

FTNT // cup handle formationAlthough there is a cup-handle formation in the graphic, the targets are determined according to Fibonacci. Let's look for at least two closures above 53.90.

short FTNTunder most MAs testing 50
big high vol reversal 6 days ago, followed by a mild bounce and faded.
bad earning drop with no reason bounce with market.
RISK:
CRWD earning today, risky

$FTNT with a Bearish outlook following its earnings #Stocks The PEAD projected a Bearish outlook for $FTNT after a Negative Under reaction following its earnings release placing the stock in drift D with an expected accuracy of 80%.

Buy off the blue line?100 SMA holding up nicely on the weekly for FTNT .
This is a big distribution pattern. It will take a while to break out , but overall trend is bullish

Bullish SharkPrice appears to have landed at the 1.113 of OX.
Possible stop under C, or the 1.113.
No recommendation.
ZS had a beat so Cybersecurity is booming today.
No recommendation
Stop below 47.30

FTNT Rolling LowerFortinet is a big player in cybersecurity with strong revenue growth and rapidly growing demand for its services. In the very Long-term, Fortinet should do well.
However, FTNT's technicals are signaling weakness on a more medium-term basis. The last year of FTNT price action has led to a rounded top formation. One could also argue that Fortinet shows signs of a head and shoulders pattern during the aforementioned period. Fortinet as of the past 7 months is now trading in a downward channel. The recent low recorded last week of 47.5 helps to confirm the continuation of bearishness in future trading. MACD on monthly/weekly/daily all are signaling further pain. The Weekly MACD is especially bearish, currently residing at its most negative level in FTNT's history.
Global market conditions are poor, and seemingly getting worse. Unfortunately, history has taught us that during periods of slowed economic activity amid monetary tightening great companies often sell off alongside their less successful peers (although not to the same degree).
To conclude: FTNT is experiencing a troubling technical outlook combined with a slowing economy/beaten-down consumer, I do not believe FTNT will be able to stay at such a high valuation with a p/e of 60, despite continued high demand. In the near term, I am looking for a move to 44.3 where the 50% fib retracement level sits. Looking further out, I expect a move down to the 30.2-27.1 range which has been an area of previous strong support as well as a 78.6% fib level. From there a rebound or consolidation period for Fortinet is likely.
As always this is not financial advice. Good luck!

Fortinet $FTNT BIG SHORT 2 This stock is played by investment bankers and trading bots! Their future outlook is based on infinite growth, but the truth is this is an extremely overpriced company and the future equity market condition isn't optimistic.
Stay away from investing in this company!
This is my personal view and not a financial advice!
NASDAQ:FTNT
NASDAQ:NDX
TVC:SPX
NASDAQ:TSLA

RectangleEarnings beat but appears folks were not happy with guidance.
Other Cyber Security stocks are also suffering today.
Horizontal/consolidation channel that is neutral until a trendline is broken. FTNT has not broken the bottom trendline today.
No recommendation.
