FCX SHOULDER HEAD SHOULDERLas tendencias que se muestran se ven con bandas de Bollinger, donde se puede notar en las bandas mas angostas se notan fuertes tendencias y los promedios moviles de 9 y 20 dias, se puede ver en los cruces de estas líneas que van hacia arriva los precios suben y puede ir a un largo (compra del activo) y a la inversa, cuando las lineas promedio moviles que se cruzan van hacia abajo los precios bajan y se puede ir a un corto (venta del activo). El patron que se muestra es de hombro cabeza hombro, cuando la tendencia llega al cuello tiende nir a la baja donde se puede ir a nun corto.
FPMB trade ideas

FCX SHOULDER HEAD SHOULTERWHEN THE TREND OF PRICES BOUNCES OFF THE NECK LINE RESISTANCE OR LINE WITH PRICE 14.04 ENTER WITH A SALE (SHORT)

Bought FCXIt held up nicely consolidating its rally in 2016. As a result there is an Inverse H&S that could power another rally if commodities recover.
Yesterday it broke out of the smaller daily consolidation and today it looks strong as well.
Took a long position today ~$12.60


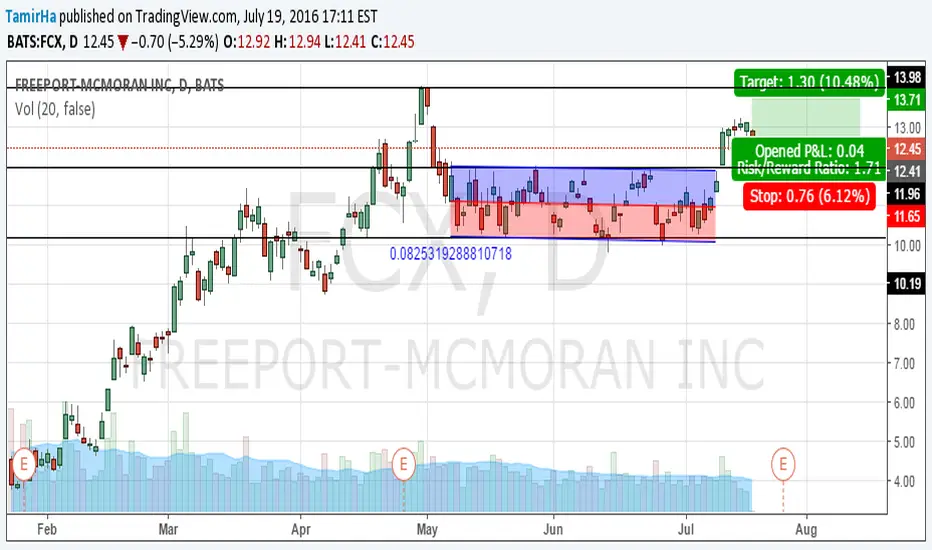
FCX ChannelThis stock is a great channel to trade at buy support sell resistance for quick pops, when it breaks out can go long on stock or options but right now trade the range for a channel. Use stock or options and stop under the support


Top of a sidewards ChannelSeems like selling at the top of the sidewards channel is a great idea.
Take profit is the bottom of the channel. Risk Reward is 2.05
Stop Loss : 12.06
Take Profit: 10.34
Have a nice day.


(D) Treading range (10,P pivot). Chop till ema50 is less flat.Divergence from minor bullish channel. Follow your rules.

Freeport: Inverse H&S?The shortterm trend is bullish, the midtermtrend bearish.
Should the stock be able to rise again to the former top at 14.15$ - a H&S would appear. The Minimum of this pattern would be 20.9$, the Maximum 23.8$.
This pattern only is active with Prices > neckline @ 14.15$.
Prices below 9.8 will generate a shortterm selling Signal with TP 8.75$/ 7.5$.
Below that Level, a midterm selling Signal would appear with TP = 3,40!!! ( ok ok.. ;-) - it`s a pure technical view!)
The Zone between 9.8-12 seems to be neutral -here is no action needed.
Good luck


Awaiting FCX's flag resolutionAfter upper trend the trendline is violated and we can see a flag which'd probably give us a good chance to go short, othervise, it'd give a nice opportunity for long.
So,
PLAN A : Bearish breakout. We wait untill the flags bottom line would be violated and then go short.
PLAN B : Bullish breakout. The same as above but vise versa.

FCX - Different perspectiveAs you can see , we need more price action to show us more clean direction.

(D) First potential major bottom. Support near 10 and S2 pivotSolid volume and OBV this year. May continue in its bullish channel with resistance near 15.
Obey your rules

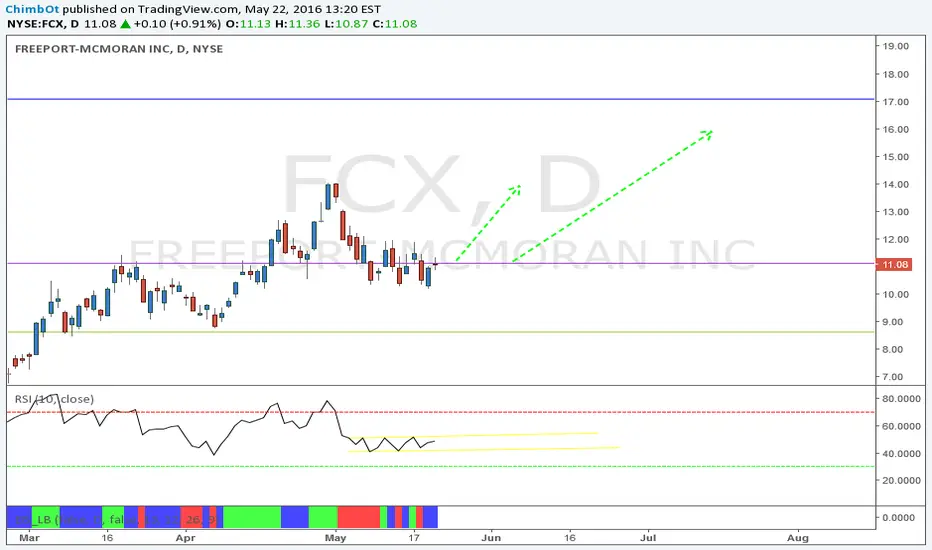
FCX Possibility of going UPWe have 2 options for this instrument:
1st: we can buy now.
2nd: we can wait until the flag will be realized.
We choose 1st option and start buying now.

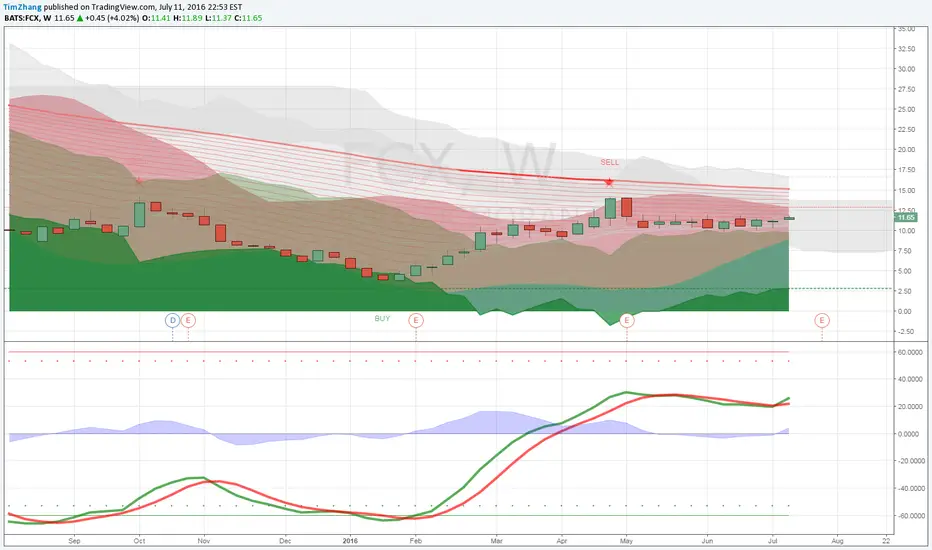
Recap my bullish view on FCX, mid-long term longRecap my bullish view on FCX, mid-long term long.
This is one of my favorite US stocks in my list for this year.