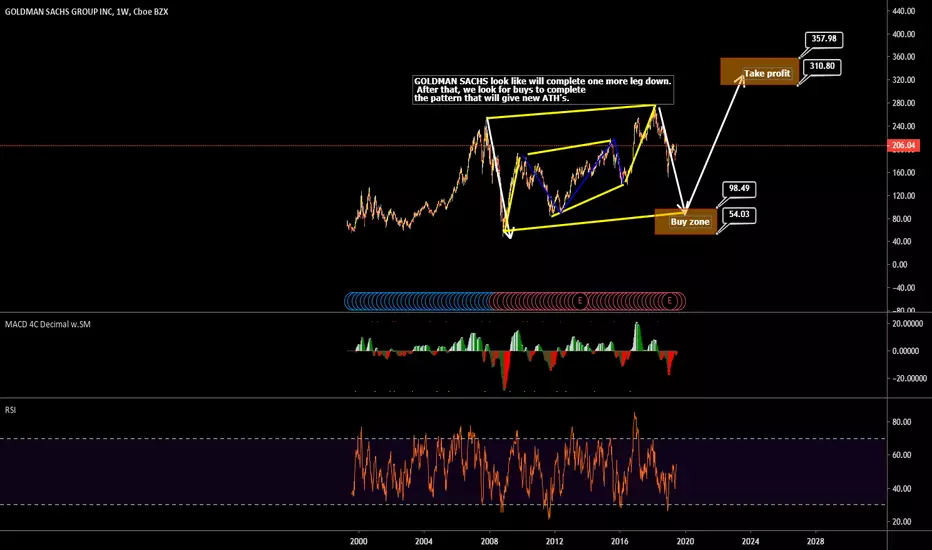
Goldman Sachs weekly pattern formation!GOLDMAN SACHS look like will complete one more leg down.
After that, we look for buys to complete
the pattern that will give new ATH's.
Trade ideas
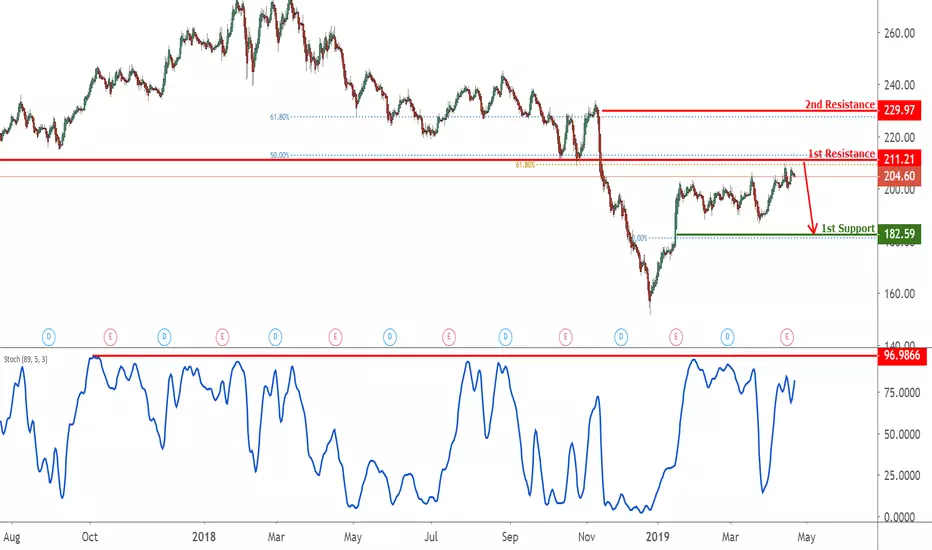
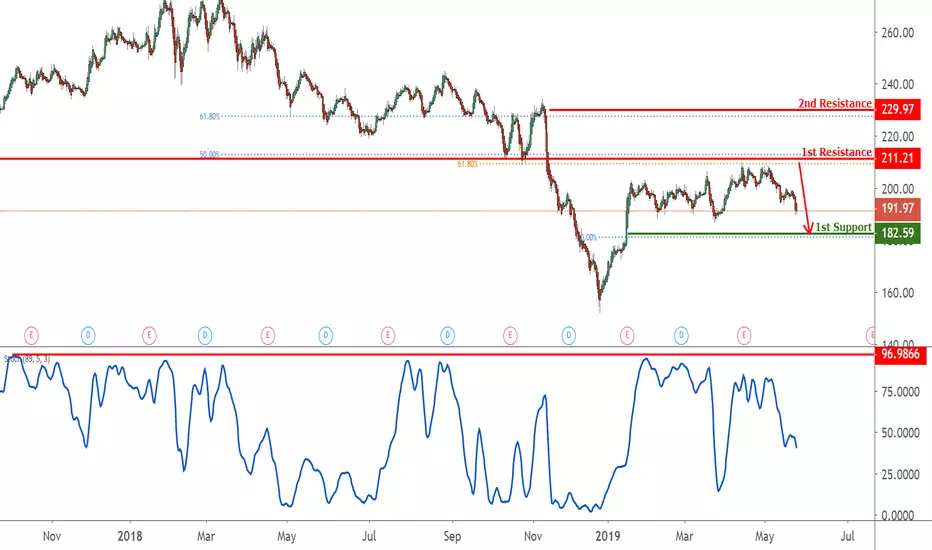
Goldman Sachs Group INC (GS) approaching resistance, look out f
GS is approaching its resistance at 211.72 where it is could reverse down to its support at 183.19.
Trading CFDs on margin carries high risk.
Losses can exceed the initial investment so please ensure you fully
understand the risks.
Which traditional finance group is integrating blockchain best? Which traditional finance group is integrating blockchain best?
GS owns Poloniex exchange.
JPM is developing a stable coin pegged to the US dollar.
Goldman's first mover effect appears to be eroding.

Goldman is a screaming buy, bullish technicals and fundamentalsThe stock of Goldman looks primed to jump higher very quickly after it has gapped up today and out of a very congested zone. Fundamentally everything seems to be turning a corner also, scandals are not the topic of the day, but buybacks, dividends, blockchain and digital assets are what is propelling the sentiment and price higher.

Short $GS Goldman has been trying to work out of the funk that it landed in during the January selloff. It saw a nice earnings pop. Each number on the chart corresponds with a number here
1. First attempt to breakout into new highs and hold price above the 200 day MA
2. After another month or so of consolidation there is another, stronger, push to break to 200 day MA. Also unsuccessful.
3. Price then breaks the 50 day MA and then retest. If there was any buyers left waiting to push above the 200 day then the 50 day should've been easy to break.
4. New lows to fill the gap from the earnings gap in Jan
5. Right now we are attempting to test the 50 day again, and its not looking good. The last 6 days have all tested the 50 day with today, I believe, being the last attempt. Price was rejected and there is a pretty substantial wick to the downside.
I'll go short tomorrow morning with a stop above the 50 day MA and I'll turn my position full size once the price drops below the lowest point of today's candle.

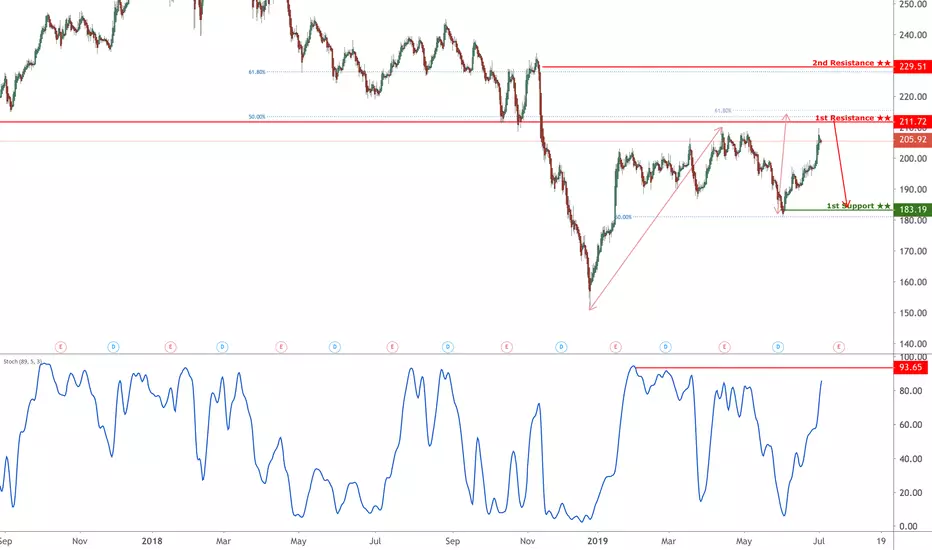
Goldman Sachs Group Inc potential reversal!Goldman Sachs Group Inc expected to rise up to 1st resistance at 211.72 where it could potentially react off and drop down to 1st support at 183.19.
Trading CFDs on margin carries high risk.
Losses can exceed the initial investment so please ensure you fully
understand the risks.

Goldman Sachs Rising Wedge Pattern Below The Resistance LevelAs we can see on the Daily chart the price keep moving to the downside we have a double top with a break confirmation causes a huge drop into 155.0, huge continuation to the upside into the previous low the price touched and reject each times to turns the previous support into a new resistance level with crossing the 200 MA then the price drop again and reject from the 0.50 fib level the price could push higher again into the resistance before drop again as a sign to short we are waiting a breakout confirmation of the lower low of the rising wedge patter

3rd fail here at 50/1003rd time failing at 50/100 here after failing at 200 in april/may, i'm short with tight stop on daily close above the 50

Goldman Sachs moving in the bearish directionAfter a rather sharp and long bearish move, which we said it is going to happen in our previous Goldman Sachs analysis, we can see that the price is forming a small bullish corrective wave, as the price got oversold after the latest bearish leg. Waiting for the price to make a breakout below the indicated yellow line, then expecting a move to the blue support/resistance area. Another bullish bounce will probably form there and then the price should go lower.
Feel free to grab a copy of our Free Weekly Market Outlook here:
mailchi.mp
For more content follow us on Instagram and Facebook:
www.instagram.com
www.facebook.com
We wish you good luck with your trading!

GS Reversed Off Resistance, Potential Drop!GS reversed off its resistance where we could see a further drop to its support.
Goldman Sachs and B&B hotels mergeGoldman Sachs, one of the largest investment banks in the market, this Monday announced the ongoing negotiations for the purchase of B & B Hotels from a private investment company PAI Partners. According to the previous Financial Times report, the hotel chain is estimated at 1.9 billion euros, which is equivalent to 2.1 billion dollars.
False Breakout, breakdownGS lost horiz support after false breakout from downtrend, 188 should come fast, when/if that breaks , new lows coming.

Goldman Sachs - Will follow the JPM path? - 01Goldman Sachs - Will follow the JPM path?
Comparison between GS and JPM

GS Approaching Resistance, Potential Reversal! GS is approaching its resistance where a reversal could occur.


$GS Goldman will reward the bulls. We are looking for a break of resistance in GS at $209 for a quick jump to $219, price action is limited in this zone given the speed in which the stock dropped. We hope for a speedy move up to the golden pocket at approx $228. If and when the wheels fall of tech , financials is where the wise money will continue to hide out. We are bullish financials.

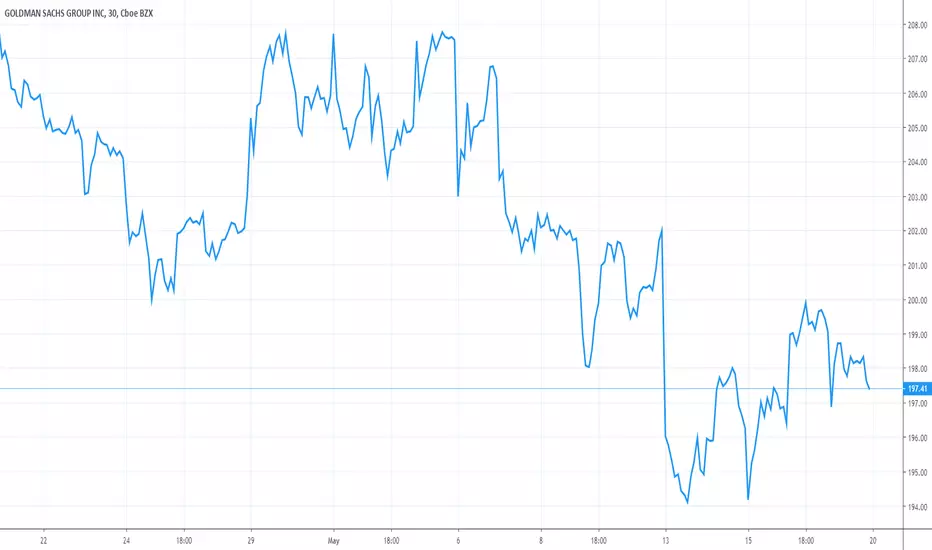
$GS looks temping herePrice bounced nicely off of the 50 day moving average on the daily chart and is shaping up nicely here on the hourly chart.

GS Reversed Off Resistance, Potential Drop!GS reversed off its resistance where we could see a further drop to its support.

GS going for a bearish or bullish move?The stock has made a rather large bearish move, that has closed beneath the support/resistance line. It has reversed and made a smaller bullish move and is now at the previously mentioned support/resistance line. We are expecting the price to bounce of this line and make another bearish move. If we see a breakout to the bullish side, we are waiting for the confirmation of the bullish move, and the entering a long position.
On the four hour chart we can see, that the price has recently broken the support/resistance line, that could indicate a smaller bullish move if we see a confirmation of the breakout.
Feel free to pick up a copy of our Free Weekly Market Outlook here:
mailchi.mp
We wish you good luck with your trading!

Goldman Sachs (GS) Cleared a LevelTheory is that each box jump/drop requires the same amount of time, and thus GS looks poised to spend some time bouncing between 205 and 220. Idea negated if 205 zone is lost.
Target: 220

GS Reversed Off Resistance, Potential Drop!GS reversed off its resistance where we could see a further drop to its support.