C98 Probable SenarioC98 in USDT pair may follow the path and break out of descending channel after bouncing off the mid-line of the channel and all time low support zone.
Trade Safe ...
Trade ideas

SPOT BREAKOUT ALERT - C98🚨 SPOT BREAKOUT ALERT - #C98🚨
✅77 days triangle breakout and retest
✅Ichimoku daily breakout & confirmation retest
Charts looks set for a 30%+ bull wave 🚀
Weekly candle close above 0.05800$ , would be very promising!

C98USDT 1D#C98 has broken above the bullish pennant on the daily chart. In case of a successful retest of the pattern and the daily EMA100, the potential targets are:
🎯 $0.0599
🎯 $0.0634
🎯 $0.0685
🎯 $0.0749
⚠️ Always remember to use a tight stop-loss and follow proper risk management.

#C98/USDT — Descending Wedge & High R/R Zone#C98
The price is moving within a descending channel on the 1-hour frame, adhering well to it, and is heading for a strong breakout and retest.
We have a bearish trend on the RSI indicator that is about to be broken and retested, which supports the upward breakout.
There is a major support area in green at 0.0474, representing a strong support point.
We are heading for consolidation above the 100 moving average.
Entry price: 0.0493
First target: 0.0510
Second target: 0.0527
Third target: 0.0549
Don't forget a simple matter: capital management.
When you reach the first target, save some money and then change your stop-loss order to an entry order.
For inquiries, please leave a comment.
Thank you.

C98/USDT - Reversal trend Over the past 200 days, C98/USDT has been engaged in a prolonged liquidity sweep followed by consolidation within a defined range. This extended accumulation phase often signals that the market is preparing for a major trend reversal after a lengthy downtrend.
The structure suggests that sellers are exhausted while buyers are gradually absorbing supply, setting the stage for the end of the long-term bearish cycle.
This presents an attractive opportunity to DCA within the current range, positioning early ahead of a potential trend shift and breakout toward higher levels.

C98 ANALYSIS🔮#C98 Analysis 💰💰
#C98 is trading in a symmetrical triangle in a weekly time frame and if it breakouts with high volume then we can see a bullish momentum in #C98. Before that we will see little bit bearish movement towards its support zone and that a bullish movement.
🔖 Current Price: $0.0498
⏳ Target Price: $0.0634
⁉️ What to do?
- We can trade according to the chart and make some profits in #C98. Keep your eyes on the chart, observe trading volume and stay accustom to market moves.💲💲
#C98 #Cryptocurrency #Pump #DYOR

#C98/USDT#C98
The price is moving within a descending channel on the 1-hour frame and is expected to break and continue upward.
We have a trend to stabilize above the 100 moving average once again.
We have a downtrend on the RSI indicator that supports the upward break.
We have a support area at the lower boundary of the channel at 0.0394, acting as strong support from which the price can rebound.
We have a major support area in green that pushed the price upward at 0.0371.
Entry price: 0.0435
First target: 0.0459
Second target: 0.0496
Third target: 0.0542
To manage risk, don't forget stop loss and capital management.
When you reach the first target, save some profits and then change the stop order to an entry order.
For inquiries, please comment.
Thank you.

C98USDT UPDATE#C98
UPDATE
C98 Technical Setup
Pattern: Bullish Falling Wedge Pattern
Current Price: $0.167
Target Price: $0.268
Target % Gain: 60.79%
$C98 is breaking out of a falling wedge pattern on the 1D timeframe. The breakout confirms bullish momentum with structure favoring continuation toward $0.268, offering nearly 61% potential upside. Always use proper risk management.
Time Frame: 1D
Risk Management Tip: Always use proper risk management.

RR=2 buy ideaBullish bat pattern + inverted head and shoulders + RSI Divergence on multiple swing low :
expecting price to start an upward movement
PS : never risk more than 2% of your capital per trade

C98USDT – Potential Impulse Wave 3 in Progress? | Elliott WaveHello traders! 🚀
Sharing a fresh Elliott Wave setup I'm currently monitoring on C98USDT (4H TF). The price structure is unfolding clearly and may be in the early phase of a classic 5-wave impulse.
After an impulsive move up completing Wave (1), the market corrected in a textbook ABC pattern down into a key demand zone, finishing Wave (2). We’re now seeing strong bullish momentum suggesting the beginning of Wave (3) – the longest and most aggressive wave in Elliott theory. ⚡
Trade Setup:
🟢 Entry Zone: 0.043 – 0.046
🔴 Stop Loss: 0.03913
🎯 Target Price: 0.05955
💡 Note: Always manage your risk and confirm with your own analysis before entering any trade.
Let me know your thoughts and wave count below! 👇
Happy trading! 🚀

$C98USDT Breakout Setup – 225% PotentialC98USDT is holding the bottom of a long-term falling wedge on the weekly chart, a key support zone.
A bounce from here could push the price up by over 225% toward the upper resistance trendline, located around $0.1175.
Strong setup, but wait for confirmation.
DYRO, NFA

C98 Hits Bottom, More Than 3,333% Growth PotentialHere C98 breaks the pattern, a channel breakdown after going sideways for years. This is the liquidity hunt event. Two signals reveal that this drop is the bottom and precedes a change of trend.
1) The highest volume ever and since 2021 came in March as C98USDT looked for a new low.
2) We have a double-bottom.
The bullish action will start without warning, Boom!, 100-200% up. Then it will continue with full force, month after month after month of a rising market, see the green arrow. We are now very close.
That's all there is. Once you hit bottom, there is no other place left to go but up. Nothing, nada, nichts, niente, rien. Only up is possible now and that's where we are headed next.
Buy and hold. Growth potential goes between 2,500% and 3,900%.
Namaste.

C98 ANALYSIS FOR Q3 2025🧠 $C98 is grinding against a 15-month down-trend at $0.055, sitting on a 0.048-0.055 demand that’s defended 7× since ʼ23. CMF + falling-wedge basing = compressed spring. 📉→📈
2025 catalyst stack:
• AI Wallet v15 w/ Cypheus assistant 👾
• PowerPool Staking V2 + airdrops
• SwapX cross-chain swap (Solana, TON, Base, Sui, Viction)
• Telegram one-tap Web3 wallet rollout
• DeFusion launchpad traffic & fee burn
• 10 M users across 130+ chains already 🚀
• 98 % supply unlocked – near-zero vesting overhang
🎯 Targets 0.16 / 0.20
⛔ Invalidation: daily close < 0.048
⚖️ Risk ≤ 2 %. NFA.

C98USDT 1D AnalysisC98 ~ 1D Analysis
#C98 Buy gradually from here if you still have confidence in this coin with a short term target of at least 15%+ from here.

RR=3 buy ideaBullish cypher pattern + price bounced on support level + Bullish RSI divergence + breakout of double bottom's neckline
PS never risk more than 2% of your capital per trade

C98 Buy Setup (1D)Based on the 3D pattern formed at the bottom and the breakout of the trigger line, it seems that the origin zones of the move may contain enough orders to trigger a trend reversal for C98.
A double bottom is expected to form, and the price may attempt to attack the marked supply zone.
The support zone and supply area are marked on the chart.
A daily candle closing below the invalidation level will invalidate this analysis.
For risk management, please don't forget stop loss and capital management
When we reach the first target, save some profit and then change the stop to entry
Comment if you have any questions
Thank You

C98/USDT 15M ANALYSISHey Traders! 👋
I'm tracking a potential impulsive Elliott Wave structure on C98/USDT.
📈 Wave Count So Far:
- We completed a clean 5-wave impulsive move up — labeled i through v.
- This was followed by a classic zigzag (ABC) correction, forming what looks like a textbook
Wave 2.
- The corrective structure appears complete, and price is now holding above key support.
🔍 Current Expectation:
I'm now looking for Wave 3 to unfold, which typically brings the strongest momentum in the Elliott Wave sequence.
Trade Setup:
🟢 Entry Zone: 0.06 – 0.0615
🔴 Stop Loss: 0.05923
🎯 Target Price: 0.0652
💡 Note: Always manage your risk and confirm with your own analysis before entering any trade.

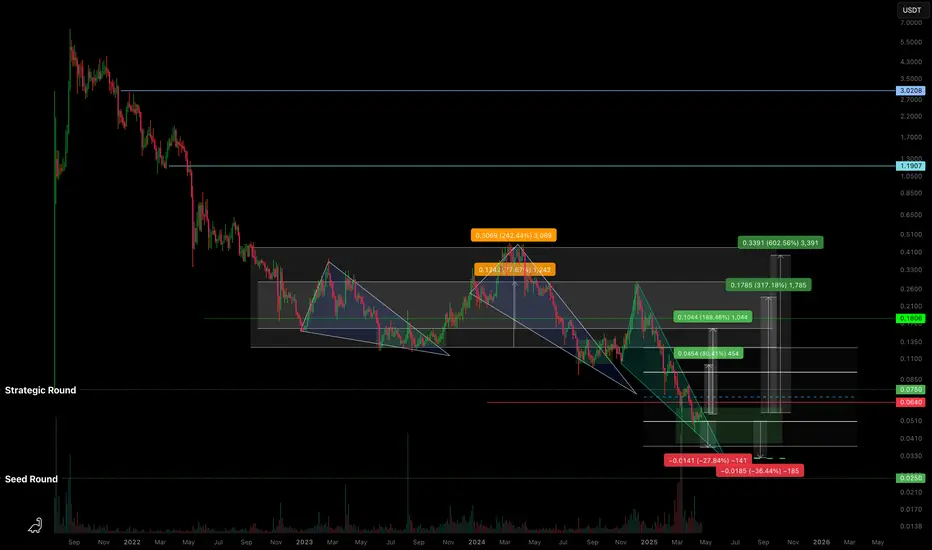
C98USDT — Descending Wedge & High R/R ZoneBased on the current structure, BINANCE:C98USDT is moving within a descending wedge , approaching zones that align with early investor positions.
🔍 What I’m seeing:
Potential drop into the range of a previous horizontal channel - marked on the chart.
We've already reached the Strategic Round level; below that is the Seed Round .
Assuming the project isn’t abandoned, it makes sense to expect investor defense in this zone.
From what I observe, there's likely accumulation happening from weak hands - at a discount .
🛡️ Approach:
As I’ve said before - you can’t treat coins like this in isolation .
They should be traded as part of a group of low-liquidity tokens , with proper risk management .
You can’t know in advance which one will “survive” without insider info from the team.
So the key is having a solid strategy and managing your portfolio and risk wisely .
📈 Targets:
Potential breakout targets from the wedge are marked on the chart.
If the market remains weak, I’ve noted a lower zone where consolidation might occur (sideways chop within a horizontal channel).
💭 Opinion:
The market is “paused” and waiting for a catalyst. You can’t rush it.
But zones like the current one on BINANCE:C98USDT seem attractive in terms of risk/reward .
The goal isn’t to guess - it’s to follow a pre-built strategy and stay focused .
📌 As always, this is not financial advice. Just my personal take and observations on the structure.
C98USDT 1DC98 ~ 1D Analysis
#C98 Buy after successfully penetrating this resistant line with a short -term target of at least 10%+.

C98 Targeting Higher Levels
Price found support with divergence in the bottom trendline of the green descending channel for green V.
The recovery effort found resistance at the green zone, which I´m considering to be wave a. Let´s see how the correction plays out (green b) for long trade opportunities.

C98USDT // reverse head and shoulders formationAlthough there is a reverse head and shoulders formation on the chart, the targets are drawn according to Fibonacci.

Long-Term Strategy for C98
1. Current Price Context
As of now, C98 is trading around $0.07.
The price has reached historical lows, touching around $0.057 recently, indicating we are near or within a long-term accumulation zone.
2. Multi-Timeframe Analysis
Monthly timeframe: C98 is still in a macro downtrend but seems to be stabilizing near its all-time lows. Watch for any sign of bottoming structure such as double bottom, or Wyckoff Accumulation phases (Spring, SOS).
Weekly timeframe: Price is trading below EMA 200W and EMA 50W, so the asset is still under bearish pressure. However, RSI on the weekly is near or below 30, suggesting potential for bullish divergence.
Daily timeframe: Use this for refining entries. Look for short-term breakouts from falling wedge or descending channel patterns.
3. Support & Resistance Zones
Major support zone:
$0.05 - $0.06: This is a historically significant demand zone where price previously found buyers (recent low ~$0.057).
Resistance zones:
$0.10 - $0.12: Former support turned resistance and in confluence with prior swing highs.
Further resistance at $0.18 - $0.20, where EMA 200D could act as a dynamic resistance.
4. Recommended Strategy
Primary plan:
DCA (Dollar Cost Averaging): Gradually accumulate C98 in the $0.05 - $0.07 range. This is a high-probability accumulation area based on multi-timeframe supports.
Swing trades: If price breaks above $0.10 with strong volume, consider swing trades targeting $0.12 and $0.18 zones.
Indicators to watch:
RSI: Weekly RSI is near oversold levels (<30). Watch for bullish divergence on daily or weekly charts.
MACD: A bullish crossover on the daily or weekly MACD would be a strong confirmation for accumulation.
EMA 50/200D cross: A Golden Cross on the daily chart would be a medium-term bullish signal.
5. Capital Allocation
70% capital: Gradual accumulation at $0.05 - $0.07 for long-term holding.
30% capital: Reserved for breakout trades or additional DCA on deeper dips.
6. Risk Management
Stoploss: Set stoploss under $0.045, as a break below this level could signal further downside.
Take-Profit Levels:
First TP around $0.10 - $0.12
Second TP at $0.18 - $0.20
Higher targets depending on market cycle conditions.
7. Macro Environment Consideration
C98 is highly correlated with Bitcoin and overall crypto sentiment. Larger positions should be taken when Bitcoin confirms a bullish trend (e.g., above its 200-week MA).

C98USDT 1WC98 ~ 1W Analysis
#C98 This is the lowest support block for now. Buy from here if you still have a Conviction on this coin.
