CAD/CHF BEARS WILL DOMINATE THE MARKET|SHORT
Hello, Friends!
CAD/CHF pair is trading in a local uptrend which we know by looking at the previous 1W candle which is green. On the 1D timeframe the pair is going up too. The pair is overbought because the price is close to the upper band of the BB indicator. So we are looking to sell the pair with the upper BB line acting as resistance. The next target is 0.561 area.
Disclosure: I am part of Trade Nation's Influencer program and receive a monthly fee for using their TradingView charts in my analysis.
✅LIKE AND COMMENT MY IDEAS✅
Trade ideas

CADCHFLow probability Idea but worth taking the shot. Manage risk if interested
Trading is making me run crazy; lol


CADCHF Signals a Downward Correction To 0.5670CADCHF Signals a Downward Correction To 0.5670
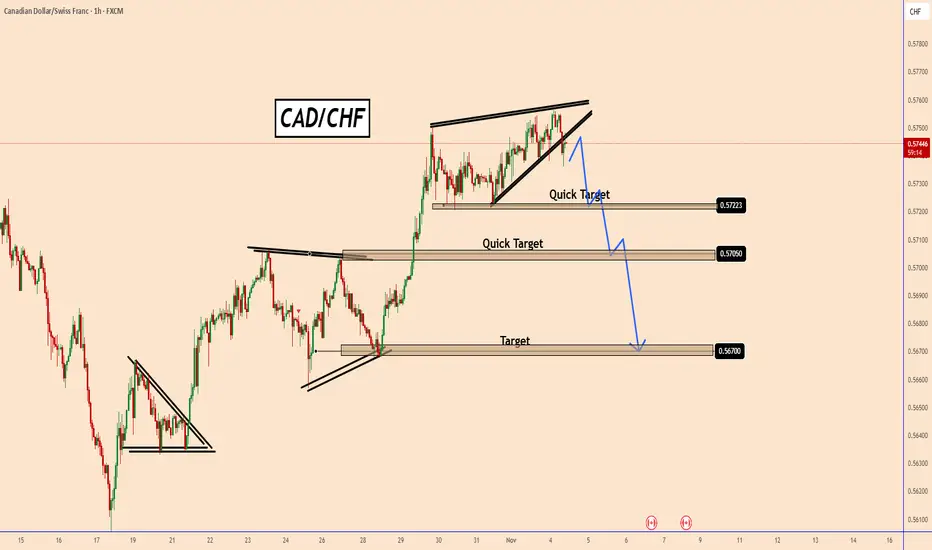
CADCHF is trading within a rising wedge formation on the 1H chart — typically a bearish continuation pattern.
Price is showing early signs of exhaustion near the top, suggesting a possible pullback.
The price already broke down from the bearish pattern, indicating an increase in the bearish momentum.
Quick targets are seen at 0.5722 and 0.5705, with a deeper extension toward 0.5670 if bearish momentum continues.
You may find more details in the chart!
Thank you and Good Luck!
❤️PS: Please support with a like or comment if you find this analysis useful for your trading day❤️
Why I like CADCHF for a BUYING OPPORTUNITY?!?!All the information you need to find a high probability trade are in front of you on the charts so build your trading decisions on 'the facts' of the chart NOT what you think or what you want to happen or even what you heard will happen. If you have enough facts telling you to trade in a certain direction and therefore enough confluence to take a trade, then this is how you will gain consistency in you trading and build confidence. Check out my trade idea!!
www.tradingview.com

Bearish drop off?CAD/CHF has rejected off the pivot which is a pullback resistance and could drop to the 1st support which is an overlap support that aligns with the 38.2% Fibonacci retracement.
Pivot: 0.57489
1st Support: 0.56994
1st Resistance: 0.58011
Disclaimer:
The above opinions given constitute general market commentary, and do not constitute the opinion or advice of IC Markets or any form of personal or investment advice.
Any opinions, news, research, analyses, prices, other information, or links to third-party sites contained on this website are provided on an "as-is" basis, are intended only to be informative, is not an advice nor a recommendation, nor research, or a record of our trading prices, or an offer of, or solicitation for a transaction in any financial instrument and thus should not be treated as such. The information provided does not involve any specific investment objectives, financial situation and needs of any specific person who may receive it. Please be aware, that past performance is not a reliable indicator of future performance and/or results. Past Performance or Forward-looking scenarios based upon the reasonable beliefs of the third-party provider are not a guarantee of future performance. Actual results may differ materially from those anticipated in forward-looking or past performance statements. IC Markets makes no representation or warranty and assumes no liability as to the accuracy or completeness of the information provided, nor any loss arising from any investment based on a recommendation, forecast or any information supplied by any third-party.

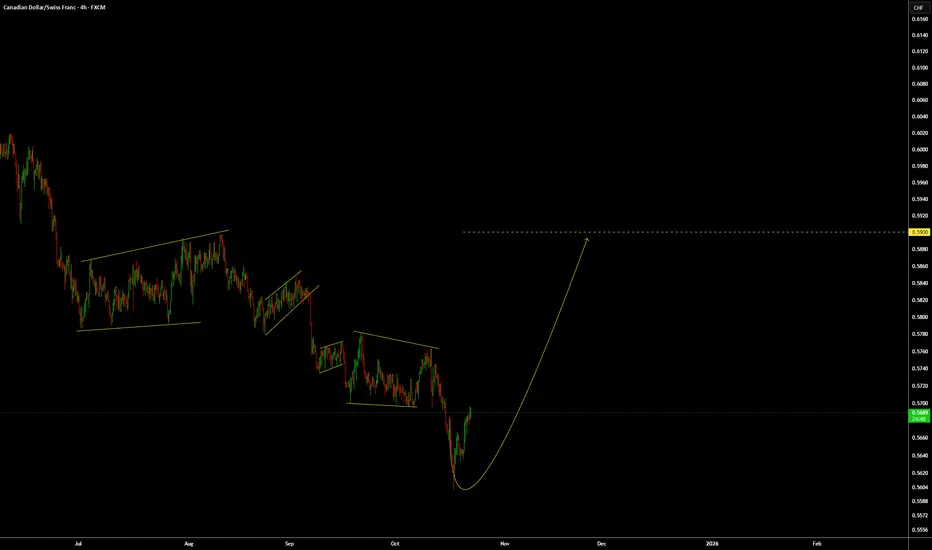
CADCHF: Looking for this wave up.FX:CADCHF is at a low and we are good to go to the upside for at least 200 to 300 pips.
If you get a buy setup or you have a strategy to go for the buy, try to not miss it.
WTW 4 Golder Rules:
1) Do not jump in
2) Do not over risk/trade
3) Do not trade without Stop Loss
4) Never ever add to a losing position!
Trade with care
We Trade Waves
WTW Team
Disclosure: We are part of Trade Nation's Influencer program and receive a monthly fee for using their TradingView charts in our analysis.
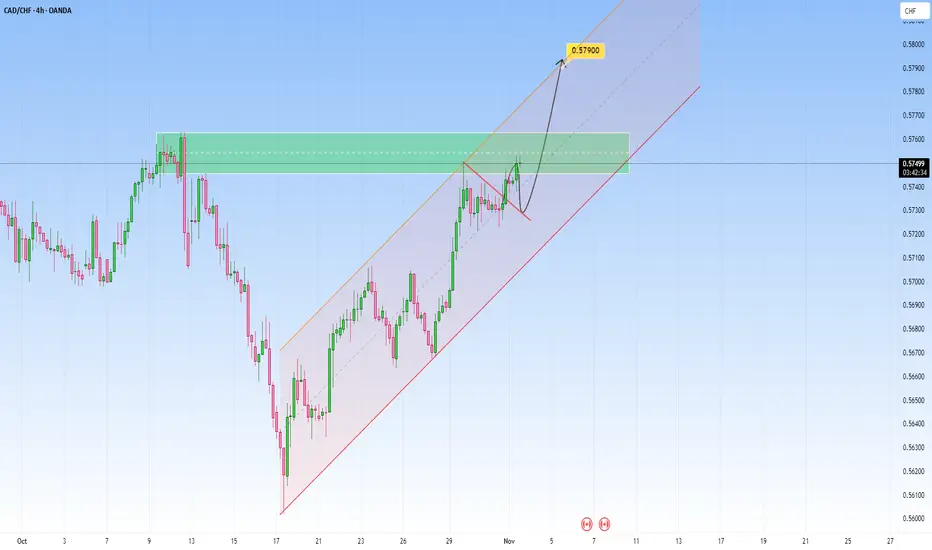
CADCHF Channel Rise in Motion: Buyers Target 0.5790CadChf price has been moving cleanly inside this rising channel, showing strong bullish structure with consistent higher highs and higher lows.
Buyers are now testing the resistance zone and momentum remains in their favor.
I expect a continuation toward 0.57900, the next projected level near the top of the channel.
As long as the structure holds above the midline of the channel, buyers remain in control, driving the next leg of the uptrend.
CADCHF STRONG REJECTION|LONG|
✅CADCHF swept liquidity beneath the previous swing low and is now reacting from a clean demand block, hinting at a possible short-term reversal toward internal range liquidity. Time Frame 3H.
LONG🚀
✅Like and subscribe to never miss a new idea!✅

CAD-CHF Short From Supply Area! Sell!
Hello,Traders!
CADCHF is reacting from a premium supply zone where liquidity was previously engineered. Expect a short-term drop toward the next demand imbalance as smart money rebalances the range.Time Frame 5H.
Sell!
Comment and subscribe to help us grow!
Check out other forecasts below too!
Disclosure: I am part of Trade Nation's Influencer program and receive a monthly fee for using their TradingView charts in my analysis.

CAD-CHF Bearish Breakout! Sell!
Hello,Traders!
CADCHF broke structure below the supply zone, confirming bearish order flow. Price is likely to retrace toward premium before extending into lower liquidity pools. Time Frame 4H.
Sell!
Comment and subscribe to help us grow!
Check out other forecasts below too!
Disclosure: I am part of Trade Nation's Influencer program and receive a monthly fee for using their TradingView charts in my analysis.

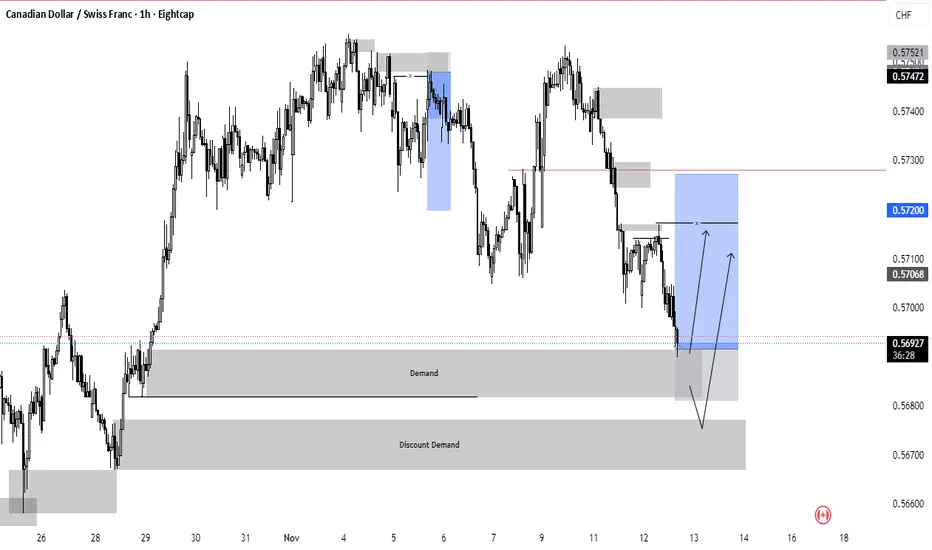
CADCHF LONG SETUPI am looking on going long on CADCHF from this level of support to the next creation on HH

CADCHF SCALPI'll be taking this buy scalp at this Demand area. If it fails then I'll take the 2nd Demand.
This is a very low probability trade cause there is no visible liquidity swept before mitigation and no engineered liquidity to capitalize off of.
Manage risk if interested pls!
#040: Short Investment Opportunity on CAD/CHF
In recent days, the Canadian dollar-Swiss franc cross has entered a market configuration closely resembling typical institutional distribution phases.
After weeks of moderate gains, supported by a temporary risk-on sentiment and a moderate recovery in the CAD linked to stable oil prices, the technical structure is now beginning to show signs of losing momentum.
The latest medium-high timeframe candlesticks reveal a progressive compression of the highs, accompanied by volatility that remains contained but with a declining volume delta.
This type of behavior, in intermarket readings, suggests that large operators are reducing long positions rather than accumulating new ones.
At the same time, the Swiss franc is gradually benefiting from a renewed search for protection:
rising global uncertainty and declining real yields are pushing many desks to reactivate the franc as a tactical safe haven.
This isn't yet an impulsive move, but a shift in sentiment that's beginning to be reflected in several crosses tied to the Swiss currency.
On the Canadian front, the macro outlook remains mixed:
The Bank of Canada maintains a cautious stance, openly declaring that monetary policy will remain restrictive "for an extended period," but the historical correlation between the CAD and the commodity cycle continues to make the currency vulnerable to a weakening crude oil price.
In this context, profit-taking at highs becomes natural.
From a microstructural perspective, the current price range represents a fragile equilibrium point:
The presence of passive orders concentrated in a narrow area could amplify the movement if the market decisively breaches the lower distribution margin.
A strong catalyst isn't needed; a return of risk aversion or a repricing of global interest rates is enough to trigger a rotation toward the CHF.


CAD/CHF BEARISH BIAS RIGHT NOW| SHORT
CAD/CHF SIGNAL
Trade Direction: short
Entry Level: 0.573
Target Level: 0.568
Stop Loss: 0.576
RISK PROFILE
Risk level: medium
Suggested risk: 1%
Timeframe: 12h
Disclosure: I am part of Trade Nation's Influencer program and receive a monthly fee for using their TradingView charts in my analysis.
✅LIKE AND COMMENT MY IDEAS✅


CAD/CHF reached a key supply zoneHey traders!
New day — new setups ✨
CAD/CHF has reached a key supply zone around 0.5740–0.5750, where bullish momentum seems to be slowing down.
After this short upside move, price is showing early signs of weakness — suggesting a possible correction phase ahead.
If the structure confirms a reversal, we could see a gradual move toward the next demand areas.
🎯 Targets:
• 0.5700
• 0.5670
• 0.5640
❌ Invalidation: if price breaks and holds above 0.5775.
Trade with patience, stay disciplined — and let the profits follow 🔥💎


CAD/CHF BEARS ARE GAINING STRENGTH|SHORT
Hello, Friends!
Bearish trend on CAD/CHF, defined by the red colour of the last week candle combined with the fact the pair is overbought based on the BB upper band proximity, makes me expect a bearish rebound from the resistance line above and a retest of the local target below at 0.566.
Disclosure: I am part of Trade Nation's Influencer program and receive a monthly fee for using their TradingView charts in my analysis.
✅LIKE AND COMMENT MY IDEAS✅

Update of CADCHF analysisWhat the chart is showing us is a rounding pattern, indicating that the uptrend is gradually weakening.
If the support breaks, after a pullback it will provide a good trigger for a short position.
Once the trade reaches TP1, we should definitely take partial profit and move to risk-free mode — that way we can comfortably keep the position open for lower targets while staying protected from a fake drop.

