EURCAD – Buyers Gaining ControlPrice has formed what looks like an inverse head and shoulders pattern after an extended bearish leg, a strong sign of potential reversal.
The left shoulder, head, and right shoulder structure all show selling pressure fading and buyers gradually stepping in.
We’ve now seen a clean breakout above the neckline, confirming the shift in momentum.
I’m watching for a short-term pullback toward the neckline for a possible retest before continuation.
As long as price holds above that level, the bullish bias remains intact.
Next upside target sits around 1.6318, aligning with the next resistance zone and measured move projection from the pattern.
Trade ideas

EUR/CAD: Bullish Outlook📈EURCAD formed a significant inverted head and shoulders pattern on a 4-hour timeframe.
The neckline for this pattern is identified between 1.6226 and 1.6210.
Should the price successfully break and close above this neckline, it would indicate a strong bullish signal.
In such a scenario, the market could potentially advance towards the 1.6560 level.
Please note that the neckline currently acts as a robust demand area. Shorting opportunities should only be considered after a confirmed breakout of this level.

EURCAD Reveals a Stunning Reversal You Can’t IgnoreHey everyone, Erik here.
EURCAD has been in a strong downtrend, though that bearish momentum is starting to lose its intensity. The market is now shaping what appears to be an inverse head and shoulders pattern, a classic sign that sellers may be running out of strength while buyers are beginning to show interest.
After the right shoulder formed, buyers made a confident move above the neckline, signaling a possible shift in market structure from bearish to bullish. At the moment, I’m watching for a short-term pullback toward the neckline area, a healthy retest that could confirm the strength of this move before any continuation higher.
As long as price holds above that level, the bullish scenario remains valid. The next upside target is around 1.63185, which aligns with the next resistance zone and the projected move derived from the pattern.
This setup is clean, logical, and full of potential. It illustrates how market momentum can shift naturally from exhaustion to recovery, hinting at the early stages of a possible trend reversal.

EURCAD - Buy the Bounce at Confluence!📈EURCAD remains in a steady rising channel on the daily. Price has pulled back into a strong support zone that perfectly aligns with the channel’s lower bound and the base of the recent micro wedge.
🏹As long as this confluence holds, I’ll be looking for trend-following longs from here, aiming first for the recent highs, then the channel top.
⚠️ Disclaimer: This is not financial advice. Always do your own research and manage risk properly.
📊All Strategies Are Good; If Managed Properly!
~Richard Nasr

Eurcad looking bullish here after fake out now formed heads and shoulders, currently trying to clear neckline area, after successful breakout it can rebound, and can give 150 to 180 pips bullish wave

06.11.25 Morning ForecastPairs on Watch -
FX:EURJPY
FX:EURCAD
A short overview of the instruments I am looking at for today, multi-timeframe analysis down to what I will be looking at for an entry. Enjoy!


EURCAD"EUR/CAD is moving in a downtrend. The price is below the 50 RSI zone and also below the 14-period RSI average, supporting the continuation of the bearish movement. However, a corrective move toward the FVG area is expected before the next drop."

EurCad Chart AnalysisAnalyzing the EUR/CAD chart, price action has reached a key support level and is currently consolidating within a narrow range, itself contained within a broader consolidation pattern. While the next directional move remains uncertain, my strategy is as follows:
Entry Plan:
Initiating a small long position at current levels
If price declines to the lower support zone, I'll scale into the position with additional size
Overall bias remains bullish, anticipating upward movement
Support Level Significance:
Support 1: Established since early September 2024
Support 2: Established since early March 2024
Given the length of time and the respect the price has for support levels, it would require significant selling pressure to breach both zones. This reinforces the long bias with a scaled entry approach.
*This is NOT financial advice
Is EUR/CAD Ready for Takeoff After the ATR Pullback?💶💰 EUR/CAD: The Pullback Heist Setup | Swing/Day Trade
🎯 THE SETUP
Pair: EUR/CAD (Euro vs Canadian Dollar)
Market: Forex | Timeframe: Flexible (Swing/Day Trade)
Bias: 📈 BULLISH — Confirmed via ATR Pullback Retest
📊 GAME PLAN
The setup identifies a bullish pullback retest structure with ATR (Average True Range) confirmation, creating a high-probability entry zone. This is your "heist opportunity" — multiple entry layers maximize your chances of catching the move.
🎬 ENTRY STRATEGY: LAYERED LIMIT ORDERS
Think of it like stacking chips at the table — multiple small bets beat one big bet:
🔴 Layer 1 at price level 1.61400 — First reconnaissance move to test the waters and gauge initial momentum.
🔴 Layer 2 at price level 1.61600 — Confirm momentum building as price holds and retests the zone.
🔴 Layer 3 at price level 1.61800 — Build your core position as conviction strengthens with each layer filled.
🔴 Layer 4 at price level 1.62000 — Final accumulation layer to complete your position size.
Note: Adjust layers based on your position sizing and risk tolerance. Start with what fits your account!
🛑 STOP LOSS PLACEMENT
Thief SL: 1.61000
⚠️ Risk Disclaimer: Stop loss is your safety net, not a guaranteed protection. Set it based on your personal risk management rules and account capital. Your risk, your rules!
🎁 PROFIT TARGETS
🟢 TARGET 1 (TP1) at 1.63200 — This is where the Hull MA acts as an overbought zone, signaling time to lock in 60% of your position. This is your first checkpoint to secure profits before things get spicy.
🟢 TARGET 2 (TP2) at 1.64500 — This level is the "Police Barricade" — a strong resistance cluster with overbought conditions brewing. This is where the TRAP zone activates. Don't get greedy here! Escape with your remaining 40% of profits and live to trade another day.
⚠️ Profit Target Note: These are suggested levels based on technical structure. Your take-profit strategy is YOUR decision. Trade responsibly!
🔗 CORRELATED PAIRS TO WATCH (Use as Confluence)
📍 USD Strength Indicators
💵 FX:EURUSD — Key Correlation: Inverse relationship. If EUR/USD rallies, EUR/CAD typically strengthens (bullish for setup). When the Euro pumps against the Dollar, CAD strength becomes less relevant, giving EUR/CAD room to fly.
🍁 OANDA:USDCAD — Key Correlation: Direct inverse. USD/CAD weakness = EUR/CAD strength. Monitor USD/CAD for divergence — if it's breaking down while our setup fires, that's GOLDEN confluence.
📍 Commodity Pairs (Loonie Movement)
🛢️ OANDA:USDCAD (Oil Sensitivity) — Canadian Dollar is heavily influenced by crude oil prices. Oil strength = CAD strength = potential headwind for EUR/CAD. Check oil charts before entering! Rising oil can kill your bullish trade.
🍁 OANDA:CADJPY — Reflects broader CAD sentiment across majors. Monitor for divergence signals. If CAD is rallying across the board, EUR/CAD might struggle against the Loonie.
📍 Technical Synergy
🔄 OANDA:EURGBP — Shows Euro strength relative to other majors. If EUR/GBP is bullish, EUR/CAD confluence improves significantly. This is your Euro strength confirmation.
📉 TVC:DXY (Dollar Index) — Broader USD weakness supports Euro strength. Watch for DXY breakdown below key support — when the Dollar bleeds, the Euro typically thrives.
Key Point: Use these pairs as confirmation tools, not entry signals. Multi-pair confluence = higher probability trades.
🔑 KEY TECHNICAL POINTS
✅ ATR Pullback Retest — Price returned to support + ATR shows volatility compression = reversal setup that signals buyers stepping in.
✅ Layered Entry Strategy — Reduces average entry price and eliminates emotional FOMO trading by spreading your risk intelligently.
✅ Multiple Profit Targets — Risk-to-reward ratio calculated at 1.63200 (TP1) and 1.64500 (TP2) with proper scaling strategy.
✅ Overbought Zone Identified — Hull MA and resistance cluster at 1.64500 = natural exit point before the reversal crushes your profits.
⚡ QUICK RULES FOR THIS HEIST
DON'T enter all layers at once — patience is the thief's best friend. Spread them out!
DO move stops to breakeven after first target hit — locks in your win and removes risk.
DO scale out at resistance levels (don't hold to the end) — never let profits become losses.
DON'T average down below the stop loss — that's how traders blow up accounts.
DO respect the "Police Barricade" resistance — it's there for a reason and will stop you out if you ignore it!
📌 TRADE MANAGEMENT CHECKLIST
Set limit orders at all 4 layers (1.61400, 1.61600, 1.61800, 1.62000)
Stop loss placed at 1.61000 with proper position sizing
First target exit ready at 1.63200 (60% of position)
Second target exit ready at 1.64500 (remaining 40%)
Risk-to-reward ratio calculated before entering
Trade size appropriate for account size and risk tolerance
💡 WHY THIS SETUP WORKS
The confluence of pullback retest + ATR confirmation + multi-level resistance creates a high-probability zone where smart money typically enters. By using layered entries, you're not betting the farm on one price level — you're working with market structure, not against it. This is how professionals trade without the emotional baggage. You're stacking the odds in your favor by letting price come to you through multiple layers.
✨ If you find value in my analysis, a 👍 and 🚀 boost is much appreciated — it helps me share more setups with the community!
#EUR/CAD #ForexTrading #SwingTrading #DayTrading #ThiefOG #TechnicalAnalysis #ATR #BullishSetup #TradingStrategy #ForexSignals #PullbackRetest #LayeredEntry #RiskManagement #TradingCommunity
Happy Trading, Thief OG Crew! 🎭💰

EURCAD Short term viewWe can see a clear break and retest from the 4H trendline. This is just an idea, let's see how it goes.


Top Markets For The Week 2/11-25 --> 7/11-25Weekly Bearish
Daily Bearish
4H Bearish
Price Has Broken and Retested a WEEKLY AOI twice and rejected.
What I'm expecting is for a small retracment or a new LH
to enter this position. CMCMARKETS:EURCAD

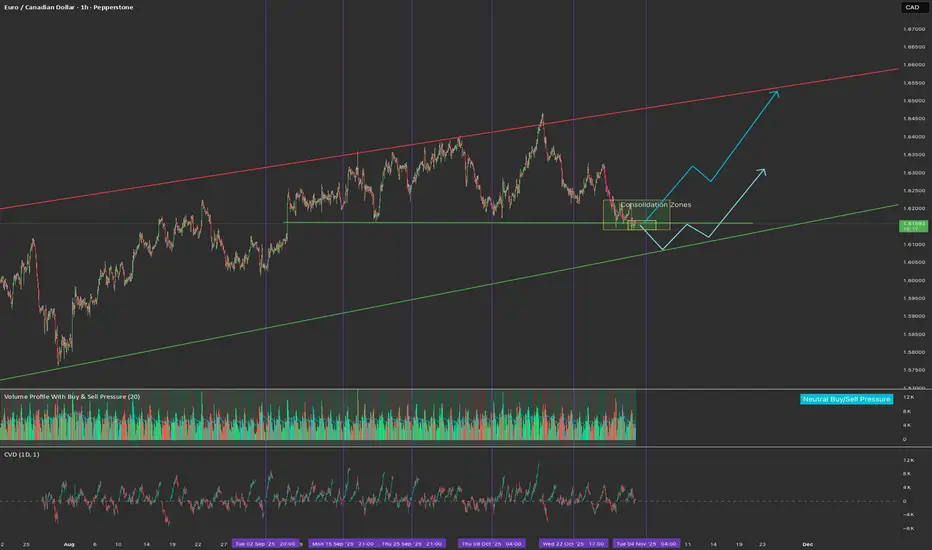
EURCAD: Consolidation Trading 🇪🇺🇨🇦
EURCAD is trading in a horizontal range.
The price has just tested its support.
There is a high chance that the price will bounce from that
and reach a resistance of the range soon.
Goal - 1.621
❤️Please, support my work with like, thank you!❤️
I am part of Trade Nation's Influencer program and receive a monthly fee for using their TradingView charts in my analysis.

EURCADThe price is currently in a downtrend, forming a series of Lower Lows (LL) and Lower Highs (LH)
After making the last Lower Low, the market is now pulling back upward, approaching the Fibonacci 0.6 retracement level
Entry: At the Fibonacci 0.6 retracement level (expecting a continuation of the downtrend)
Stop Loss (SL): Above the previous Lower High (LH)
Take Profit (TP): At the previous Lower Low (LL)

EURCADEURCAD formed a bullish divergence. The price stayed in a range for some time, then broke out of that range. After the breakout, the price created a higher low (HL). When the price broke the previous higher high (HH), an entry was taken. The stop loss (SL) was placed below the higher low (HL), and the risk-to-reward ratio was 1:1.

EUR-CAD Local Short! Sell!
Hello,Traders!
EURCAD Price is reacting from a horizontal supply area after a corrective push upward. Smart money may seek liquidity below the previous lows before the next structural decision. Time Frame 2H.
Sell!
Comment and subscribe to help us grow!
Check out other forecasts below too!
Disclosure: I am part of Trade Nation's Influencer program and receive a monthly fee for using their TradingView charts in my analysis.

EURCAD – Channel Breakdown & Bearish Continuation FlagEURCAD has broken down from a large ascending channel on the 4H timeframe, signaling a potential shift in structure from bullish accumulation to distribution and selling pressure. After the strong impulsive breakdown, price has formed a corrective flag pattern and is retesting previous support turned resistance.
This is a classic bearish continuation setup: impulse → correction → continuation.
Key Technical Confluences
Breakdown from major ascending channel
Lower-high formation after structure break
Bearish flag retest confirming seller control
Clean rejection from supply zone
Downside target aligns with major support around 1.5760
Entry: Retest of broken structure + flag formation
Stop Loss: Above flag high / structure invalidation zone
Take Profit: Previous major demand around 1.5760–1.5780
Bias: Bearish while price trades below the retest structure.
This setup follows the trend continuation play after a significant structural shift. Watching for momentum continuation to the downside and trailing stops as price progresses toward target.
As always, risk management is key — trading a clear structure setup with defined invalidation.

Strong sell eurcadMore drop possible
Monthly bearish correction already started
Support inner trend already breaks
Still sellers dominant

EUR/CAD Daily AnalysisAlthough price is predominantly in a bullish trend, the current price action suggests that a correction is in play.
With the internal trendline broken, there may be another opportunity to sell back to the bottom of the channel.
Look for a trade that meets your strategy rules.

EURCAD Sellers In Panic! BUY!
My dear followers,
I analysed this chart on EURCAD and concluded the following:
The market is trading on 1.6164 pivot level.
Bias - Bullish
Technical Indicators: Both Super Trend & Pivot HL indicate a highly probable Bullish continuation.
Target - 1.6180
Safe Stop Loss - 1.6154
About Used Indicators:
A super-trend indicator is plotted on either above or below the closing price to signal a buy or sell. The indicator changes color, based on whether or not you should be buying. If the super-trend indicator moves below the closing price, the indicator turns green, and it signals an entry point or points to buy.
Disclosure: I am part of Trade Nation's Influencer program and receive a monthly fee for using their TradingView charts in my analysis.
———————————
WISH YOU ALL LUCK

EURCAD-BUY-Strong BullishHello,
EURCAD is so bullish. Many people are thinking it is overbought. I got it. But the Bullish still leaves in Market.
Someone may say there is a pinbar.. it is possible to be a fake pinbar.
It seems to be pullback mode soon.
SL : 1.61735
TP1 : 1.163115
TP2 : 1.163503
Good luck

EURCAD IDEAPrice has made a double top pattern, looking for price to push down to the support area of 1.60800.
