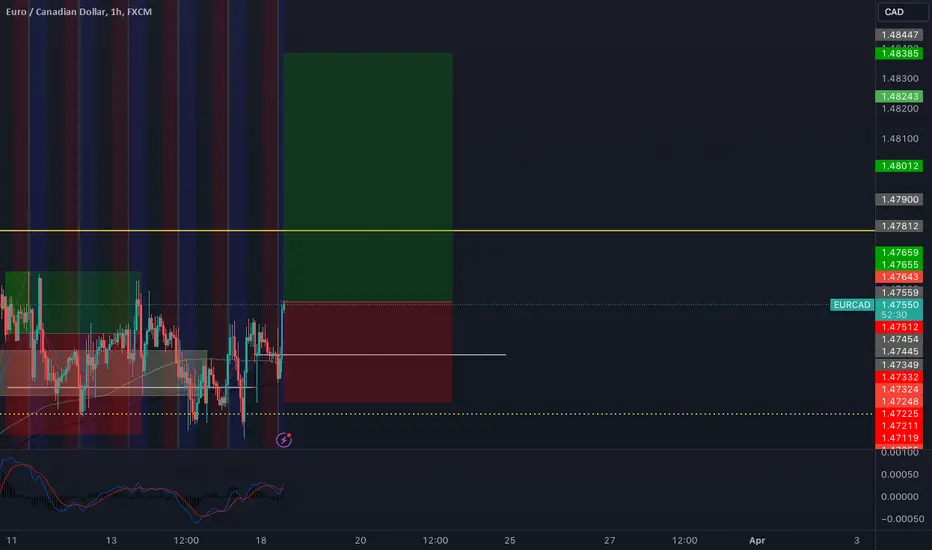
EURCADWhat are the odds that this pair will buy to this level. We have a break of structure on 2 levels. waiting the pair to retest where we have a clear break at 1.47200.
CADEUR trade ideas

EurCad - Bullish ABCD PaternUptrend on the Weekly TF
Price is at the bottom of Key Level - 3 week support
Bouncing from 200 4h EMA / 50 Day EMA

EURCAD LONG - The Trend is Your Frie..Happy Wednesday Everyone!
Hope you are all well and blessed!
This is a swing trade for the rest of the year - Ideally, I would only like to be buying this pair.
Analysis
12M - Bullish structure & candle stick forming
6M - Still bullish.
3M - March is the last 3rd Candle to complete this candle stick. I'd like to see this push up more so we can start looking around 1.50
1M - This will form a strong bullish candle stick for March.
W - Continuation - Forming a strong weekly Bullish candle
D - Price is currently bouncing on a strong Daily previous resistance - now support line. Continuation after Monday retest on the Daily support line. Tuesday Forming a clear bullish candle stick suggestion continuation. Just have to be cautious of any strong wicks.
No heavy news EU or CAD this week, so this should be a bless trade.
Happy Trading/Investing
Please feel free to share your view
God Bless.

EURCAD: Still In The Same Zone - Structure AnalysisEURCAD: Still In The Same Zone - Structure Analysis
EURCAD is close to a breaking point.
1.4765 proved to be a strong area as it has already stopped the biggest price rally.
If the price manages to break 1.4765 with a strong candle, then EURCAD should rise to the other resistance zones:
Resistance/Target Zones:
1.48600 ; 1.4940; 1.5025
If the price manages to develop below 1.4765 , then EURCAD should move down to the other support zones:
Support/Target Zones:
1.46650; 1.4565; 1.4480
You may find more details in the chart!
Thank you and Good Luck!
❤️PS: Please support with a like or comment if you find this analysis useful for your trading day❤️

BULLISH IDEA The support is doing the job, I think it can go around 1.47471.
I have taken this trade, anticipating a push higher from 1.47204.
A short buy.
What do you think about it?
I'll be glad be to hear from you


BIAS (LONG) ON EUR.CADHigher TF price action is still indicating bullishness.
I have taken this trade, anticipating a push higher from here.

sentiment to the downward trendEuro-Canadian dollar personal analysis: The price has reacted several times in the support area of 1.4717 and failed to break through the resistance of 1.4779. We should probably see the reduction of the downward trend, first the support of 1.4717 and then the next support of 1.4680

EUR/CAD BEARS WILL DOMINATE THE MARKET|SHORT
Hello,Friends!
We are now examining the EUR/CAD pair and we can see that the pair is going up locally while also being in a uptrend on the 1W TF. But there is also a powerful signal from the BB upper band being nearby, indicating that the pair is overbought so we can go short from the resistance line above and a target at 1.458 level.
✅LIKE AND COMMENT MY IDEAS✅

EUR/CAD BEST PLACE TO SELL FROM|SHORT
Hello,Friends!
Bearish trend on EUR/CAD, defined by the red colour of the last week candle combined with the fact the pair is overbought based on the BB upper band proximity, makes me expect a bearish rebound from the resistance line above and a retest of the local target below at 1.467.
✅LIKE AND COMMENT MY IDEAS✅

EURCAD - 1H - Support & Resistance - Long PositionIn this chart we have draw support & resistance levels. we decided to take an entry at the S1 Level and take our tp with the marked line. No Divergence spotted.

EUR/CAD SHORT from 1.4769The shocking CAD CPI news released an hour ago (CPI missed by .3%) has seen a sustained
period of CAD SELLING and now this BULLISH EUR/CAD strength is faltering as it is across all CAD pairs and we look to be entering a period of SELLING in order to unwind overbought RSI readings.
On the H1 time frame we have a potential double top at WR1 though the second candle has not yet completed and there's every possibility that EUR/CAD BULLS haven't finished with this market and may attempt to send the price higher.
We do have a confirmed SELL signal on the Andean Oscillator and the current H1 candle seems certian to be a doji so there are confirming signs that this pair may be headed south.
With a STOP above the recent high at 1.4774 we can get this trade on with a tight 13 pip STOP and hope that we can get a breakeven stop in the next hour if the price does indeed head south.
This is a soft STOP however and it will be adjusted if we get a burst of buying that threatens the STOP but as this buying would be sending the RSI back into o.b. then I expect SELLERS to eventually push the price back south.
Its by no means a done deal this trade and its always risky trading against the news with CAD being overwhelming BEARISH but buyers are certain to enter this market, its just a question of when.
Hopefully its now.

eurcad long welcome
here is my eurcad idea
its based on overall bullish market
lets see how this setup plays out
EURCAD - 4hrs ( intra day Sell Target Range 100 PIP ) 💵Pair Name EUR/CAD
Time Frame : 4 hrs
Scale Type : line chart + Candle Stick
------
🌐 spreading knowledge among us and to clarify the most important points of entry, exit and entry with more than 5 reasons
We seek to spread understanding rather than make money
🔗 Key Technical / Direction ( Short ) Intra Day
Type : Mid Term Swing
——————————
Bearish Break
1.47100 Area
Reasons
- Major Turn level / W
- Pattern Break
- inner choch Area
- Day / week low
- Month High Area
Bullish Reversal
1.46100 Area
Reasons
- Major Turn level
- Fixed range Poc
- Accumulation Zone
- pattern Target
- Ultra Volume

EURCAD Taking Advantage of Lateral MovementsToday is a day full of important economic events for the Eurozone. Highlights include a speech by Vice President Luis de Guindos, along with the release of key data on unemployment and economic sentiment in the Eurozone, as well as production figures from Portugal. Later in the day, we will be watching for inflation rates in Canada and U.S. housing permits. This news is key in the Euro's market movements against the Canadian dollar Today.
De Guindos has highlighted that inflation is contracting as the European economy slows, especially the German economy. However, he stresses that the labor market remains solid for Europe as a whole. In June, with data from President Lagarde's press conference in hand, the ECB is expected to make decisions based on the information received. Barometers, such as Bankinter's, underline a possible rate change to between 3.85% and 3.4% with a possible contraction of capital expansion towards 2025.
Technical analysis shows a sideways range in the EURCAD cross throughout March on the daily chart, with the pair moving between 1.50432 and 1.41563. Narrowing further this past week between 1.47896 and 1.44432. If the Eurozone news outperforms the Canadian market, we could see an upward correction in the Euro against the Canadian dollar looking for the highs previously indicated on the daily timeframe. Otherwise, the Canadian dollar could strengthen, looking for the 1.45546 area. The RSI Divergence RSI suggests a possible development in this direction currently marking 54.89%, while the previous volume candlestick trend presents an advancing bearish pressure. The price bell signals that 1.46705 is the most traded price at the control point (POC), which could become the pivot point for the sideways movement of this currency pair in the coming months or at least until June.

✨ EURCAD: DAY TRADE ✨(Based on the 75m Curve)
-SL3 @ 1.4888 (conservative)
-SL2 @ 1.4824 (moderate)
-SL1 @ 1.4780 (aggressive)
SLO2 @ 1.4774
SLO2 @1.4761
TP1 @ 1.4739
TP2 @ 1.4719
TP3 @ 1.4705
TP4 @ 1.4682
SUPPORT @ 1.4677
Short-term time frames (1-minute to 3 hour):
— Highly volatile, price movements can be fast and unpredictable.
— Suitable for day trading and scalping, but require constant monitoring and quick decision-making.
— Not ideal for beginners due to the risk and stress involved.

TIME FOR BUYAfter much wait and a shift in market structure i can say its time for a buy setup to trakeout the last daily high

EURCAD → Day Analysis | BUY SetupHello Traders, here is the full analysis.
Price reversal going up, levels for BUY . EURCAD long
! Great BUY opportunity EURCAD
I still did my best and this is the most likely count for me at the moment.
Support the idea with like and follow my profile TO SEE MORE.
Traders, if you liked this idea or if you have your own opinion about it, write in the comments. I will be glad 🤝
Patience is the If You Have Any Question, Feel Free To Ask 🤗
Just follow chart with idea and analysis and when you are ready come in THE GROVE | VIP GROUP, earn more and safe, wait for the signal at the right moment and make money with us💰

EURCADThe main 3M knit has been engulfed so that we expect the price falling to the source of 3M movement . The other hint that we can get is that weekly pullback leg main knit has been engulfed that we call it (double trigger) so we can sure that we have to open a big short position from here to the source of 3M movment.

EUR/CAD Bearish Trade IdeaOverview:
The EUR/CAD has repeatedly approached our entry zone around the 0.75 Fibonacci retracement level without a significant breakthrough, offering profitable short-term opportunities. As we settle into a holding pattern, anticipation builds for the expected larger move to the downside.
Entry Point:
Our entry is pegged at the 0.75 Fibonacci mark, a gold line drawn at 1.47482. This level has historically been a turning point, and we're banking on its continued significance.
Stop Loss:
The stop loss is set slightly above the recent highs and our entry, at the 1 Fibonacci level of 1.47792, to cap potential losses should there be an unexpected bullish surge.
Profit Targets:
Our exit strategy is ambitious yet calculated, aiming for a significant drop towards the 0 Fibonacci level at 1.46552. This substantial move to the downside aligns with the observed bearish momentum indicated by the Money Flow Index (MFI), which is currently below 50, reinforcing our bearish bias.
Rationale:
The consolidation pattern observed at our entry point suggests that upward momentum is waning and that bears might soon take control, driving prices lower. The MFI’s bearish money flow adds weight to our expectation of a forthcoming downward move. While we’ve pocketed gains from recent upticks to this level, the overarching setup points to a more considerable decline.
Risk Management:
This trade offers a favorable risk-reward ratio, with a tightly managed stop loss in case of adverse price movement. Traders should adjust their position sizes according to their risk tolerance and monitor the trade for signs of a shift in market sentiment that could invalidate our bearish outlook.

EURCAD LONGContinuation of trend!!
Market Structure Bullish on HTF
(Weekly Daily H4)
Weekly Rejection at AOI
Previous Weekly Structure Point
Weekly And Daily At same AOI
Daily Rejection from AOI
H4 EMA retest
Around psychological Level 1.47000
Entry At H4 HL Point
90% +3
REMEMBER: Trading is a Game Of Probability
: Manage Your Risk
: Be Patient
: Every Moment Is Unique
: Rinse, Wash, Repeat!
: Stay Hydrated
#Follow#Share#Comment#Boost

EURCAD Long TradeMARKET PHASE
OANDA:EURCAD is in a long term uptrend (daily) with a short term corrective structure that has been taking place (4 hour).
AREA OF VALUE
There was a buildup of liquidity (sell stops, shorts, long order stop losses) below the corrective structure swing lows. Price violently moved down to trigger the sell stops (liquidity) to pair against the buy orders needed to take price up. Price has started it`s initial move up but due to the velocity of the downward move, it's gapped orders around 1.47110. Although price has already retraced back to this level and violently continued its move up as we expected - we had skipped this trade to avoid correlation risk with a OANDA:GBPCAD trade at that time. Now price has been steadily making its way down to the same 1.47110 level, it's likely we may see a second leg up.
TRADE
I will be entering long on OANDA:EURCAD with the following parameters:
Sell Limit: 1.47110
Stop Loss: 1.46565
Take Profit: 1.48200

EURCAD: Near a Breaking Point - Structure AnalysisEURCAD: Near a Breaking Point - Structure Analysis
EURCAD is close to a breaking point.
1.4765 proved to be a strong area as it has already stopped the biggest price rally.
If the price manages to break 1.4765 with a strong candle, then EURCAD should rise to the other resistance zones:
Resistance/Target Zones:
1.48600 ; 1.4940; 1.5025
If the price manages to develop below 1.4765 , then EURCAD should move down to the other support zones:
Support/Target Zones:
1.46650; 1.4565; 1.4480
PS: It looks like it will increase further, but needs confirmation.
You may find more details in the chart!
Thank you and Good Luck!
❤️PS: Please support with a like or comment if you find this analysis useful for your trading day❤️
