Lingrid | EURCAD Bearish Pullback In the Bullish TrendFX:EURCAD is pulling back from the resistance zone after reaching a recent top, with sellers taking control near 1.6225. The structure is still within an upward channel, but the market is correcting lower in an ABC move. Holding above 1.6040 would confirm the bullish bias remains intact. Momentum suggests this is a corrective dip before resuming the broader uptrend.
📉 Key Levels
Buy trigger: Rebound from 1.6040 support
Buy zone: 1.6035–1.6060
Target: 1.6116 and potentially 1.6225
Invalidation: Break below 1.6000
💡 Risks
Failure of support at 1.6040 could extend bearish momentum.
Stronger CAD fundamentals (oil price gains or BoC stance) may pressure EURCAD.
Euro weakness from ECB outlook or macroeconomic data could delay recovery.
If this idea resonates with you or you have your own opinion, traders, hit the comments. I’m excited to read your thoughts!
Canadian Dollar/Euro
No trades
Trade ideas

EURCAD--SHORT--downward reation from longterm asending channel( check weekly chart embedded screenshot to this chart)
--entry and tp levels are as shown on chart

EURCAD Wave Analysis – 27 August 2025
- EURCAD reversed from resistance zone
- Likely to fall to support level 1.6000
EURCAD currency pair recently reversed down from the resistance zone lying at the intersection of the upper daily Bollinger Band and the two daily up channels from July and May respectively.
The downward reversal from this resistance zone created the daily Bearish Engulfing – which stopped the previous wave 3.
Given the strength of the aforementioned resistance zone, EURCAD currency pair recently can be expected to fall to the next round support level 1.6000.

EURCAD I AMD Played on the top of the Monthly Range
Monthly Range - Manipulated
Price closed inside with Daily OB / H4 breaker
Order flow is bearish now
Target 50% of the range
Good luck
David Perk

EURCAD Divergence + Wave 5 Complete → Correction Ahead?EURCAD ( OANDA:EURCAD ) started to fall after entering the Potential Reversal Zone(PRZ) and hitting the Resistance line .
The question is whether EURCAD will continue to fall in the coming hours or not!!
EURCAD has already managed to break the Support lines and is moving close to the Support zone(1.612 CAD-1.600 CAD) .
Also, we can see the Regular Divergence(RD-) between Consecutive Peaks.
In terms of Elliott Wave theory , it seems that EURCAD has managed to complete the main wave 5 , and we should wait for corrective waves .
I expect EURCAD to drop to at least 1.601 CAD AFTER breaking the Support zone(1.612 CAD-1.600 CAD) .
Second target: 1.597 CAD
Third target: Support line
Stop Loss(SL): 1.626 CAD
Please respect each other's ideas and express them politely if you agree or disagree.
Euro/Canadian Dollar Analyze (EURCAD), 4-hour time frame.
Be sure to follow the updated ideas.
Do not forget to put a Stop loss for your positions (For every position you want to open).
Please follow your strategy and updates; this is just my Idea, and I will gladly see your ideas in this post.
Please do not forget the ✅' like '✅ button 🙏😊 & Share it with your friends; thanks, and Trade safe.

EURCAD - Looking To Sell Pullbacks In The Short TermH1 - Strong bearish move.
No opposite signs.
Expecting bearish continuation until the two Fibonacci resistance zones hold.
If you enjoy this idea, don’t forget to LIKE 👍, FOLLOW ✅, SHARE 🙌, and COMMENT ✍! Drop your thoughts and charts below to keep the discussion going. Your support helps keep this content free and reach more people! 🚀

EURCAD bearish potentialEURCAD, we have a breakout below the trend line. The pair has the potential to initiate a bearish consolidation and move down to the lower line of the rising channel it is in. Potential support zone around 1.58000.

EUR/CAD Sell ConfirmedHi Traders.
We saw a breakout from the ascending channel and LTF continuation developed.
Now we also see the breakout from the LTF continuation correction.
This is the confirmation for my setup, so i entered the trade.

EURCAD POSSIBLE MOVE Price is bullish and it's far away from the inner trend from the daily timeframe. A pullback to the trend is expected for the continuation of the bullish bias. Alternatively, a break out and retest of the inner trend will set price to decline to the major trend.

Bearish drop?EUR/CAD is reacting off the pivot which is a pullback resistance and could drop to the 50% Fibonacci support.
Pivot: 1.61186
1st Support: 1.59852
1st Resistance: 1.62249
Risk Warning:
Trading Forex and CFDs carries a high level of risk to your capital and you should only trade with money you can afford to lose. Trading Forex and CFDs may not be suitable for all investors, so please ensure that you fully understand the risks involved and seek independent advice if necessary.
Disclaimer:
The above opinions given constitute general market commentary, and do not constitute the opinion or advice of IC Markets or any form of personal or investment advice.
Any opinions, news, research, analyses, prices, other information, or links to third-party sites contained on this website are provided on an "as-is" basis, are intended only to be informative, is not an advice nor a recommendation, nor research, or a record of our trading prices, or an offer of, or solicitation for a transaction in any financial instrument and thus should not be treated as such. The information provided does not involve any specific investment objectives, financial situation and needs of any specific person who may receive it. Please be aware, that past performance is not a reliable indicator of future performance and/or results. Past Performance or Forward-looking scenarios based upon the reasonable beliefs of the third-party provider are not a guarantee of future performance. Actual results may differ materially from those anticipated in forward-looking or past performance statements. IC Markets makes no representation or warranty and assumes no liability as to the accuracy or completeness of the information provided, nor any loss arising from any investment based on a recommendation, forecast or any information supplied by any third-party.

EURCAD SELLING OPPORTUNITY AROUND 1.62200EURCAD made bullish flag and trying to reach on its destination.After reaching on daily fvg around 1.62200 . We will get sell opportunity.

Eurcad H1EURCAD is trying to approach to its support and H1 OB .... Here we can find a buying opportunity with short SL below the h1 OB ... just wait buying setup and go for buying.

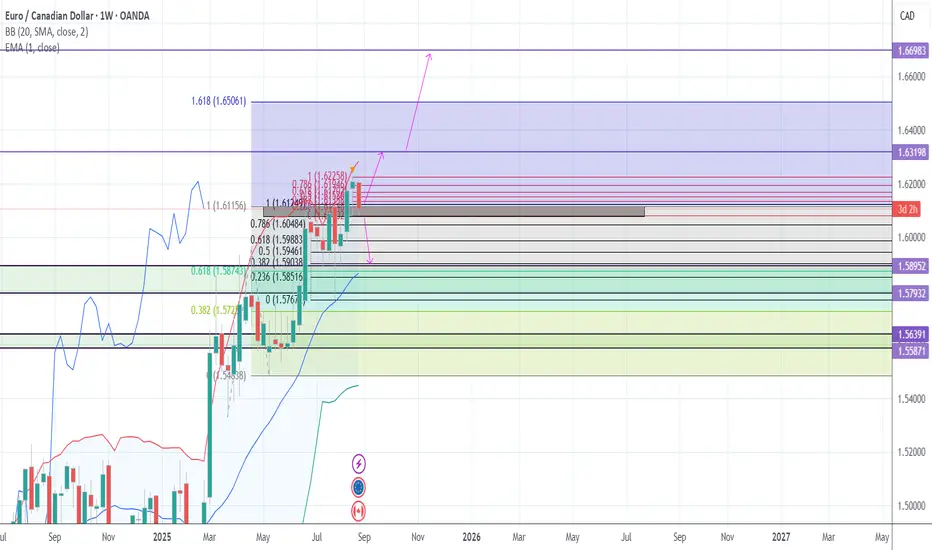
EURCAD – Weekly Fibonacci MTF AnalysisDescription:
Multi-timeframe analysis using Fibonacci retracement on EURCAD.
The Fibonacci retracement is drawn from the swing low at 1.49 to the swing high at 1.6225.
Key Levels:
0.382 (1.5722) → major support zone
0.618 (1.5874) → strong support, key bullish level
0.786 (1.6048) → current resistance/test area
Extension 1.618 (1.6506) → long-term bullish target
Scenarios:
Bullish: If price holds above 1.6040 – 1.5980, next targets are 1.6225 and 1.6500 (Fibo extension).
Bearish retracement: A break below 1.6040 could push the pair lower towards 1.5870 – 1.5720 support zone.
Position Management:
Stop Loss placed just below the previous closed weekly candle (weekly spike).
Trailing Stop of 1–1.5 ATR, always adjusted below the latest weekly spike.
Partial profits can be taken near 2.00, while the main bullish target remains 1.65 (Fibo extension).
Conclusion:
The weekly chart shows EURCAD testing the 0.786 retracement.
As long as it holds, the broader trend remains bullish towards 1.62 – 1.65.
Failure to hold above 1.6040 may trigger a deeper retracement to 1.5870/1.5720.
Potential bearish drop?EUR/CAD has rejected off the resistance level, which is a pullback resistance, and could drop from this level to our take profit.
Entry: 1.61358
Why we like it:
There is a pullback resistance.
Stop loss: 1.62248
Why we like it:
There is a swing high resistance.
Take profit: 1.59842
Why we like it:
There is an overlap support that aligns with the 50% Fibonacci retracement.
Enjoying your TradingView experience? Review us!
Please be advised that the information presented on TradingView is provided to Vantage (‘Vantage Global Limited’, ‘we’) by a third-party provider (‘Everest Fortune Group’). Please be reminded that you are solely responsible for the trading decisions on your account. There is a very high degree of risk involved in trading. Any information and/or content is intended entirely for research, educational and informational purposes only and does not constitute investment or consultation advice or investment strategy. The information is not tailored to the investment needs of any specific person and therefore does not involve a consideration of any of the investment objectives, financial situation or needs of any viewer that may receive it. Kindly also note that past performance is not a reliable indicator of future results. Actual results may differ materially from those anticipated in forward-looking or past performance statements. We assume no liability as to the accuracy or completeness of any of the information and/or content provided herein and the Company cannot be held responsible for any omission, mistake nor for any loss or damage including without limitation to any loss of profit which may arise from reliance on any information supplied by Everest Fortune Group.

EURCAD: Expecting Bullish Continuation! Here is Why:
The analysis of the EURCAD chart clearly shows us that the pair is finally about to go up due to the rising pressure from the buyers.
Disclosure: I am part of Trade Nation's Influencer program and receive a monthly fee for using their TradingView charts in my analysis.
❤️ Please, support our work with like & comment! ❤️

BUY EURCADEURCAD Buy Idea. We should see strong bullish movement on EURCAD heading into Wednesday. Later this week, EURCAD will continue the bearish trend. We buy for now.


EURCADPrice recently swept liquidity above the previous highs and immediately rejected, confirming a liquidity grab. This move also led to a market structure shift (MSS) to the downside.
Currently, EURCAD is pulling back towards the supply zone (grey box), where sellers are expected to step in. If price respects this area, we could see continuation to the downside in line with the bearish structure.
Key Points:
Liquidity sweep above highs.
Bearish market structure shift.
Retest of supply zone in progress.
Bearish continuation expected if rejection holds.
📉 Outlook: Bearish – potential downside targets lie towards 1.5950 – 1.5850 zone.

EURCAD Short Term Opportunity.I expect to retrace to 1.5990. Another good chance for short trade. 1.61-1.1650 zone is good to go..


EURCAD -Long-term breakout with Weekly & Monthly R:R 1:9EURCAD has broken above the long-term resistance at 1.6150-1.6200, with confirmation on both the weekly and monthly charts.Above this zone,there is little resistance until the previous highs near 1.7500-1.7550.

EURCAD break out of parallel channel.DIvergence is formed on 4h TF. Possible trend reversal.Order has been set on trend change.

EUR-CAD Bullish Breakout! Buy!
Hello,Traders!
EUR-CAD is trading in a
Strong uptrend and the
Pair is made a bullish
Breakout of the key
Horizontal level of 1.6180
Which is now a support
And as the breakout is
Confirmed we will be
Expecting a further bullish
Continuation on Monday
Buy!
Comment and subscribe to help us grow!
Check out other forecasts below too!
Disclosure: I am part of Trade Nation's Influencer program and receive a monthly fee for using their TradingView charts in my analysis.
