eur cad sell opportunity expecting eur cad further sell as we can see bunch of liquidity resting below.
recent fed rate cut supporting usd to move higher
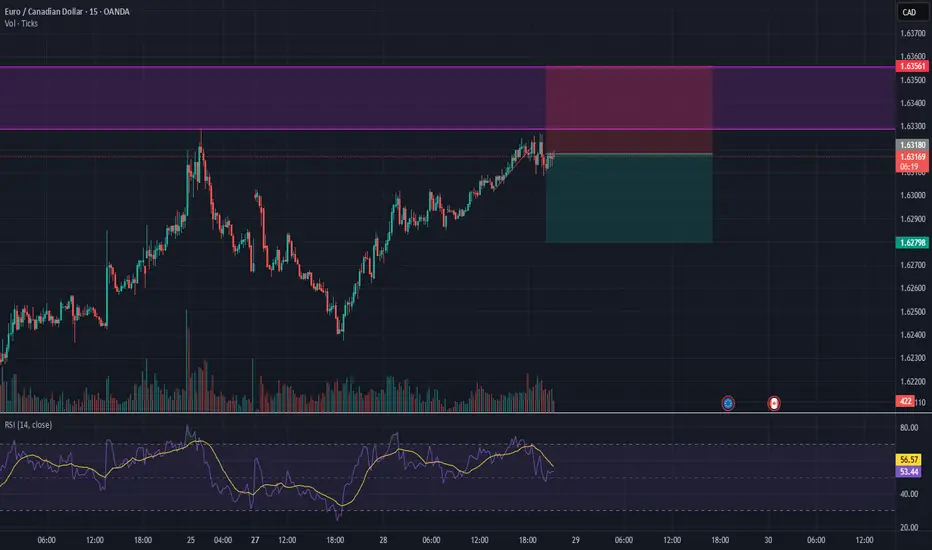
eur cad just broken channel and soon expecting a retest
Trade ideas

EURCAD: BUY SETUPThe pair is still in an up trend. After a brief pull back, it is set to resume it's movement in the up direction.
This is for educational purposes only

EURCAD - Bounce Play at the Rail!EURCAD has been respecting its ascending channel beautifully , bouncing between the rails like clockwork. And right now, price is once again retesting the lower trendline, where buyers have consistently stepped in before launching new bullish waves.
🏹As long as this trendline and minor support around 1.62 hold firm, I’ll be watching closely for bullish rejections or reversal patterns to confirm a fresh leg upward. A clean bounce from here could send price back toward the orange structure zone around 1.6350, followed by a potential push toward 1.64+ if momentum builds up.
⚔️However, a break and close below 1.6180 would invalidate the setup and could shift control back to the bears — but until that happens, the path of least resistance remains to the upside.
In short, I’m expecting EURCAD to trap late sellers and fuel another rebound from the channel’s base, the kind of move that rewards patience and precision.
📊 All Strategies Are Good; If Managed Properly!
~Richard Nasr

EURCAD → Retest of liquidity pool before growth FX:EURCAD is forming a correction to the key liquidity zone amid a global and fairly strong bullish trend. Will the bulls enter the game in the 1.6173 zone?
The euro is forming a correction to the strong support zone of 1.16, which is provoking a decline in the currency pair. The key area that the currency pair is striving for is 1.6173. The trend is bullish. A reaction from the bulls is possible...
A false breakout of resistance is forming a correction. However, the price is still within the trading range of 1.64 - 1.6173. The price is heading towards support for a retest, and the indicated zone is likely to stop the correction...
Resistance levels: 1.633, 1.64
Support levels: 1.6173, 1.603
A liquidity pool below 1.62 - 1.617 could change the game in favor of buyers. Remember, the trend is bullish, and this will be a clear advantage for players. A false breakdown of support and the absence of a downward momentum could trigger growth.
Best regards, R. Linda!

EUR/CAD Retest Complete - Time to Go Long?🎯 EUR/CAD: The "Great Maple Heist" Setup | Swing/Day Trade 🍁💶
📊 Asset Overview
EUR/CAD (Euro vs. Canadian Dollar) - Forex Market
🔍 The Setup: Bullish Retest Play
The EUR/CAD is showing classic bullish confirmation with a pullback retest at the 38.2% Fibonacci retracement level, aligning beautifully with our weighted moving average. This is where the smart money layers in! 🧠💰
🎯 Entry Strategy: The "Thief Method"
Primary Approach: Layered limit orders (The legendary Thief OG style!)
Thief Layer Entry Levels:
Layer 1: 1.63000
Layer 2: 1.63250
Layer 3: 1.63500
Layer 4: 1.63550
Feel free to add more layers based on your risk appetite and position sizing!
Alternative: Market execution at current levels if you prefer immediate entry.
🛡️ Risk Management
Stop Loss: 1.62800 (Thief OG reference level)
⚠️ Note: Ladies & Gentlemen (Thief OG's), this is MY stop loss based on MY analysis. YOU set YOUR own stop loss based on YOUR risk tolerance. Trade at your own risk and protect your capital like it's the Crown Jewels! 👑
🎯 Profit Target
Target: 1.65300
This level represents a confluence of:
🧱 Strong resistance zone ("Electric Shock Wall")
📈 Overbought territory
🪤 Potential trap zone for late longs
⚠️ Note: Ladies & Gentlemen (Thief OG's), this is MY take profit level. YOU decide when to bank YOUR profits. The market gives, and the market takes—don't be greedy, take money when you can! 💸
🔗 Related Pairs to Watch
Keep an eye on these correlated pairs for confirmation:
🇺🇸 USD/CAD - Watch the Loonie's overall strength
Direct inverse correlation to EUR/CAD
Oil prices heavily influence CAD strength
💵 EUR/USD - Euro strength gauge
Shows Euro's overall market sentiment
Risk-on/risk-off indicator
🛢️ Crude Oil (WTI/Brent) - The CAD's best friend
CAD is a commodity currency
Higher oil = Stronger CAD = Pressure on EUR/CAD
Lower oil = Weaker CAD = Support for EUR/CAD
Key Correlation Point: If oil drops while EUR shows strength, this setup becomes even more favorable! 🎰
📝 Technical Summary
✅ Bullish structure intact
✅ 38.2% Fib retest complete
✅ Weighted MA providing support
✅ Multiple confluence factors
✅ Risk/Reward ratio: Favorable (~2.5:1)
⚠️ Disclaimer
This is the "Thief Style" trading strategy — a layered approach to swing/day trading created purely for educational and entertainment purposes. This is NOT financial advice. Trading forex carries substantial risk of loss and is not suitable for all investors. Always do your own research, manage your risk, and never trade with money you can't afford to lose. Past performance does not guarantee future results.
Trade safe, trade smart, and may the pips be ever in your favor! 🎲💎
✨ If you find value in my analysis, a 👍 and 🚀 boost is much appreciated — it helps me share more setups with the community!
#EURCAD #ForexTrading #SwingTrading #DayTrading #FibonacciRetracement #TechnicalAnalysis #ForexSignals #PriceAction #TradingStrategy #ThiefMethod #ForexSetup #CurrencyTrading #RiskManagement #ForexCommunity #TradingIdeas #CAD #EUR #ForexAnalysis #SupportAndResistance #MovingAverage

EUR/CAD BEARS ARE STRONG HERE|SHORT
Hello, Friends!
EUR/CAD pair is trading in a local uptrend which we know by looking at the previous 1W candle which is green. On the 6H timeframe the pair is going up too. The pair is overbought because the price is close to the upper band of the BB indicator. So we are looking to sell the pair with the upper BB line acting as resistance. The next target is 1.627 area.
Disclosure: I am part of Trade Nation's Influencer program and receive a monthly fee for using their TradingView charts in my analysis.
✅LIKE AND COMMENT MY IDEAS✅

EURCAD higher bearish expecting
OANDA:EURCAD trend based analysis, currently we having bounce from strong sup zones, we are have long time bullish trend, for me this here is point of revers.
SUP zone: 1.63200
RES zone: 1.61500, 1.61000

EURCAD is on bearish side.EURCAD has reached in a OB zone, which has been tested 3 times. Fundamentals show that EURCAD is on bearish side.
Short position has been opened.

long EURCADAnticipating a Bullish Euro.
Its possible to take it from now and hold
Personally will jump in 28/10/2025 if it holds in the Red zone

EURCAD Looking Bullish Trend to wardsThe EUR/CAD pair is currently in a bullish trend, consolidating after a recent pullback toward a key support zone. The euro has established a strong support area, indicating that buyers may soon regain control.
Although price is currently showing signs of a temporary decline, the broader trend remains upward. A bullish reaction from the current support area could trigger a rebound. However, traders should watch for a possible false breakout below the support before the next upward move If the price successfully reacts from the current level, the next resistance zone is expected between 1.6350 and 1.6500.
You may find more details in the chart.
Trade wisely best of Luck.
Ps; Support with like and comments for better analysis thanks for Supporting

Strong sell eurcadCurrently trading in down trend
Bearish correction continue till this week
Strong monthly sell structure

EURCAD EUR/CAD 4H chart shows a bullish setup after a strong corrective move into a key demand zone. Price is currently rebounding from support around 1.6220–1.6250, suggesting potential for an upside continuation. A clean break and retest of the mid-zone could trigger momentum toward the 1.6400 resistance area — the marked target level. Buyers are expected to step in from the current demand zone, maintaining the bullish structure for a potential rally continuation.
"Thank you for your support! If you found this idea valuable or learned something new, please consider liking and leaving a comment. I’d really appreciate hearing your feedback and thoughts.

EURCAD reached at OB zone, possible reversal.EURCAD has reached in a OB zone, which has been tested 3 times. Fundamentals show that EURCAD is on bearish side. Fundamentaly CAD is strong.
Short position has been opened.
EURCAD: Swing HIGHLet’s discuss what the kids have been up to.
The AUD, CHF, and JPY were quiet last week.
Canada had slight growth with their consumer price. This growth has little to no major impact on their inflation and creates the possibility for them to trim their central bank rate.
However EURO didn’t have much to say. The European Central Bank President spoke but didn’t give insight on the ECB’s intentions for their central bank meeting this week. The manufacturing and services purchasing managers index wasn’t insightful either with slight and stationary growth.
GBP yearly consumer price remained the same while their flash manufacturing and services didn’t grow past 50 signaling the UK may still be in contraction and NZD quarterly CPI grew to 1% indicating that it more then likely will increase the economies inflation. It’s still unclear how these numbers will affect these currencies and their central bank decisions.
Lastly is our favorite Economy…The United States Dollar
The USD was unsurprisingly chatty sharing their consumer price index which was reported lower than expectations and purchasing managers index that grew slightly.
These numbers may just encourage the FOMC to lower the interest rate at the meeting this week since prices are going down while businesses activity may just be picking up.
With the amount of uncertainty surrounding this economy it’s hard to say what will happen.
The market appears to still be in Fear so I guess we will just have to wait and see what happens 🤷🏽♀️.

POTEND LONG TERM SELL OF EURCADIf my trendline analysis hold, EURCAD might have just begone a downtrend. Market must lead and we follow

EURCAD: Another Trend Line Based Opportunity 🇪🇺🇨🇦
EURCAD may continue rising after a test of a solid
rising trend line on a daily.
A formation of a double bottom pattern accompanied by
a bullish Change of Character on an hourly time frame
indicates a strong buying interest.
Goal - 1.6305
❤️Please, support my work with like, thank you!❤️
I am part of Trade Nation's Influencer program and receive a monthly fee for using their TradingView charts in my analysis.


Uptrend in EURCADAccording to the analysis, we expected the price to reach the LS range and start its upward movement from there. This happened and now we expect the price to reach the QML in case of correction and go up from there.

ERUCAD Day Candle Manipulation Short ERUCAD recently broke the resitance level and price quickly rjejected form that area and forme bearish Engulfing pattern and price will go down enter at two level the current price and pull back.

EURCAD On the daily timeframe, the market shows a clear bullish structure, characterized by a consistent sequence of higher highs and higher lows, confirming that bullish momentum remains dominant. The overall price action reflects strong buying pressure and structural integrity, suggesting a continuation of the upward trend.
After identifying this directional bias, I scaled down to the 2-hour timeframe (H2) to look for a precise entry confirmation aligned with the main bullish structure. On this lower timeframe, a clear confirmation setup appeared — including a minor structure break, mitigation of the last point of interest, and signs of bullish volume entering the market. These confluences validated the continuation of the move in favor of the higher-timeframe trend.
The trade was planned with a 1:3 risk-to-reward ratio, ensuring efficient risk management while maximizing potential profit if the bullish impulse continues. The Take Profit (TP) was set at the projected extension of the impulsive leg, while the Stop Loss (SL) was placed just below the last relevant swing low to maintain structural consistency and protect the position.
In summary, this trade idea combines a higher-timeframe bullish structure, a lower-timeframe confirmation entry, and solid risk management, aiming to capitalize on the continuation of institutional order flow in the bullish direction.

EURCAD⬆️ Buy Entry: 1.62420 - 1.62180
⏹️ Stop Loss: 1.61850
*️⃣ Take Profit: 1.62880 - 1.63170
🔠 Price consolidation near local support levels (15M). A short-term strengthening of the euro and an impulsive breakout of the pair above 1.63000 are expected. We are also closely monitoring the publication of statistics.

EURCAD possible bullish for 1.6340 & 1.6365#price is testing previous 4h trend line support and accumulation area. 1.6222-1.6177 is the area of interest to go long for 1.6340 and 1.6365. i set my target as 1.6340. stop loss: 1.6160

EURCAD – Watching Key 4H SupportEURCAD is approaching a strong support level on the 4H chart after making a semi-impulsive move down. This level has been tested several times already.
Key observations:
✅ Price at multi-test support zone
✅ Momentum under 50, with potential to hook upward or form divergence
✅ Volume not yet aligned — we’ll be waiting for confirmation
This is not a trade yet — but it’s one to watch closely. For a valid VMS setup, we’ll need to see momentum confirmation and volume spike into alignment at this level.
⚠️ For educational purposes only. This is not financial advice.
#Forex #EURCAD #VMSStrategy #TradingView
