EURCAD – Wave Analysis OutlookEURCAD showing strong signs of reversal:
RSI divergence across all timeframes ✅
Pin bar rejection visible on multiple timeframes ✅
Can’t ask for a cleaner short setup than this. I’ll be watching closely for continuation lower with next downside targets lining up near 1.59 and below.
👉 What do you think — agree this is the best short setup we’ve seen recently?
⚠️ Disclaimer: This outlook is based on my personal wave analysis and is shared for educational purposes only. It is not financial advice.
Trade ideas

The overall trend is bullish but in the short term it is bullishCurrently, the trend of this currency pair is completely bullish, but in the short term it is bearish. We can expect a bearish position by correcting the position to reach the demand limits.


EURCAD SELL SCENARIOEuro start to get weaker price is below the last demand zone and already rejected the zone few times. It is possible to see the price fall to the the next demand zone at 1.62018-1.61795

EURCAD: Long Signal Explained
EURCAD
- Classic bullish pattern
- Our team expects retracement
SUGGESTED TRADE:
Swing Trade
Buy EURCAD
Entry - 1.6217
Stop - 1.6201
Take - 1.6247
Our Risk - 1%
Start protection of your profits from lower levels
Disclosure: I am part of Trade Nation's Influencer program and receive a monthly fee for using their TradingView charts in my analysis.
❤️ Please, support our work with like & comment! ❤️

EURCAD A Fall Expected! SELL!
My dear friends,
Please, find my technical outlook for EURCAD below:
The instrument tests an important psychological level 1.6289
Bias - Bearish
Technical Indicators: Supper Trend gives a precise Bearish signal, while Pivot Point HL predicts price changes and potential reversals in the market.
Target - 1.6257
About Used Indicators:
Super-trend indicator is more useful in trending markets where there are clear uptrends and downtrends in price.
Disclosure: I am part of Trade Nation's Influencer program and receive a monthly fee for using their TradingView charts in my analysis.
———————————
WISH YOU ALL LUCK

Important week for EURCADEURCAD - Canadian Dollar is the weakest player of market on 3.3.2025. I can see a possible buy if the price reject the last strong demand zone. On 7.3.2025 CAD will have high impact news: Employment Change and Unemployment Rate which will be decisive for the next moves of the pair.

EUR CAD Elliott Wave Analysis Hello friends
We are witnessing the formation of a complete Elliott wave pattern on the EURCAD chart.
These waves from 1 to 5 are quite distinct and you can even count their subwaves (especially the microwaves of the main wave 5).
Now wave 5 is completing and moving inside an ascending channel. The microwaves of wave 5 have already been completed.
But after the completion of wave 5, with the breakdown of the trend line drawn below and a return to it, we can expect the price to fall to the specified support.
The first support is 1.57600 and the second target is 1.51000. Of course, the price decline in wave 5 is always accompanied by divergence and a decrease in the slope of the chart, as you can see, the slope of wave 5 is much less than wave 3 and the divergence occurred between the main waves 5 and 3.
Good luck and be profitable.

eurcadtouched upper trend, now we expect correction move before we see the next move either to break the channel

Bullish continuation above key support?EUR/CAD is falling towards the pivot, which serves as a pullback support that aligns with the 50% Fibonacci retracement and could bounce back to the 1st resistance, which acts as a pullback resistance.
Pivot: 1.61864
1st Support: 1.61261
1st Resistance: 1.63589
Disclaimer:
The above opinions given constitute general market commentary, and do not constitute the opinion or advice of IC Markets or any form of personal or investment advice.
Any opinions, news, research, analyses, prices, other information, or links to third-party sites contained on this website are provided on an "as-is" basis, are intended only to be informative, is not an advice nor a recommendation, nor research, or a record of our trading prices, or an offer of, or solicitation for a transaction in any financial instrument and thus should not be treated as such. The information provided does not involve any specific investment objectives, financial situation and needs of any specific person who may receive it. Please be aware, that past performance is not a reliable indicator of future performance and/or results. Past Performance or Forward-looking scenarios based upon the reasonable beliefs of the third-party provider are not a guarantee of future performance. Actual results may differ materially from those anticipated in forward-looking or past performance statements. IC Markets makes no representation or warranty and assumes no liability as to the accuracy or completeness of the information provided, nor any loss arising from any investment based on a recommendation, forecast or any information supplied by any third-party.

War Room Watchlist — EURCAD (Pullback into Strong Support)EURCAD is pulling back into a best-in-class support zone. My plan is to wait for structure confirmation at the level—ideally a clean engulfing trigger—and then see VMS line up at the moment of trigger:
Volume: ≥70 on/into the trigger (no limp prints)
Momentum: decisive hook with direction (not flat / not diverging)
Structure: retest + rejection, with a clean 2R path before traffic
If/Then: If price taps the zone and prints an engulfing with V≥70 + momentum hook, then I’ll consider it; else it stays a pass. No alignment, no trade.
I post the full morning session daily (multi-market breakdowns) — see profile links for details.
#Forex #EURCAD #VMSStrategy #AlignedExecution #WarRoomWatchlist

EURCAD: Potential Long Setup
Market Context
Price swept liquidity below the previous daily low and then broke structure to the upside, signaling a potential shift in market direction. This could be the beginning of a bullish leg if price respects demand on the pullback.
Key Technicals
Clear liquidity sweep (CRT) beneath recent lows
Bullish BOS on the 4H timeframe
Watching for price to retrace back into the imbalance (FVG) area
FVG aligns closely with the 50 EMA and 0.5–0.618 Fibonacci retracement zone on the 15m chart
Plan is to look for rejection or confirmation candle within this confluence area
Trade Plan
Wait for price to return into the FVG + 50 EMA + Fib confluence zone
Enter only if a clear rejection or engulfing candle forms
Direction: Longs only while price holds above 50 EMA
Target: Liquidity above recent highs around 1.63600
Invalidation: If price breaks below the sweep low and closes under demand
Summary
Price has shifted bullish after a liquidity sweep. A pullback into demand + FVG zone could offer a high-probability long setup if confirmation appears.

EURCAD: May Keep Growing! Here is WhyThe EURCAD pair broke and closed above a significant daily resistance level, with the breached structure now acting as support.
Following a retest of this support, a double bottom pattern was formed, subsequently breaking its neckline.
This pattern's completion validates the strength of buying pressure and suggests a high probability of continued upward movement.
The target price is set at 1.6316.

EURCAD-LONG IDEAEURCAD 4 hour structure is really bullish now formed a small accumulation in 1 hour time frame and broke the range plus daily candle closed engulfing good indication for short term long. There is no divergence so far seen right now. place your BUY LIMIT order rest of things are mentioned in the chart.

EURCAD - Bullish IdeaIn previous sessions EURCAD has shown it is in uptrend.
Currently the pair is in consolidation and breakout form rectangular box can lead to further upside.

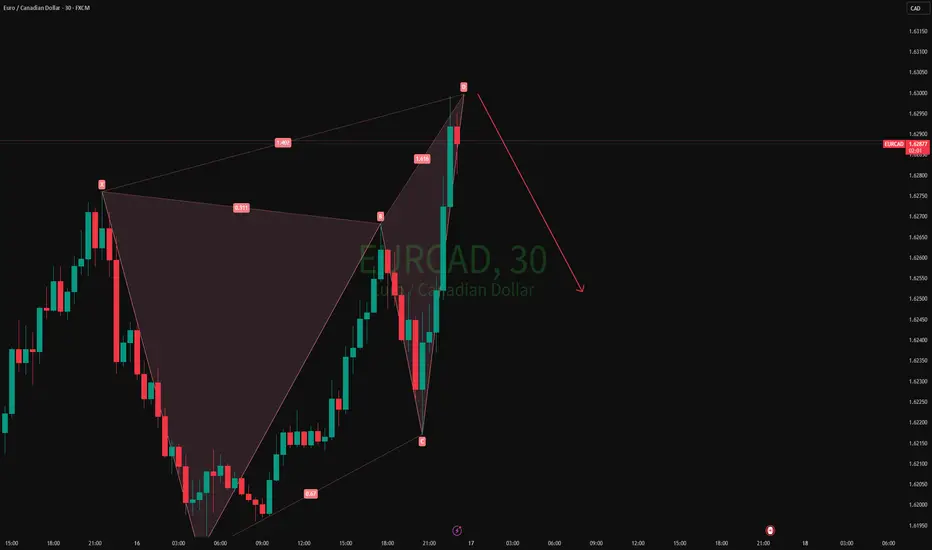
16-09-2025 As shown in the figure: 1H Bearish Butterfly
The market is not always chaotic and disorderly, and there is a precise geometric beauty hidden in price fluctuations. The harmonic form long strategy is a powerful tool for accurately identifying potential market reversal points based on the Fibonacci ratio. When the form forms perfectly at the key support level, it often indicates the depletion of bearish momentum and the initiation of bullish trends.
EURCAD
1Hour Time frame Long Call
EUR Is still strong
CAD is still weak
Resistance Broken / Retraced back to 0.618,
Bullish Momemtum
manage risk !

SHORT ON EUR/CADEUR/CAD has a nice rising channel at a major resistance area.
There is a lot of Liquidity to the downside.
I have a sell limit set at the top of the channel to activate me after the possible sweep of liquidity behind the resistance line of the channel.
Looking to catcu 300-400 pips on this play.


EUR/CAD SELLERS WILL DOMINATE THE MARKET|SHORT
Hello, Friends!
We are now examining the EUR/CAD pair and we can see that the pair is going up locally while also being in a uptrend on the 1W TF. But there is also a powerful signal from the BB upper band being nearby, indicating that the pair is overbought so we can go short from the resistance line above and a target at 1.597 level.
Disclosure: I am part of Trade Nation's Influencer program and receive a monthly fee for using their TradingView charts in my analysis.
✅LIKE AND COMMENT MY IDEAS✅

EURCAD High Probability Reversal + RSI DivergenceEURCAD has been consolidating at a resistance area after being in an uptrend.
It formed an ascending triangle pattern which although this is a continuation pattern usually, sometimes it does occur as a reversal pattern. This coupled with the fakout and the spike in volume when price went back into the triangle pattern (and don't forget the rsi divergence) makes this setup a high probability.

EURCAD Will Go Down!
HI,Traders !
#EURCAD broke out of the
Rising Wedge and the
Breakout is confirmed
So we are locally bearish
Biased and we will be
Expecting a further
Local move down !
Comment and subscribe to help us grow !

EURCADLooking for a retracement of 23% or lower from the previous low of the recent wave. Since July, the EUR has been gaining strength compared to the CAD while volume has been decreasing in general. Price is currently ranging on a lower timeframe.
