CADJPY BULLISH BIAS|LONG|
✅CADJPY has retested a clean demand level after a corrective pullback, showing early signs of bullish continuation. Liquidity beneath the recent low is swept, hinting a push toward the target zone. Time Frame 4H.
LONG🚀
✅Like and subscribe to never miss a new idea!✅
Trade ideas

CADJPY manipulation key level shortCADJPY rejected from same key resistance area and price may reverse again from this area.let us see. How it plays out
:
CADJPY: Overbought Market & Pullback 🇨🇦🇯🇵
In my view, CADJPY turned too overbought and there is
a high chance that it will continue correction.
The closest support is 108.87
❤️Please, support my work with like, thank you!❤️

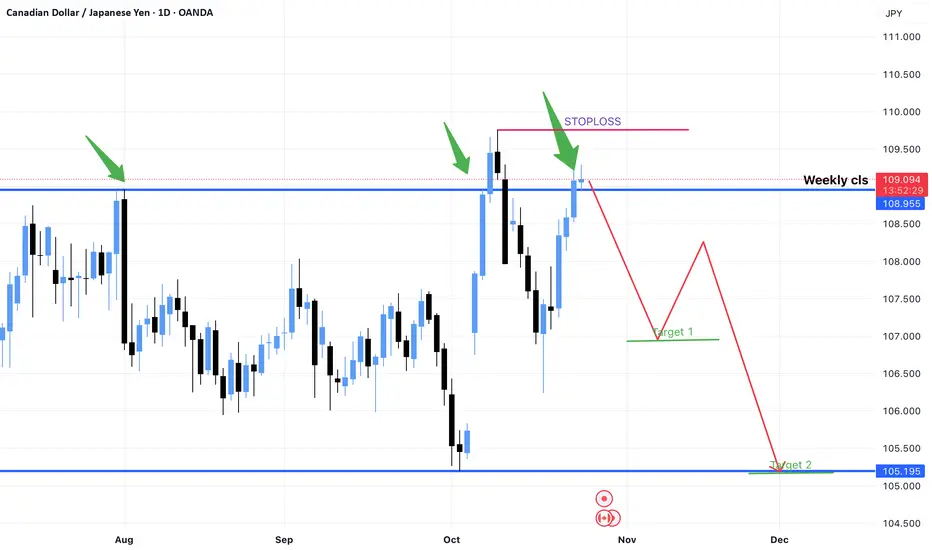
CADJPY Wave Analysis – 30 October 2025
- CADJPY broke resistance zone
- Likely to rise to resistance level 111.30
CADJPY currency pair recently broke the resistance zone between the resistance level 109.60 (which stopped wave (1) at the start of October) and the 50% Fibonacci correction of the downtrend from July of 2024.
The breakout of this resistance zone accelerated the active intermediate impulse sequence (3) from the middle of October.
Given the clear daily uptrend, CADJPY currency pair can be expected to rise further to the next resistance level 111.30 (former multi-month high from November).

CAD/JPY BULLS WILL DOMINATE THE MARKET|LONG
CAD/JPY SIGNAL
Trade Direction: long
Entry Level: 108.551
Target Level: 109.472
Stop Loss: 107.936
RISK PROFILE
Risk level: medium
Suggested risk: 1%
Timeframe: 3h
Disclosure: I am part of Trade Nation's Influencer program and receive a monthly fee for using their TradingView charts in my analysis.
✅LIKE AND COMMENT MY IDEAS✅

CADJPY: Possible buy setupCADJPY: Possible buy setup. Wait for the price to correct and if it follows my arrows, it will be a good setup.
Cheers

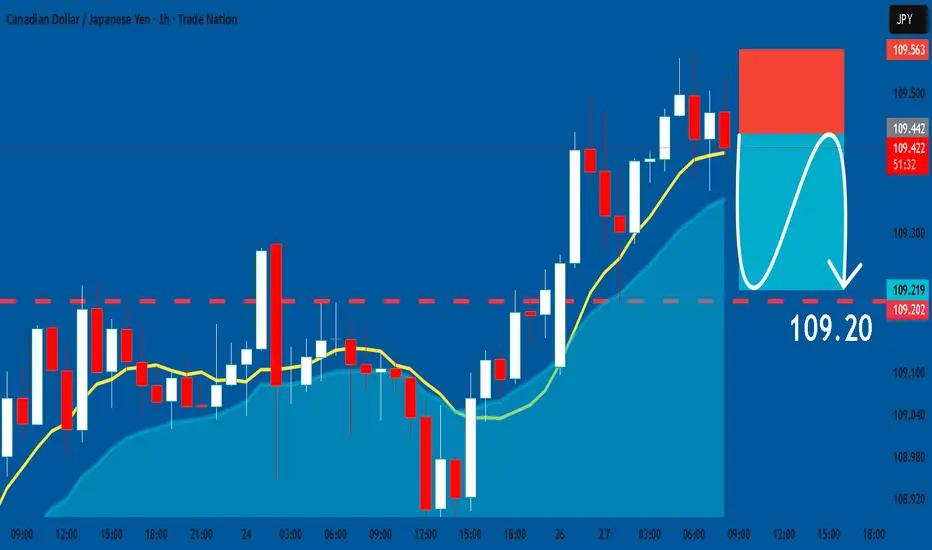
CADJPY Sell Setup🧠 Description:
Price previously rejected from the 109.55 liquidity sweep down to 108.50. It has now returned to 109.23 and reacted to the 109.40 order block — a potential supply zone.
This setup aligns with smart money concepts and offers a clean risk-reward structure for short positioning.
🎯 Trade Plan:
Entry Area : 109.20 (current price)
Stop Loss Above : 109.80 (liquidity high)
Take Profit 1 : 108.00 (minor support)
Take Profit 2 : 106.820 (supply zone)
Risk-Reward : Minimum 1:2
⚠️ Disclaimer:
This analysis is for the writer’s personal reminder. Please do your own analysis. Salamprofit.
#CADJPY #SmartMoney #ForexTrading #OrderBlock #LiquiditySweep #TechnicalAnalysis #SwingTrade #SalamProfit

CADJPY Is Very Bearish! Sell!
Please, check our technical outlook for CADJPY.
Time Frame: 1D
Current Trend: Bearish
Sentiment: Overbought (based on 7-period RSI)
Forecast: Bearish
The market is trading around a solid horizontal structure 109.243.
The above observations make me that the market will inevitably achieve 107.474 level.
P.S
The term oversold refers to a condition where an asset has traded lower in price and has the potential for a price bounce.
Overbought refers to market scenarios where the instrument is traded considerably higher than its fair value. Overvaluation is caused by market sentiments when there is positive news.
Like and subscribe and comment my ideas if you enjoy them!

BUY* The buy setup will trigger only if CADJPY breaks above **109.900**, confirming a real bullish breakout beyond the liquidity trap.

SELL* Rejection from manipulation zone confirmed on 1H and 4H.
* Bearish liquidity alignment with JPY strength theme.

CADJPY: Another Trap?! 🇨🇦🇯🇵
One of the setups that we discussed on a live stream today is on CADJPY.
It looks like we have a confirmed bearish trap here,
and the price is steadily recovering after a false violation of a key support.
I expect a rise at least to 109.08 level now.
❤️Please, support my work with like, thank you!❤️
I am part of Trade Nation's Influencer program and receive a monthly fee for using their TradingView charts in my analysis.

CADJPY Price looks to have rejected the resistance area of 109.500, making a double top pattern. The last price came down from that area, it broke and retested the area of 108.850 before continuing with the bearish momentum.

Sell StopPrice forming a potential **reversal zone** with lower highs.
below 108.900 for reversal entry.

Buy Stop below 108.900 for reversal entry.
Price forming a potential **reversal zone** with lower highs.

CADJPY: Bearish Continuation & Short Signal
CADJPY
- Classic bearish pattern
- Our team expects retracement
SUGGESTED TRADE:
Swing Trade
Sell CADJPY
Entry - 109.44
Stop - 109.56
Take - 109.20
Our Risk - 1%
Start protection of your profits from lower levels
Disclosure: I am part of Trade Nation's Influencer program and receive a monthly fee for using their TradingView charts in my analysis.
❤️ Please, support our work with like & comment! ❤️
CADJPY SELL!!Spotted my setup on a lower timeframe expecting last weeks fridays low to be taken out before we continue our move to the upside.

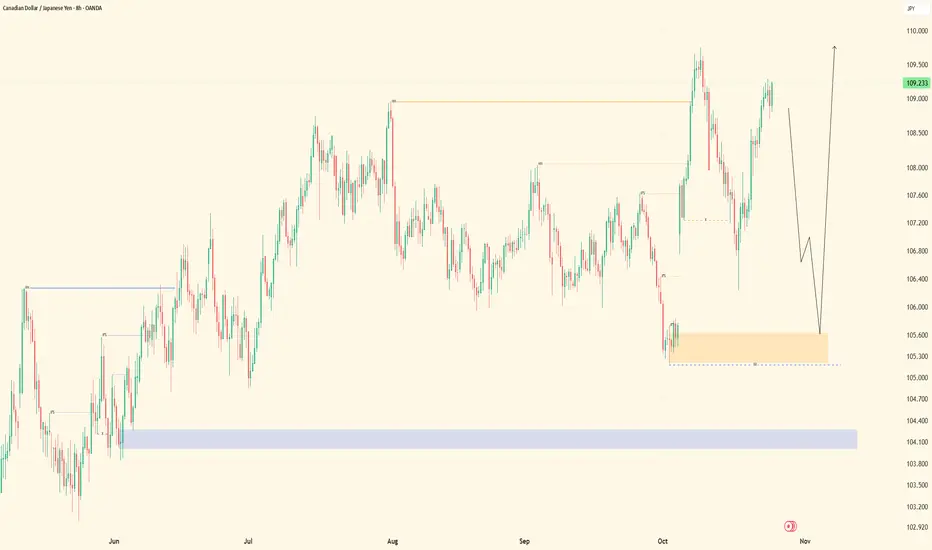
CADJPY| Bull Structure- Waiting for Deep Mitigation Higher timeframes show a strong bullish structure, refined and mapped to perfection. Our overall bias remains upward, but patience is key — we’re waiting for a deep drop into our order block zone beneath price before seeking precise entries.
On mid-timeframes, we’ve refined structure and order blocks, confirming where continuation opportunities may appear. Currently, price is dancing around premium areas, showing signs of consolidation and energy build-up.
If price decides to break significant highs to the left, we’ll follow price and monitor fresh liquidity generation, aiming to capitalize on the next leg higher. Until then, we take it step by step, letting price do its work without forcing predictions.
💡 Remember: Our job is not to predict the market, but to follow smart money and structure, letting price lead the direction.
Patience, discipline, and precision — that’s how we play the game.
Let’s go. 🔥
#CADJPY +2300 Pips Swing Buy With Three Major Targets| Possible?The CADJPY has nicely formed a swing bullish pattern that is confirmed. One strong entry zone lies between these prices, 109 and 106, which remain a critical level. As described in the chart, there are three targets to focus on. We strongly recommend thoroughly examining the charts and reading them carefully, as this description is brief due to the detailed chart.
Here’s what to look for:
- Look for a continued or repeated pattern to better understand the next possible move.
- Look for volume when it emerges; enter with the trend momentum.
- Don’t forget to like and comment on the chart!
Team Setupsfx_

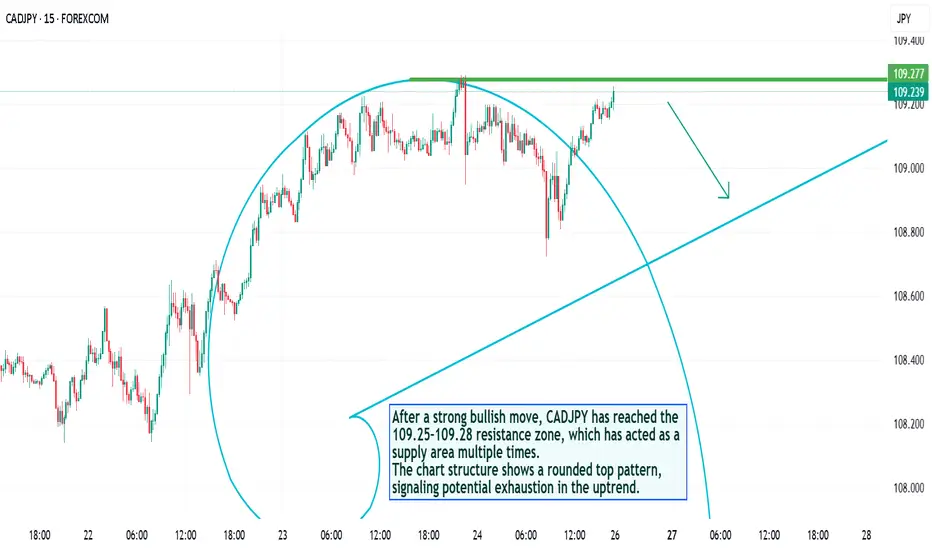
CADJPY – Rounded Top Reversal Forming at Key ResistanceAfter a strong bullish move, CADJPY has reached the 109.25–109.28 resistance zone, which has acted as a supply area multiple times.
The chart structure shows a rounded top pattern, signaling potential exhaustion in the uptrend.
💡 Technical View:
Price repeatedly rejected from 109.27 zone.
Rounded top indicates weakening buying momentum.
A descending curve formation suggests upcoming bearish correction.
Rising trendline below (around 108.80–108.60) could be the next target zone.
📉 Trade Setup (Signal):
Entry (Sell): below 109.20
Stop Loss: 109.35
Take Profit 1: 108.90
Take Profit 2: 108.60
🧭 Bias: Short-term bearish
💬 Expecting price to turn down after testing resistance. If the pair breaks above 109.35 with volume, bearish view becomes invalid.
CADJPY FREE SIGNAL|SHORT|
✅CADJPY has tapped into a premium supply zone after sweeping liquidity above previous highs. Smart money shows distribution signs with bearish displacement underway — targeting inefficiency below.
—————————
Entry: 109.230
Stop Loss: 109.610
Take Profit: 108.600
Time Frame: 2H
—————————
SHORT🔥
✅Like and subscribe to never miss a new idea!✅

CADJPY Will Go Up! Buy!
Take a look at our analysis for CADJPY.
Time Frame: 1D
Current Trend: Bullish
Sentiment: Oversold (based on 7-period RSI)
Forecast: Bullish
The market is approaching a key horizontal level 109.219.
Considering the today's price action, probabilities will be high to see a movement to 111.127.
P.S
Overbought describes a period of time where there has been a significant and consistent upward move in price over a period of time without much pullback.
Like and subscribe and comment my ideas if you enjoy them!

CADJPY Will Go Up From Support! Long!
Here is our detailed technical review for CADJPY.
Time Frame: 1D
Current Trend: Bullish
Sentiment: Oversold (based on 7-period RSI)
Forecast: Bullish
The market is testing a major horizontal structure 107.424.
Taking into consideration the structure & trend analysis, I believe that the market will reach 108.786 level soon.
P.S
We determine oversold/overbought condition with RSI indicator.
When it drops below 30 - the market is considered to be oversold.
When it bounces above 70 - the market is considered to be overbought.
Like and subscribe and comment my ideas if you enjoy them!

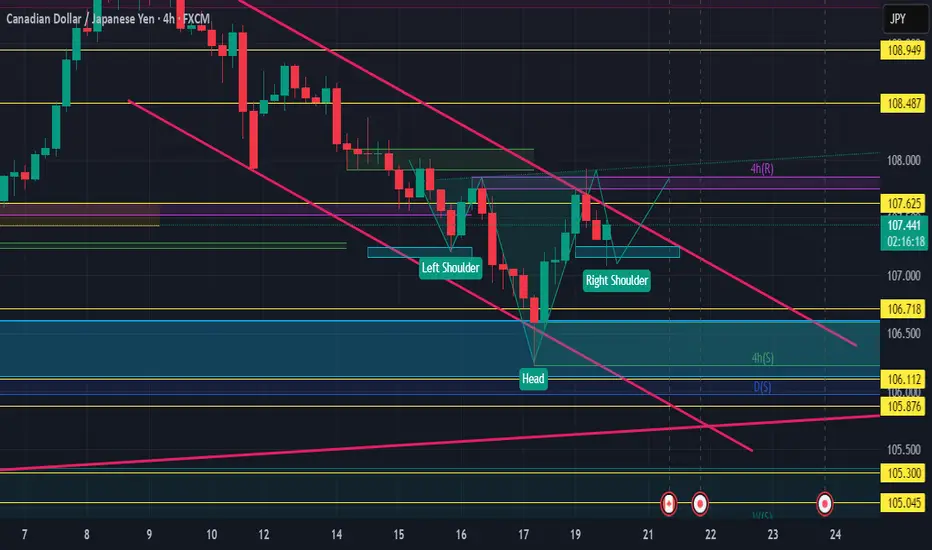
cadjpy h 4inverse head and shoulder,its possible the correction is finish,the boj dont want change the rate for the moment so nothing good for jpy