Buy Stop below 108.900 for reversal entry.
Price forming a potential **reversal zone** with lower highs.
Trade ideas

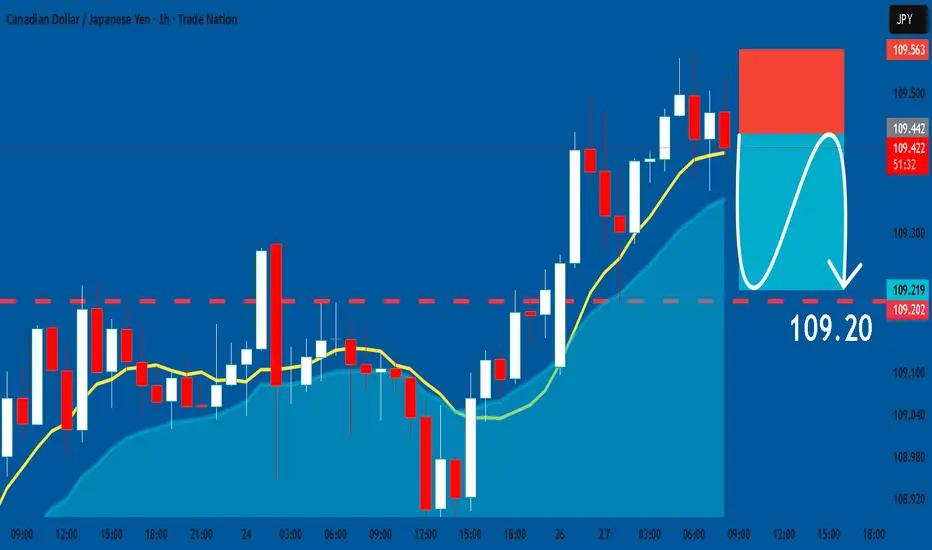
CADJPY: Bearish Continuation & Short Signal
CADJPY
- Classic bearish pattern
- Our team expects retracement
SUGGESTED TRADE:
Swing Trade
Sell CADJPY
Entry - 109.44
Stop - 109.56
Take - 109.20
Our Risk - 1%
Start protection of your profits from lower levels
Disclosure: I am part of Trade Nation's Influencer program and receive a monthly fee for using their TradingView charts in my analysis.
❤️ Please, support our work with like & comment! ❤️
CADJPY SELL!!Spotted my setup on a lower timeframe expecting last weeks fridays low to be taken out before we continue our move to the upside.

CADJPY| Bull Structure- Waiting for Deep Mitigation Higher timeframes show a strong bullish structure, refined and mapped to perfection. Our overall bias remains upward, but patience is key — we’re waiting for a deep drop into our order block zone beneath price before seeking precise entries.
On mid-timeframes, we’ve refined structure and order blocks, confirming where continuation opportunities may appear. Currently, price is dancing around premium areas, showing signs of consolidation and energy build-up.
If price decides to break significant highs to the left, we’ll follow price and monitor fresh liquidity generation, aiming to capitalize on the next leg higher. Until then, we take it step by step, letting price do its work without forcing predictions.
💡 Remember: Our job is not to predict the market, but to follow smart money and structure, letting price lead the direction.
Patience, discipline, and precision — that’s how we play the game.
Let’s go. 🔥
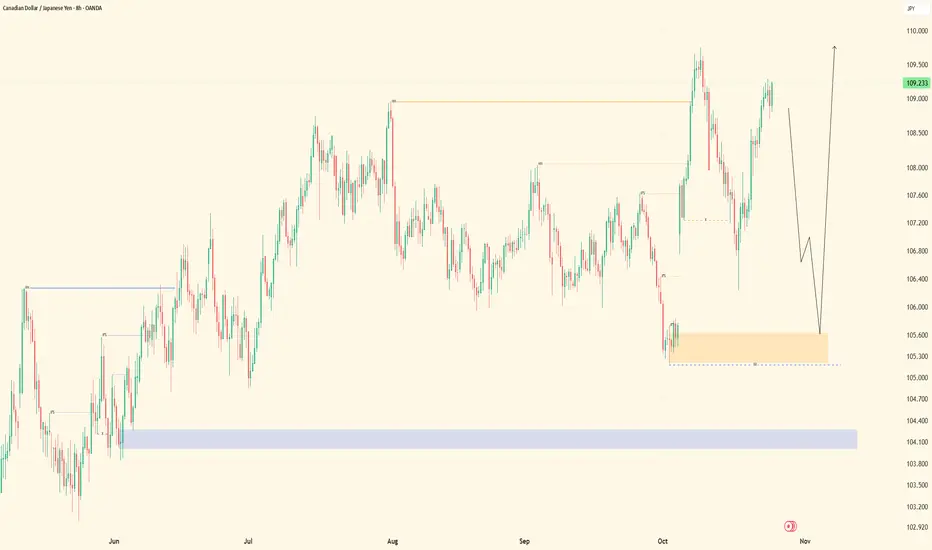
#CADJPY +2300 Pips Swing Buy With Three Major Targets| Possible?The CADJPY has nicely formed a swing bullish pattern that is confirmed. One strong entry zone lies between these prices, 109 and 106, which remain a critical level. As described in the chart, there are three targets to focus on. We strongly recommend thoroughly examining the charts and reading them carefully, as this description is brief due to the detailed chart.
Here’s what to look for:
- Look for a continued or repeated pattern to better understand the next possible move.
- Look for volume when it emerges; enter with the trend momentum.
- Don’t forget to like and comment on the chart!
Team Setupsfx_

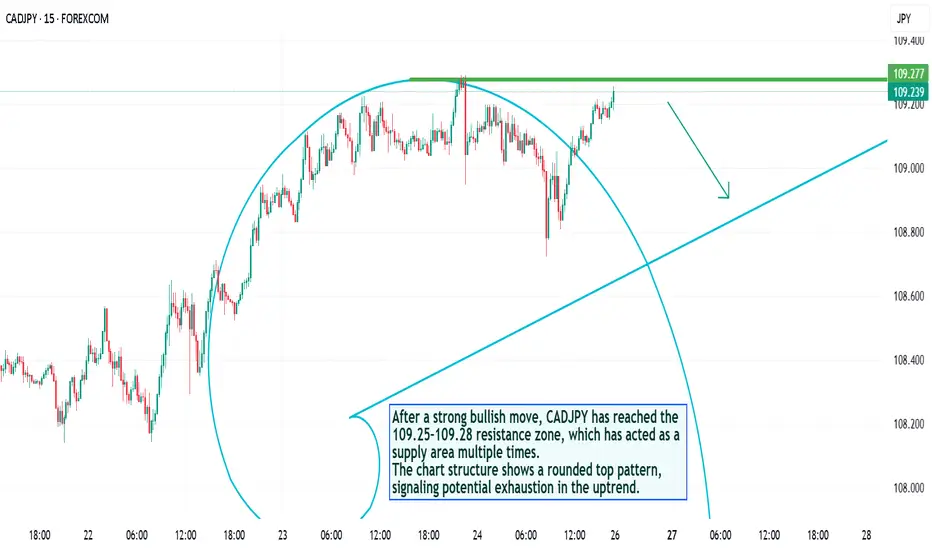
CADJPY – Rounded Top Reversal Forming at Key ResistanceAfter a strong bullish move, CADJPY has reached the 109.25–109.28 resistance zone, which has acted as a supply area multiple times.
The chart structure shows a rounded top pattern, signaling potential exhaustion in the uptrend.
💡 Technical View:
Price repeatedly rejected from 109.27 zone.
Rounded top indicates weakening buying momentum.
A descending curve formation suggests upcoming bearish correction.
Rising trendline below (around 108.80–108.60) could be the next target zone.
📉 Trade Setup (Signal):
Entry (Sell): below 109.20
Stop Loss: 109.35
Take Profit 1: 108.90
Take Profit 2: 108.60
🧭 Bias: Short-term bearish
💬 Expecting price to turn down after testing resistance. If the pair breaks above 109.35 with volume, bearish view becomes invalid.
CADJPY FREE SIGNAL|SHORT|
✅CADJPY has tapped into a premium supply zone after sweeping liquidity above previous highs. Smart money shows distribution signs with bearish displacement underway — targeting inefficiency below.
—————————
Entry: 109.230
Stop Loss: 109.610
Take Profit: 108.600
Time Frame: 2H
—————————
SHORT🔥
✅Like and subscribe to never miss a new idea!✅

CADJPY Will Go Up! Buy!
Take a look at our analysis for CADJPY.
Time Frame: 1D
Current Trend: Bullish
Sentiment: Oversold (based on 7-period RSI)
Forecast: Bullish
The market is approaching a key horizontal level 109.219.
Considering the today's price action, probabilities will be high to see a movement to 111.127.
P.S
Overbought describes a period of time where there has been a significant and consistent upward move in price over a period of time without much pullback.
Like and subscribe and comment my ideas if you enjoy them!

CADJPY Will Go Up From Support! Long!
Here is our detailed technical review for CADJPY.
Time Frame: 1D
Current Trend: Bullish
Sentiment: Oversold (based on 7-period RSI)
Forecast: Bullish
The market is testing a major horizontal structure 107.424.
Taking into consideration the structure & trend analysis, I believe that the market will reach 108.786 level soon.
P.S
We determine oversold/overbought condition with RSI indicator.
When it drops below 30 - the market is considered to be oversold.
When it bounces above 70 - the market is considered to be overbought.
Like and subscribe and comment my ideas if you enjoy them!

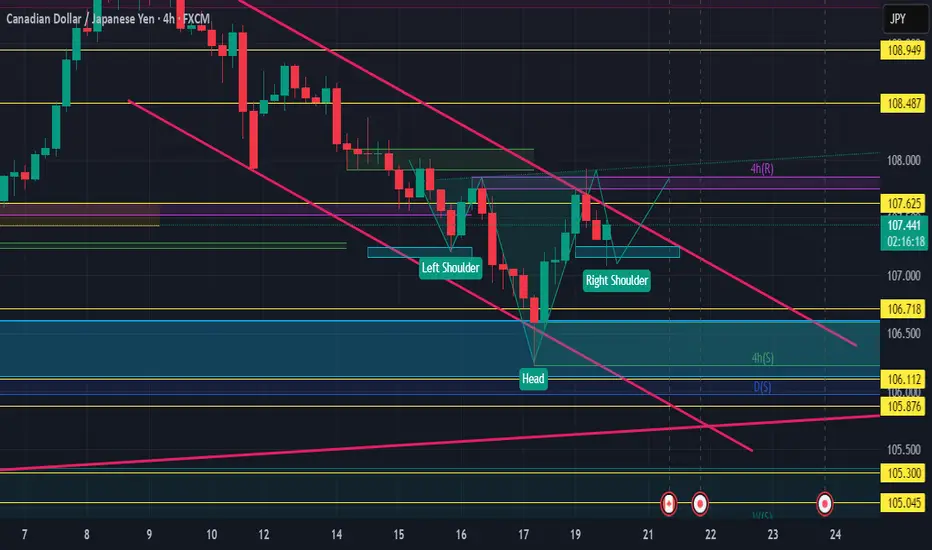
cadjpy h 4inverse head and shoulder,its possible the correction is finish,the boj dont want change the rate for the moment so nothing good for jpy
Cadjpy bearish ideaHello!
CADJPY is overbought on the 4H timeframe after a strong upward move.
Are sellers stepping in now?
We’re currently waiting for a retest of the midline — if it breaks and a candle closes below it, then it’s likely a bearish move heading down toward the next support level.
However, if CADJPY breaks above the top resistance with strong momentum, then it’s likely a continuation of the bull run.
Are you bullish or bearish on cadjpy?
CADJPY LONGMarket structure bullish on HTFs DW
Entry at both Weekly and Daily AOi
Weekly Rejection at AOi
Daily Rejection at AOi
Daily Previous Structure Point
Touching EMA Daily
Around Psychological Level 107.000
H4 Candlestick rejection
Levels 90%
REMEMBER : Trading is a Game Of Probability
: Manage Your Risk
: Be Patient
: Every Moment Is Unique
: Rinse, Wash, Repeat!
: Christ is King.

CADJPY: consider the SpreadHello traders,
I rarely trade low volume pairs, this analysis brought to you in request of a friend.
Take care and consider risk management.
Long-term trend is bearish
Mid-term is bullish
in the short term we are waiting for a break!
CAD/JPY: Bearish Breakdown to 101.92?FX:CADJPY is displaying strong bearish signals on the daily chart , with price adhering to a downward trendline established since July 11th, forming successive lower highs that underscore persistent downward momentum . The highlighted " Compress Pattern " at the lower end suggests a period of consolidation and price compression, often preceding a volatile breakout to the downside as sellers build pressure against key supports.
Entry zone between 108.86-109.75 for a short position. First target at 101.75 (risk-reward >1:2.5) , second at 101.92 (risk-reward >1:5.5) near major support zones. Set a stop loss on a close above 110.05 to guard against an upside reversal. Seek confirmation through a decisive break below the entry with elevated volume. 🌟
Fundamentally , this week we have Canada's inflation rate report, which significantly impacts CAD—recent data shows September YoY inflation at 1.9% and core at 2.6%, potentially influencing BoC policy. Additionally, Japan's trade balance report this week could introduce volatility to JPY, with the Merchandise Trade Balance Total scheduled for October 22st. 💡
📝 Trade Plan:
✅ Entry Zone: 108.86 – 109.75 (short entry near resistance/trendline)
❌ Stop Loss: Close above 110.05
🎯 Targets:
TP1: 107.75 (R:R > 1:2.5)
TP2: 101.92 (R:R > 1:5.5)
What's your perspective on this setup? Share in the comments! 👇

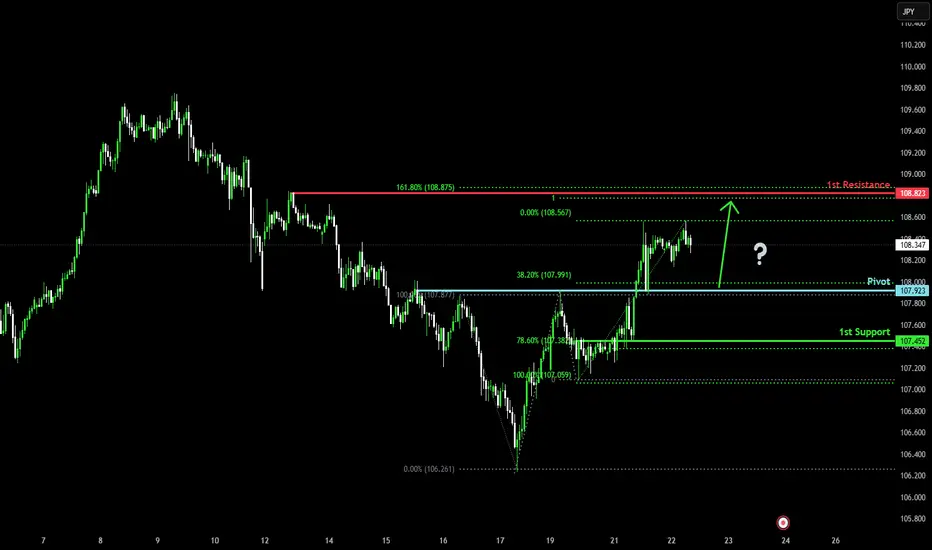
Falling towards major support?CAD/JPY is falling towards the pivot which is an overlap support and could bounce to the 1st resistance which lines up with the 161.8% Fibonacci extension and the 100% Fibonacci projection.
Pivot: 107.92
1st Support: 107.45
1st Resistance: 108.82
Disclaimer:
The above opinions given constitute general market commentary, and do not constitute the opinion or advice of IC Markets or any form of personal or investment advice.
Any opinions, news, research, analyses, prices, other information, or links to third-party sites contained on this website are provided on an "as-is" basis, are intended only to be informative, is not an advice nor a recommendation, nor research, or a record of our trading prices, or an offer of, or solicitation for a transaction in any financial instrument and thus should not be treated as such. The information provided does not involve any specific investment objectives, financial situation and needs of any specific person who may receive it. Please be aware, that past performance is not a reliable indicator of future performance and/or results. Past Performance or Forward-looking scenarios based upon the reasonable beliefs of the third-party provider are not a guarantee of future performance. Actual results may differ materially from those anticipated in forward-looking or past performance statements. IC Markets makes no representation or warranty and assumes no liability as to the accuracy or completeness of the information provided, nor any loss arising from any investment based on a recommendation, forecast or any information supplied by any third-party.
Main Watch - CADJPY 22.10.25Good morning guys!!
As you know I am in Italy until Thursday, so my morning forecast videos will be paused until I return back home. I thought I would try and keep some consistency and post up my main pair I am watching for that day with a description of what I am looking for.
Main Watch -
FX:CADJPY

CADJPY weekly Range Manipulation LONGThe CADJPY pair showed the weekly range manippulation and price went down and quickly rised above the candle forming a excellent Engulfing candle and enter on pullback for long trade.

SELL NOW CADJPY!!!!!!We still have a gap to fill down the sell side liquidity am selling due to price made a rejections off my poi zone and inside confirmation with an inducement selling and holding till the gap is filled
JOIN AND ENJOY

EURUSD AND GBPUSD TRADE BREAKDOWN WIN TRADE ON 10/21/2025 Weekly is looking good for us. Banging the pairs i analysed this week. Currently working on funding accounts to Max allocation.

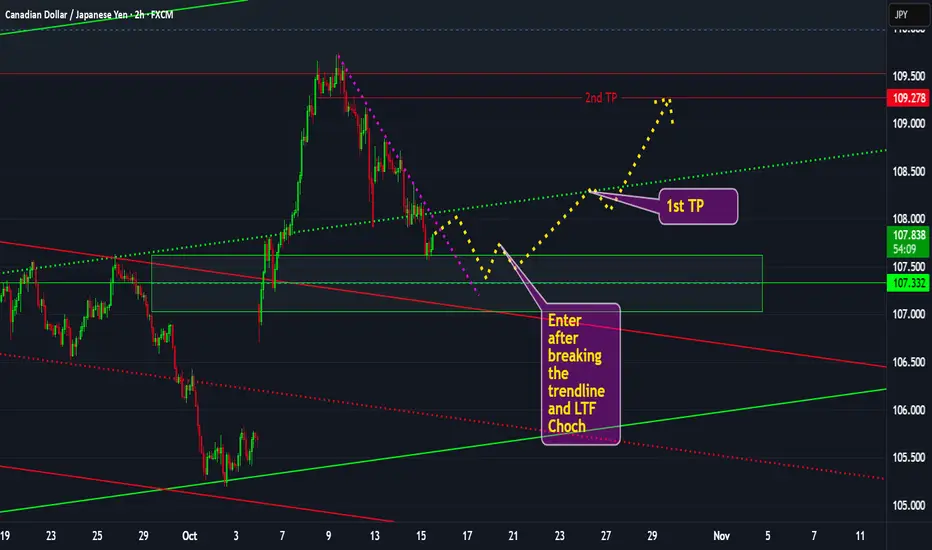
CADJPY Long Trade OANDA:CADJPY Long Trade
Entry: 107.334 - 107.414
TP-1: 107.987
TP-2: 108.520
This is good trade.
Don't overload your risk like Greedy gambler!!!
Be Disciplined Trader, risk what you can afford.
Use proper risk management.
Disclaimer: Trading is risky, only idea, not advice.

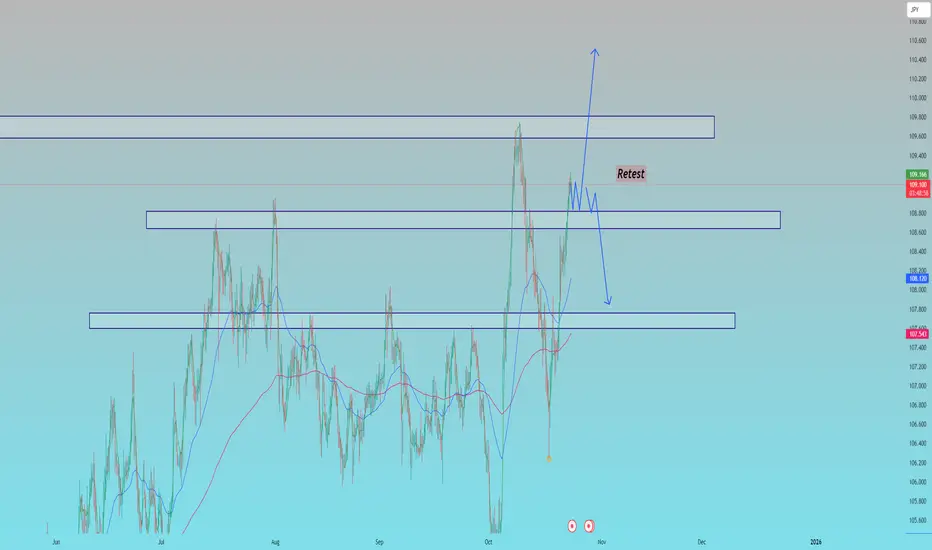
SELL STOPBearish continuation if rejection continues .
* This rejection shows that **supply above 108.300 remains active**, suggesting a possible **retest of 107.800–107.500** to build energy again.
BUY STOPBullish breakout above 108.600 resistance
the bullish leg broke short-term highs but lacked follow-through above 108.600.

CAD/JPY BEARS ARE GAINING STRENGTH|SHORT
Hello, Friends!
CAD/JPY pair is in the downtrend because previous week’s candle is red, while the price is obviously rising on the 4H timeframe. And after the retest of the resistance line above I believe we will see a move down towards the target below at 106.478 because the pair is overbought due to its proximity to the upper BB band and a bearish correction is likely.
Disclosure: I am part of Trade Nation's Influencer program and receive a monthly fee for using their TradingView charts in my analysis.
✅LIKE AND COMMENT MY IDEAS✅
