Canadian Dollar / Japanese Yen
No trades
Trade ideas

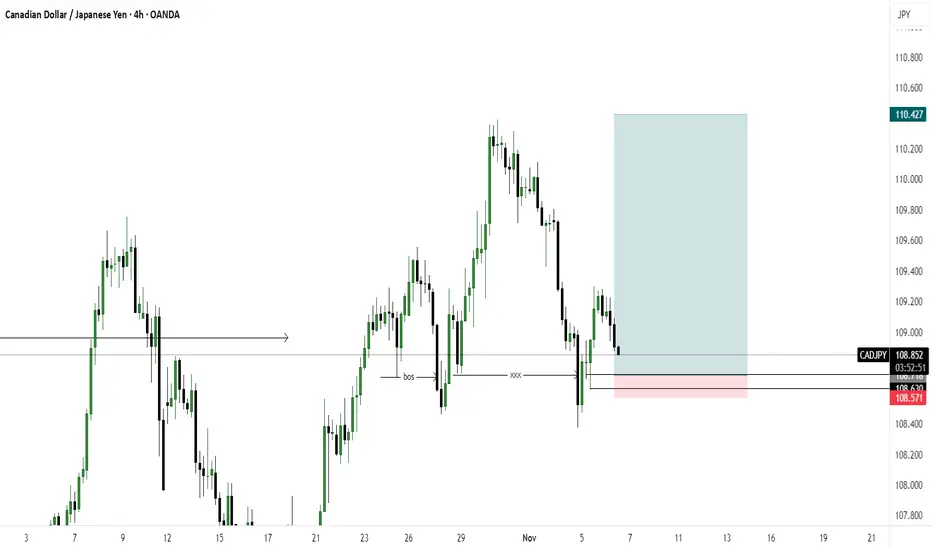
CADJPY: Short Trading Opportunity
CADJPY
- Classic bearish formation
- Our team expects fall
SUGGESTED TRADE:
Swing Trade
Sell CADJPY
Entry Level - 108.83
Sl - 108.98
Tp - 108.55
Our Risk - 1%
Start protection of your profits from lower levels
Disclosure: I am part of Trade Nation's Influencer program and receive a monthly fee for using their TradingView charts in my analysis.
❤️ Please, support our work with like & comment! ❤️

CADJPY – 4H Chart: Head & Shoulders + Trendline ConfluenceGood morning,
We’re watching a clean head and shoulders pattern forming on the 4-hour chart.
Price is testing the neckline area now — a break below and then a pullback could set up a strong short opportunity.
What makes this one even more interesting is the downtrend line drawn from previous swing highs.
If price retraces to the neckline, that could also create a third touch on the trendline, giving us double confirmation from both structure and geometry.
We’ll be watching for momentum to stay bearish and volume to rise above 85–90 during the retest to confirm VMS alignment.
Patience — wait for the break, the pullback, and the proof.
#CADJPY #ForexAcademy #VMS #HeadAndShoulders #Trendline #ForexTrading #AlignedExecution

cadjpyin h4 i see head and shoulders, after many verbal intervention from boj its possible we going to see more downtrend

Bullish move on cadjpyOANDA:CADJPY
Price shows rejection around 106.000 with closure of multiple daily candles.
we expecting to be bullish until 110.000
CADJPY Price looks to be in the process of making a head & shoulder pattern on the 4H timeframe. This is after price pulled back from the daily resistance area of 110.300.

CADJPY Massive Short! SELL!
My dear subscribers,
This is my opinion on the CADJPY next move:
The instrument tests an important psychological level 109.12
Bias - Bearish
Technical Indicators: Supper Trend gives a precise Bearish signal, while Pivot Point HL predicts price changes and potential reversals in the market.
Target - 108.83
My Stop Loss - 109.30
About Used Indicators:
On the subsequent day, trading above the pivot point is thought to indicate ongoing bullish sentiment, while trading below the pivot point indicates bearish sentiment.
Disclosure: I am part of Trade Nation's Influencer program and receive a monthly fee for using their TradingView charts in my analysis.
———————————
WISH YOU ALL LUCK

CADJPY: Stalking a Pro-Trend Long from the Demand ZoneThe instrument is in an uptrend and is showing the beginning of a potential correction on the 4H structure. If the correction continues its downward movement, long positions can be considered from the DEMAND zone in conjunction with a reaction from one of the Fib levels.
The entry condition will be the price finding acceptance above the 50%, 61.8%, or 78.6% levels upon reaching them.
If a long setup forms, the target will be the high of January 6, 2025 .
The invalidation for the long scenarios in this trade idea will be a break of the 78.6% local level . In that case, the correction will transition to the higher structure, and long positions could then be considered from the daily Fib levels and the daily order block located below.
~~~~~~~~~~~~~~~~~~~~~~~~~~~~~~~~~~~~~~~~~~~~~~~~~~~~~~~~~~~~~~~~~
The principles and conditions for forming the manipulation zones I show in this trade idea are detailed in my educational publication, which was chosen by TradingView for the "Editor's Picks" category and received a huge amount of positive feedback from this insightful trading community. To better understand the logic I've used here and the general principles of price movement in most markets from the perspective of institutional capital, I highly recommend checking out this guide if you haven't already. 👇
P.S. This is not a prediction of the exact price direction. It is a description of high-probability setups that become valid only if specific conditions are met when the price reaches the marked POI. If the conditions are not met, the setups are invalid. No setup has a 100% success rate, so if you decide to use this trade idea, always apply a stop-loss and proper risk management. Trade smart.
~~~~~~~~~~~~~~~~~~~~~~~~~~~~~~~~~~~~~~~~~~~~~~~~~~~~~~~~~~~~~~~~~
If you found this analysis helpful, support it with a Boost! 🚀
Have a question or your own view on this idea? Share it in the comments. 💬
► Follow me on TradingView for timely updates on THIS idea (entry, targets & live trade management) and not to miss my next detailed breakdown.
~~~~~~~~~~~~~~~~~~~~~~~~~~~~~~~~~~~~~~~~~~~~~~~~~~~~~~~~~~~~~~~~~

CADJPY Break outExactly like USDJPY we can see the same senarios. Wait to break the zone retest/reject it and then entry it. Good luck to everyone.

Bullish reversal off Fibonacci confluence?CAD/JPY is falling towards the pivot, which acts as a pullback support and could bounce to the pullback resistance.
Pivot: 107.92
1st Support: 106.86
1st Resistance: 109.49
Disclaimer:
The above opinions given constitute general market commentary, and do not constitute the opinion or advice of IC Markets or any form of personal or investment advice.
Any opinions, news, research, analyses, prices, other information, or links to third-party sites contained on this website are provided on an "as-is" basis, are intended only to be informative, is not an advice nor a recommendation, nor research, or a record of our trading prices, or an offer of, or solicitation for a transaction in any financial instrument and thus should not be treated as such. The information provided does not involve any specific investment objectives, financial situation and needs of any specific person who may receive it. Please be aware, that past performance is not a reliable indicator of future performance and/or results. Past Performance or Forward-looking scenarios based upon the reasonable beliefs of the third-party provider are not a guarantee of future performance. Actual results may differ materially from those anticipated in forward-looking or past performance statements. IC Markets makes no representation or warranty and assumes no liability as to the accuracy or completeness of the information provided, nor any loss arising from any investment based on a recommendation, forecast or any information supplied by any third-party.

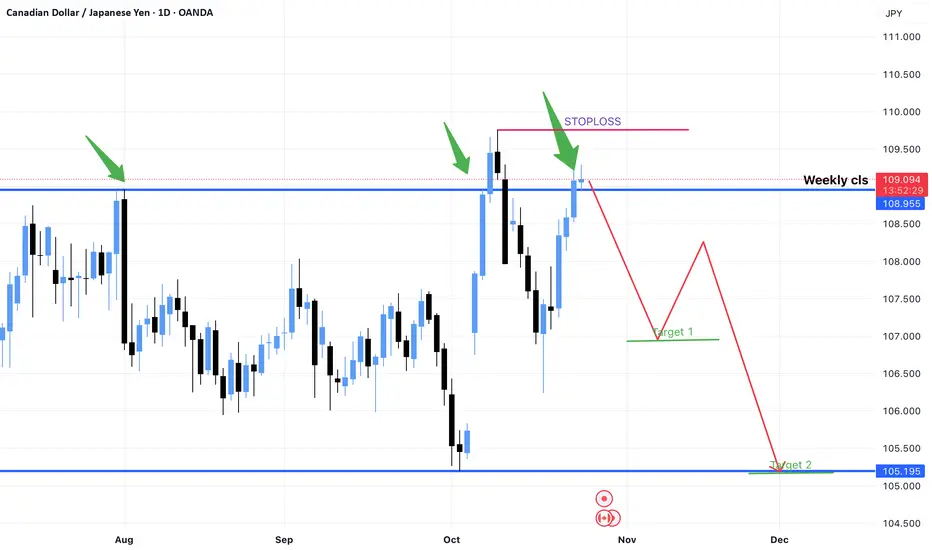
CADJPY Will Go Down!
HI,Traders !
#CADJPY made a bearish
Breakout of the rising support
And is now consolidating
Below the line so we are
Bearish biased and we will
Be expecting a further
Bearish continuation !
Comment and subscribe to help us grow !

CADJPY LONG ΩMarket structure bullish on HTFs 3
Entry at both Weekly and Daily AOi
Weekly Rejection at AOi
Daily Rejection at AOi
Previous Daily Structure Point
Around Psychological Level 109.500
Touching EMA H4
H4 Candlestick rejection
Rejection from Previous structure
TP: WHO KNOWS!
Entry 105%
REMEMBER : Trading is a Game Of Probability
: Manage Your Risk
: Be Patient
: Every Moment Is Unique
: Rinse, Wash, Repeat!
: Christ is King.

CADJPY November 2025 fundamental analysisCanadian Dollar (CAD): Economic Headwinds and Continued Easing
Bank of Canada Policy
The Bank of Canada delivered another 25 basis point rate cut at its October 29 meeting, bringing the policy rate to 2.25%. This continues an aggressive easing cycle that has seen rates reduced by 225 basis points since June 2024, from a peak of 4.50% to the current 2.75%. Markets are pricing in current easing for the October meeting despite recent data showing 60,000 employment gains and headline inflation rising to 2.4%.
Economic Challenges
The BoC's dovish stance is driven by persistent concerns about the Canadian economic outlook. The third-quarter Business Outlook Survey showed that uncertainty around trade policy continues to weigh heavily on investment and hiring plans. The "future sales" indicator dropped back into negative territory for the first time in 2025, and 63% of firms expect either unchanged or reduced workforce levels—levels historically associated with unemployment rates of 7.3% or higher.
Canada's terms of trade have deteriorated significantly, with crude oil prices falling to multi-month lows. WTI crude is trading around $59-60 per barrel, down from earlier highs, removing a key pillar of support for the loonie.
November Outlook: Bearish
The Canadian Dollar faces a challenging November. USD/CAD has moved higher to the 1.40 handle, and while some analysts expect a return to 1.38 by year-end driven primarily by USD weakness, the path may be slow with potential spikes to 1.41. The loonie is expected to underperform against most G10 currencies, given the BoC's continued easing path and Canada's vulnerability to weak energy prices.
Japanese Yen (JPY): Political Dovishness Delays Normalization
Bank of Japan: Divided Board, Delayed Tightening
The Bank of Japan kept its benchmark short-term rate unchanged at 0.5% at its October meeting, as widely expected, but the decision revealed significant internal division. The vote split 7-2, with board members Naoki Tamura and Hajime Takata advocating for a hike to 0.75%, repeating their stance from the September meeting. Takata argued that "now is the appropriate time to raise interest rates," noting that inflation has remained above the bank's target for three and a half years, while Tamura called for moving toward neutral rates.
Despite these hawkish voices, Governor Kazuo Ueda maintained a cautious approach, emphasizing that the BoJ would continue with policy normalization "once its economic projections are met" but warning that global trade policies could slow growth and hurt corporate profits. The central bank reiterated its inflation outlook, projecting core CPI at 2.7% in 2025, 1.8% in 2026, and 2.0% in 2027, while raising 2025 growth forecasts slightly to 0.7%.
Political Constraints: The Takaichi Factor
The election of Sanae Takaichi as Prime Minister in mid-October significantly altered the trajectory of BoJ policy expectations. Takaichi, known as a fiscal dove who favors expansionary fiscal measures and loose monetary policy, has complicated the path toward further tightening. Following her election, the yen depreciated more than 2% against the USD, and market expectations for an October rate hike evaporated.
The new government's support for accommodative policy creates a political constraint on the BoJ's normalization efforts, even as some policymakers argue for immediate rate hikes. US Treasury Secretary Scott Bessent has urged the BoJ to accelerate rate hikes to prevent excessive yen depreciation, adding external pressure to the central bank's considerations. Markets now assign only a 47% chance of a December rate hike, with consensus building around a delayed move to early 2026.
November Outlook: Persistent Weakness Despite Normalization Promise
The Japanese Yen carries a weak fundamental outlook for November, reflected in its trading near 154 per USD—nine-month lows and close to the 37-week low of 153.28. The currency has weakened more than 4% in October alone, making it one of the worst G10 performers. Despite some hawkish board members and the BoJ's stated intention to continue normalization, the dovish political environment and cautious central bank approach leave the yen vulnerable.
The 3.25% interest rate differential with the USD remains a key driver supporting USD/JPY carry trades, though this spread is expected to compress toward 2.5% as the Fed continues cutting while the BoJ only gradually raises rates. While this compression could eventually support the yen, the timeline remains uncertain—potentially extending into 2026 rather than materializing in November. Technical analysis suggests immediate support near 151.73 (21-day average) with the next level around 150.11 (50-day average), but resistance looms at 154.80 and potentially 155 if the BoJ remains dovish. For November, the yen is expected to remain under pressure against most major currencies, while showing marginal strength only versus the aggressively easing NZD.
Verdict
Despite its potential fundamental strength the JPY remains one of the weakest amongst the major currencies thanks mostly to continued dovish policy. And even though CAD is not really on the winners' side itself it still has the stronger foothold going into November which makes CAD/JPY a BUY .

CADJPY SHORT hello
my analysis of CADJPY pair
pivot point important zone and candle confirmation
possible short
entry now
tp 109.600

CADJPY - The Trio Retest Setup!📈CADJPY has been on a strong bullish run lately, but price is now approaching a critical confluence zone, the perfect Trio Retest Setup.
The red circle highlights the intersection of two upper trendlines (the rising channel and the short-term wedge) together with a major horizontal resistance at 111.00.
⚔️This trio intersection creates a powerful technical barrier, suggesting that the pair is overbought in the short term. From here, I’ll be looking for signs of exhaustion or reversal patterns to catch the next corrective leg down.
🔎A potential retracement could send CADJPY back toward the 106.00–105.00 support zone, which also aligns with the lower boundary of the main ascending channel.
Until the trio zone is broken decisively to the upside, the bears might step in to cool off the momentum.
⚠️ Disclaimer: This is not financial advice. Always do your own research and manage risk properly.
📊All Strategies Are Good; If Managed Properly!
~Richard Nasr

CADJPY - Bullish IdeaA through Fundametnal and technical analysis.
CAD is looking strong this week while JPY is beasrish.
Sasonality alligns with the analysis.

CADJPY short 150pipsChart looking good in general. looking for some weakness from CAD for this week as they are expected to lower rates later today.
Already in. SL an TP on the chart.
Will be updating if necessary

CADJPY Sell Opportunity (Retracement)Price will sell off and test the 50.0-61.8 Fib level before bullish trend continuation.
The retracement and test of the 50.0 fib level will create a HL.

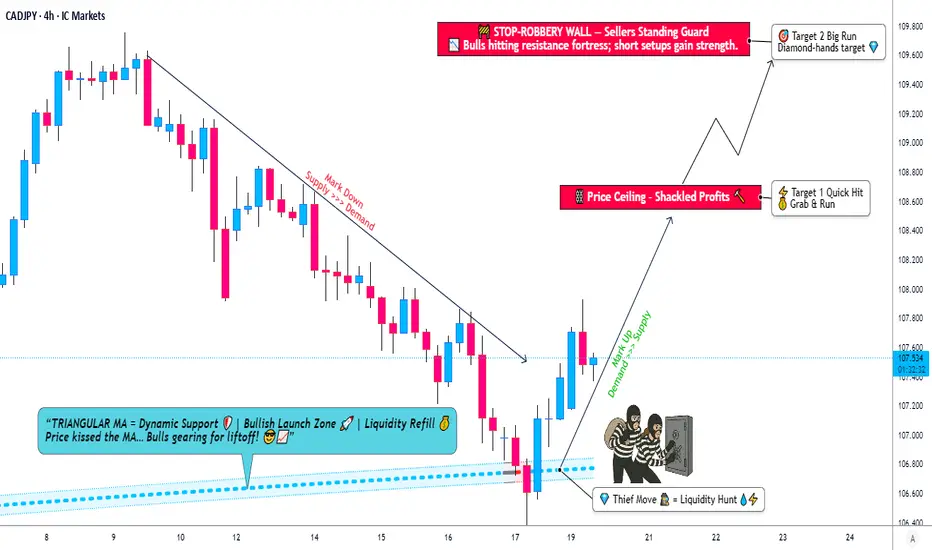
CAD/JPY Profit Plan – How to Layer Entries Professionally!🎯 CADJPY: The Maple Syrup Robbery Setup 🍁💴 | Multi-Layer Entry Zone Active!
📊 Market Overview
Asset: CAD/JPY (Canadian Dollar vs Japanese Yen)
Trade Type: Swing/Day Trade Hybrid
Strategy: "The Thief Method" - Multi-Layer Limit Order Accumulation
Bias: 🐂 BULLISH
🔍 Technical Analysis
The CADJPY pair is showing bullish confirmation following a textbook triangular moving average pullback and successful retest. The price structure suggests accumulation before the next leg up, making this an optimal zone for strategic layered entries.
Key Technical Confluences:
✅ Triangular MA pullback completed
✅ Support zone retest confirmed
✅ Higher lows forming on the daily timeframe
✅ Bullish momentum building above key support
💰 The Thief's Playbook: Multi-Layer Entry Strategy
Instead of a single entry point, this setup utilizes multiple limit orders (layering strategy) to build positions at favorable levels while managing risk.
🎯 Entry Layers (Limit Orders):
Layer 1: 106.800
Layer 2: 107.000
Layer 3: 107.250
Layer 4: 107.500
Layer 5: 107.750
Note: You can add more layers or adjust based on your account size and risk appetite. The beauty of this method is flexibility—enter at ANY price level within this range.
🛡️ Risk Management:
Stop Loss: 106.500
⚠️ Disclaimer: This is the Thief's suggested SL. However, YOU are the captain of your own ship! Set your stop loss based on YOUR risk tolerance. Trade at your own risk and never risk more than you can afford to lose.
🎯 Profit Targets:
Primary Target (TP1): 108.600 (+100 to +180 pips depending on entry)
Secondary Target (TP2): 109.600 (+190 to +280 pips depending on entry)
💡 Pro Tip: Consider scaling out at TP1 (take 50-70% profit) and letting the rest ride to TP2 with a trailing stop.
⚠️ Reminder: These are suggested targets. Lock in profits when YOU feel comfortable. It's YOUR money—make money, take money! 💸
🔗 Correlated Pairs to Watch
Keep an eye on these related pairs for confluence and broader market context:
OANDA:USDCAD 🇺🇸🇨🇦 - Inverse correlation (CAD strength indicator)
FX:USDJPY 🇺🇸🇯🇵 - Direct correlation (Yen weakness/strength gauge)
OANDA:AUDJPY 🇦🇺🇯🇵 - Similar risk-on/risk-off dynamic
OANDA:EURJPY 🇪🇺🇯🇵 - Cross-yen pair sentiment
BLACKBULL:WTI Crude Oil 🛢️ ( NYMEX:CL1! ) - Strong positive correlation with CAD (Canada = oil exporter)
Gold ( OANDA:XAUUSD ) - Safe-haven correlation with JPY (inverse to CADJPY)
Key Point: If crude oil rallies and USD/JPY shows strength, it confirms the bullish CADJPY thesis. Watch for risk sentiment—risk-on = JPY weakness = CADJPY strength! 🚀
📈 Trade Summary
ParameterValueEntry Zone106.800 - 107.750 (Multi-layer)Stop Loss106.500TP1108.600TP2109.600Risk/RewardApproximately 1:2 to 1:4+
🎬 Final Words from The Thief
Dear Ladies & Gentlemen (Thief OG's) 🎩✨,
This setup is about patience, precision, and proper position sizing. Layer in, manage risk, and let the market come to you. Remember: professional thieves don't rush—they plan, they execute, and they disappear with the bag! 💼💨
Stay sharp, stay strategic, and happy hunting! 🎯
✨ If you find value in my analysis, a 👍 and 🚀 boost is much appreciated — it helps me share more setups with the community!
#CADJPY #Forex #ForexTrading #TechnicalAnalysis #SwingTrading #DayTrading #CAD #JPY #MultiLayerEntry #TheThiefMethod #ForexSignals #TradingStrategy #RiskManagement #PriceAction #ForexSetup #CurrencyTrading #ForexCommunity #TradingView #ForexAnalysis #BullishSetup
CADJPY more bullrun?Hello!
I think we cant stop cadjpy:s bullrun.
Retest the middleline one more time and close with a engulfing or a hammercandle to take action.
Entry: 108.798
Sl: 108.631
Tp1: 109.665 RR-2.05
Tp2: 110.321 RR-4.03
Move sl to entry when tp 1 hits. go risk free.
Are you bullish on cadjpy?
Its not a financial rekommendation, its our trading idea.
Best regards/ D trading team

CADJPY BULLISH BIAS|LONG|
✅CADJPY has retested a clean demand level after a corrective pullback, showing early signs of bullish continuation. Liquidity beneath the recent low is swept, hinting a push toward the target zone. Time Frame 4H.
LONG🚀
✅Like and subscribe to never miss a new idea!✅

CADJPY manipulation key level shortCADJPY rejected from same key resistance area and price may reverse again from this area.let us see. How it plays out
:
CADJPY: Overbought Market & Pullback 🇨🇦🇯🇵
In my view, CADJPY turned too overbought and there is
a high chance that it will continue correction.
The closest support is 108.87
❤️Please, support my work with like, thank you!❤️
