U.S. Dollar Index (DXY)- Daily Timeframe Analysis 🔎 Market Structure
The Dollar Index (DXY) remains in a bearish market structure, forming consistent lower highs and lower lows. Price action is currently reacting within important Fair Value Gaps (FVGs), which often act as magnet zones for liquidity and corrective moves before resuming the primary trend.
---
🟪 Higher-Timeframe Fair Value Gaps
April FVG (Purple Box): Price previously filled part of this imbalance but failed to sustain a bullish continuation. This reinforced bearish order flow.
September FVG (Blue Box): Price recently tapped into this imbalance, where sellers may look to re-enter the market.
---
📉 Bearish Reaction Zones
99.000 – 100.000 (Red Box): A critical supply zone aligning with the upper boundary of the blue fair value gap. If price retests this region, strong rejection is likely.
Current price around 97.96 suggests the market is already reacting to this supply/FVG area.
---
🔮 Directional Bias
The broader expectation is for the DXY to form a new lower high before resuming bearish momentum.
Two possible scenarios are highlighted:
1. Rejection directly from the current FVG zone (97.9 – 99.0) → continuation lower.
2. Slight extension into the upper supply zone (99.5 – 100.0) → liquidity grab → sharp bearish reversal.
Both paths suggest a downside move targeting 96.20 and potentially lower levels.
---
📌 Summary for Traders
Bias: Bearish
Key Resistance: 99.0 – 100.0 (FVG + Supply Zone)
Key Support: 96.20 (short-term target)
Expectation: Formation of a lower high, followed by renewed selling pressure.
⚠️ Note: Always confirm with confluence (macroeconomic data, USD pairs’ correlation, and risk management rules) before entering trades.
DXY trade ideas

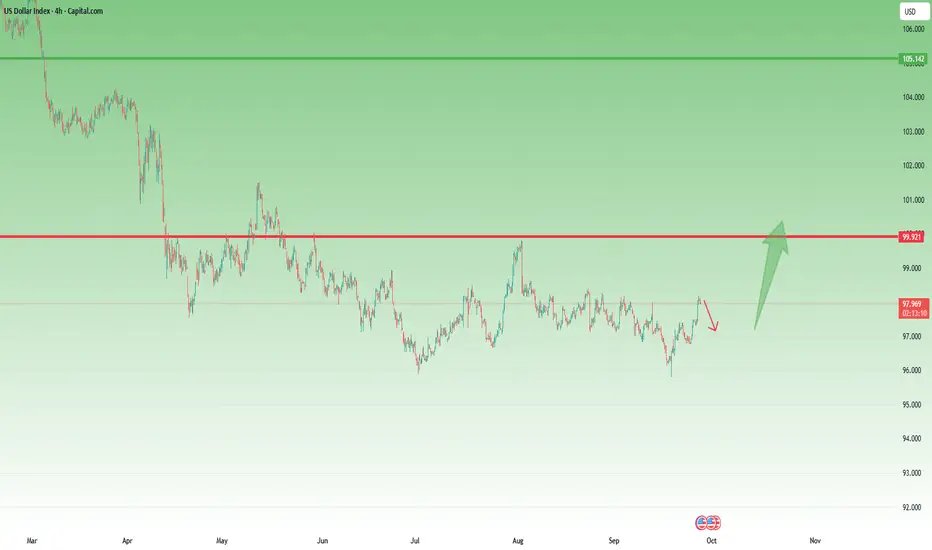
DXY – Reversal in Motion, Correction Next?In my previous DXY analysis, I highlighted that all the bad news might already be priced in for the USD, opening the door for a reversal.
That scenario is now unfolding: after making new dips, the index bounced strongly from the 95 zone and is currently trading around 98.
After such a sharp rebound, the market looks ready for a correction. This pullback phase could provide traders with attractive opportunities – especially to position short on the major USD pairs, but at better, higher prices.
Trading Plan:
• The reversal has confirmed, but I expect a correction before continuation.
• I’m looking for retracements to offer entry levels for USD shorts via majors.
• As always, flexibility is key – monitor price action closely to time entries correctly.
The market has started to shift – now it’s about waiting for the correction to align risk and reward properly. 🚀
DXY to come lower then go long Clear demand zone labelled.
Clear potential FVGs need filling
Clear liquidty to target

$DXY longsFor next week I’ll be focusing on dollar longs since we got a 4H swing trend BOS and a lot of descending highs left open.
Favoring positions on #EURUSD and #GBPUSD.
Will keep you updated. #FOREX

DXY (US Dollar Index) 2H chart.DXY (US Dollar Index) 2H chart, you can see my drawn a breakout setup with targets marked.
Here’s the breakdown:
Current price: ~97.42
Trendline breakout setup is shown, with bullish continuation in mind.
First target point is marked around 98.00
Second target point is marked around 98.60
✅ So the bullish targets are:
TP1: 98.00
TP2: 98.60

DXY ( Doller Index ) I expect to see the dollar index begin to rise from these areas. The wave will take months, perhaps even two years, to reach the upward target

DXYDXY is in correction and can give us some more sideways before any push up.
Disclosure: We are part of Trade Nation's Influencer program and receive a monthly fee for using their TradingView charts in our analysis.

DXYThe U.S. Dollar Index (DXY) maintains a bearish bias after breaking key support levels. Markets are pricing in a less aggressive Fed, mixed economic data, and rising risk appetite, all of which limit demand for the USD as a safe haven.
🔑 Key Factors
Monetary policy: The Fed no longer shows the hawkish tone of 2022–2023; rate cuts are expected in the coming quarters, reducing the dollar’s appeal.
Macro data: Inflation is more under control and signs of economic cooling → fewer arguments to keep rates high.
Market sentiment: Flows into stocks and crypto reflect greater risk appetite, reducing USD demand.
External factors: The ECB and BoJ are showing signs of tightening → the interest rate differential with the U.S. narrows, cutting the dollar’s advantage.

DXY - FROM THE WEEKLY CHART TO THE H4 CHART - WHAT TO EXPECTThe DXY Index has been going up since Jerome Powell speech after FOMC on 17 September 2025 and has continued its bullish trend since then, looking at the weekly chart this may be headind to an important resistance in the 101.395 area if the index succesfully breaks the 100.040 level of resistance, data will dictate its next move
I expect the index to test the 97.700 - 97.500 level of support early in the week and raise gradually to 100.040
Once there we have the following options:
- Poor usd data = selloff of the index on the way to the previous lows
- Strong usd data = break of the 100.040 level of resistance and the index reaching the weekly resistance 101.395
BE REACTIVE AND NOT PREDICTIVE

DXY--Big picture--To see the big picture I analysed the instrument in 3M time period
--I will add a seperate lower time frame chart

DxyI want to see dxy to drop in price till mid of this week, in order to activate sell bias in most of Usd major pair and some cryptos

DXY--General outlook details--This daily chart is for the current position.
--Check for the big picture chart I add below.

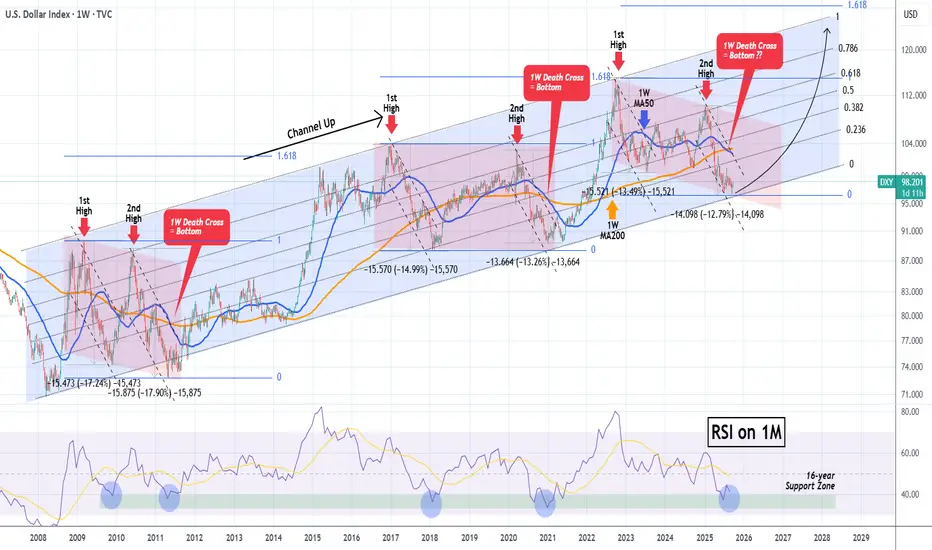
DXY Is it finally time for the Dollar to shine?The U.S. Dollar index (DXY) has been trading within a Channel Up since the March 2008 bottom during the U.S. Housing Crisis. This pattern has been showing incredible symmetry, having clear correction phases (red Channels) followed by bullish phases, where the price rallied to the 1.618 Fibonacci extension.
Right now the price has almost hit the bottom of this multi-year Channel Up, while at the same time making a new (2nd) bottom for the 2nd Bearish Leg of the (red) correction phase.
With the 1M RSI having already touched its 16-year Support Zone, which has provided the most optimal Buy Signals throughout this pattern, we expect the Dollar Index to start rising aggressively in the long-term, targeting at lest 120.000 on its way to the 1.618 Fib ext.
-------------------------------------------------------------------------------
** Please LIKE 👍, FOLLOW ✅, SHARE 🙌 and COMMENT ✍ if you enjoy this idea! Also share your ideas and charts in the comments section below! This is best way to keep it relevant, support us, keep the content here free and allow the idea to reach as many people as possible. **
-------------------------------------------------------------------------------
💸💸💸💸💸💸
👇 👇 👇 👇 👇 👇
GBPUSD 4hr Long SetupGBPUSD 4hr Long Setup with DXY confirmation potential swing set up to hold if we see dxy holding the highs without recovering furhter.

DXYEVERYTHING is in the chart, I believe it is moving to the upside as the Bearish momentum comes to an end.

Dollar Index Holds Firm on Fed CautionFundamental approach:
- DXY edged higher this week amid firmer US data and cautious Fed rhetoric that tempered aggressive easing bets. Risk sentiment was mixed, with markets awaiting core PCE for policy cues, supporting the dollar on rate differentials and data resilience.
- Stronger jobless claims and an upgraded Q2 GDP print underpinned the greenback, while Fed speakers highlighted divisions over the pace of additional cuts, limiting the index's downside.
- DXY could stabilize or firm if core PCE surprises, while a soft print may rekindle cut expectations and weigh on the dollar.
Technical approach:
- DXY broke the descending trendline and retested the key resistance at around 98.60. The index is around EMA21, and it is awaiting an apparent breakout to determine the upcoming trend.
- If DXY breaks above EMA21 and key resistance at 98.60, the index may retest the following resistance at 100.
- On the contrary, failing to close above 98.60 may lead the index to retest EMA78 or the following support at around 97.15.
Analysis by: Dat Tong, Senior Financial Markets Strategist at Exness

Dollar Faces Major Golden Ratio CorrectionRecent GDP data puts the dollar into uptrend(rise from 3.3% to 3.8% ) reaching around 98.7 and hit a Major Fibonacci 0.618 Correction and Multi-month highs.
The Dollar can be expected to correct at the 0.5 ratio (around 97 ) of the recent trend along with the trendline. If the dollar sentiment is to follow the rate cuts, we will see the dollar to the downside and stocks, crypto and commodities to the upside.
The Fed has recently announce a possibility of two more rate cuts happening this year Q4 of 2025. The cut is stays at 25 bps rather than the expected 50 bps . Some investors say it is not enough to bring positivity to the market.
Traders, what are your thoughts?

Dxy Clear Trade - Patience is a keyEverything is on the chart
Head and shoulder when we flip the chart
Goodluck

DXYThe Dollar Index (DXY) is currently rising within a flat corrective structure. Wave C may complete around the 100 zone, which serves as a key resistance level. Once this area is reached, a strong bearish reversal could follow. Traders should be cautious of potential exhaustion in the upward move and prepare for selling opportunities once confirmation appears.

US Dollar: Hold Off On Selling The USD! Higher Prices Ahead?Welcome back to the Weekly Forex Forecast for the week of Sept 22 - 26th.
In this video, we will analyze the following FX market: USD Dollar
The USD recovered last Friday after the FED cut the rate .25 basis points. The USD was also supported by higher T-note yields.
What's next?
Although price swept the Swing Low last week, it recovered, trading back up into the consolidation. There is a bullish tone to this movement, and a manipulative one as well. The sell side LQ was taken, followed by a quick recovery.
The highlighted bullish FVG indicates bullish order flow.
There is a potential iFVG just above the +FVG. Monitor it to see if price will respect it as support. Should it hold, look to long the USD.
Wait and react. Do not predict.
Enjoy!
May profits be upon you.
Leave any questions or comments in the comment section.
I appreciate any feedback from my viewers!
Disclaimer:
I do not provide personal investment advice and I am not a qualified licensed investment advisor.
All information found here, including any ideas, opinions, views, predictions, forecasts, commentaries, suggestions, expressed or implied herein, are for informational, entertainment or educational purposes only and should not be construed as personal investment advice. While the information provided is believed to be accurate, it may include errors or inaccuracies.
I will not and cannot be held liable for any actions you take as a result of anything you read here.
Conduct your own due diligence, or consult a licensed financial advisor or broker before making any and all investment decisions. Any investments, trades, speculations, or decisions made on the basis of any information found on this channel, expressed or implied herein, are committed at your own risk, financial or otherwise.

MIXED SIGNALS ON THE DOLLAR INDEXThe dollar index has beautifully retraced 100% of a bearish Butterfly pattern that was identified between July 1st and August 13th 2025, hitting the monthly support target of 95.911. There has been a strong bounce from this support zone into the weekly closing range.
What we currently have now is also a bullish Butterfly pattern on the daily chart and the bounce from the support zone has retraced to exactly the 0.382 fib level (97.336). The weekly hammer candle suggests that bulls will attempt to reach the 0.5 fib level, however lower time frames shows that the bulls are losing their strength. As such, I am not expecting DXY to continue grinding up next week without a major pullback to retest the weekly candle wicks. Basically expecting a lot of volatility in both directions.
I thank you for checking out my publication and I wish you a successful trading week. Cheers!!

DXY: Bulls Are Winning! Long!
My dear friends,
Today we will analyse DXY together☺️
The recent price action suggests a shift in mid-term momentum. A break above the current local range around 97.541 will confirm the new direction upwards with the target being the next key level of 97.640 and a reconvened placement of a stop-loss beyond the range.
❤️Sending you lots of Love and Hugs❤️

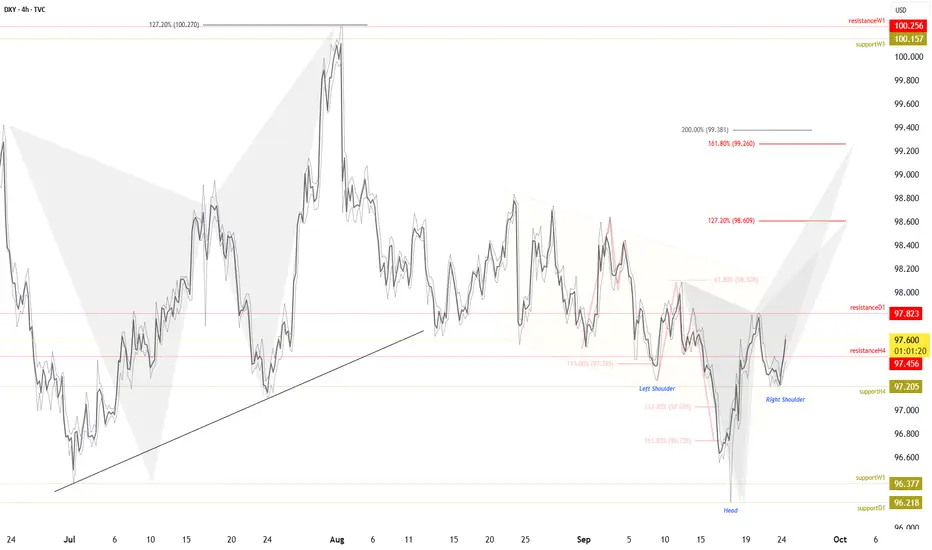
DXY – Potential Inverted Head & Shoulders FormationTVC:DXY
The DXY is currently consolidating in a way that suggests the development of an inverted head and shoulders pattern. We have support distributed between $96.37 and $96.21 , creating a potential base for this pattern. On the upside, the recent breakout through $97.45 highlights bullish intent, with the next critical level being the daily fractal resistance at $97.82 , which acts as the neckline .
Breakout Implications
A confirmed break and close above $97.82 would validate the pattern and shift momentum toward higher targets. If this scenario plays out, extension levels become the next logical zones of interest:
127% Fibonacci extension: $98.60 - bearish butterfly pattern
161.8% Fibonacci extension: $99.26 - bearish crab pattern
200% Fibonacci extension: $99.38 - H&S default target
Risk Factors & Harmonic Patterns
While the bullish case is clear above $97.82 , caution is warranted. Harmonic patterns may begin to take shape around $98.60 and $99.26 , which often serve as areas of exhaustion or reversal. These zones could lead to temporary pullbacks, and in a broader context, may even reassert the prevailing downtrend seen in recent months.
Key Takeaway
The confirmation or rejection of the $97.82 neckline will be pivotal in defining the next directional phase for the DXY. We should monitor price behavior carefully at each Fibonacci extension, balancing the potential for continuation against the risk of harmonic-driven reversals.
Safe Trades,
André Cardoso