DXY Bullish Channel Setup with 1:4.5 RRR (Entry 97.50 → Target 9Chart Analysis
Trend:
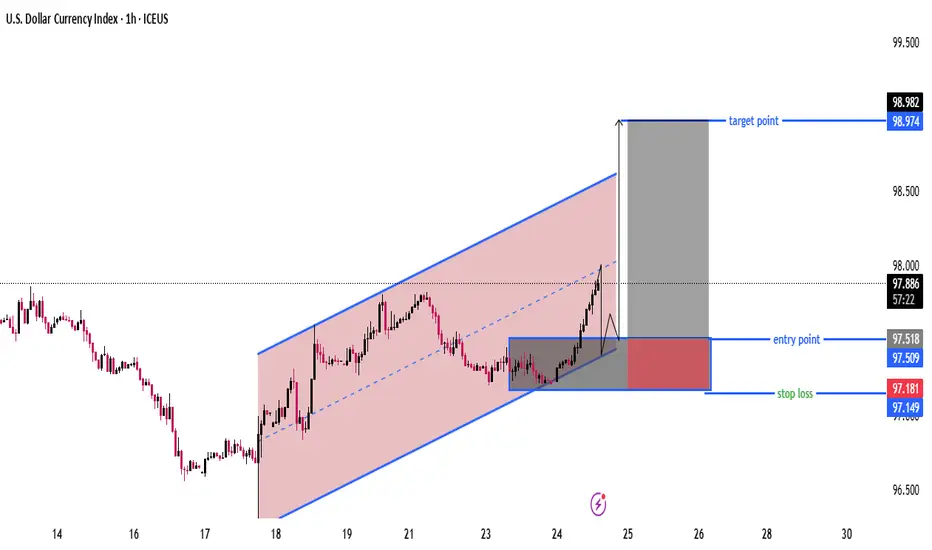
Price is moving inside a rising parallel channel (marked in red with blue borders).
Currently near the mid-to-upper side of the channel.
Setup Highlighted:
Entry Point: Around 97.50 – 97.52 (support zone).
Stop Loss: Around 97.15 – 97.18 (below support and channel bottom).
Target Point: Around 98.97 – 98.98 (near channel top).
Risk-to-Reward Ratio (RRR):
Risk: ~0.33 points (97.50 → 97.18).
Reward: ~1.46 points (97.50 → 98.98).
RRR ≈ 1:4.5, which is a strong setup.
Price Action:
The chart suggests a retest of support (97.50 area) before a bullish continuation.
If buyers hold this level, upward momentum could push toward the 98.90–99.00 zone.
Invalidation:
A breakdown below 97.15 would invalidate the long setup and may push price toward 96.80 – 96.50 support levels.
📌 Summary
Bias: Bullish (as long as price holds above 97.15).
Plan: Wait for a pullback to the entry zone (97.50) for confirmation.
Target: 98.90 – 99.00.
Stop Loss: Below 97.15.
Strong RRR trade idea within the bullish channel.
DXY trade ideas
DXY DOLLAR INDEX What is the DXY?
The DXY (U.S. Dollar Index) is a weighted index that measures the value of the United States dollar (USD) relative to a basket of six major foreign currencies: the euro (EUR), Japanese yen (JPY), British pound (GBP), Canadian dollar (CAD), Swedish krona (SEK), and Swiss franc (CHF). The euro has the largest weight in the index, around 57.6%, making it the most influential currency in the DXY.
The DXY provides a broad gauge of the USD’s international value and is frequently used by traders and analysts to assess dollar strength.
Correlation of DXY with US10Y (U.S. 10-Year Treasury Yield)
The U.S. 10-year Treasury yield (US10Y) and the DXY often have a positive correlation.
Higher US10Y usually signals stronger U.S. economic growth and/or expectations of higher Federal Reserve interest rates, making U.S. Treasury securities more attractive to investors. This leads to increased demand for USD, causing the DXY to strengthen.
Rising yields increase the return on dollar-denominated assets, attracting capital inflows and boosting the dollar’s value relative to other currencies.
Conversely, when US10Y falls, it often indicates weaker economic sentiment or looser monetary policy, which tends to weaken the dollar and lower the DXY.
Strength of the U.S. Dollar and DXY Relationship
The DXY directly reflects the strength or weakness of the U.S. dollar in the global forex market.
A rising DXY means the USD is strengthening against other major currencies, indicating increased purchasing power and greater global dollar demand.
A falling DXY implies the USD is weakening, reducing its relative value versus other currencies.
The DXY is impacted by the interest rate differentials, economic growth expectations, geopolitical events, and risk sentiment affecting capital flows in and out of the U.S.
The DXY is a key barometer for the dollar’s relative strength, and its movement often aligns with changes in US10Y due to the economic and yield attractiveness
IF THE INDEX CORRECTS IN THIS WEEKLY CANDLE EXPECT A LONG POSITION .
WATCH EURUSD,AUDUSD,GBPUSD,USDJPY.
#DXY #US10Y

dxy xau opportunity dxy looking like a long and xau will short itself to the shitter fyi thats about it cuh look at the bearish fvg and break of trend neckline that is showed with my painting skills

US Dollar Flexes, Look For on 99.05Sunday War Map –
A weekly candle this strong leaves a mark. The dollar printed a 96.77 low to 98.18 high—a full-bodied bullish bar that demands respect.
Macro
This week is stacked with U.S. data that can shake the pullback narrative:
Tue 30 Sep – JOLTS & Consumer Confidence: first look at hiring demand and household mood.
Wed 1 Oct – ISM Manufacturing PMI: factory pulse and price pressures.
Thu 2 Oct – Durable Goods & Trade Data: capital-expenditure clues.
Fri 3 Oct – Non-Farm Payrolls & Hourly Earnings: the heavyweight. A hot jobs print could delay the December Fed-cut story (futures still price ~70% odds).
Technical Targets
Expect an early-week pullback as traders digest that massive weekly bar.
Two liquidity pools we’ve tracked for months were cleared last week; two upside targets still in play 98.2 and 98.3 remain before the chart reaches a true “bearish-range discount.”
Keep eyes on the 99.05 volume node—a well-defined supply zone where cross-market reactions (EUR, gold, crypto) could spike.
The dollar controls the tempo. Wait for the market to come to your levels; don’t chase the last candle.

USD Sell the Rumor, Buy the NewsUSD set a fresh three-year low on the Fed's rate cut announcement last week. Since then, however, bears have taken a back seat and bulls have chewed through several short-term resistance levels. This highlights just how one-sided that move was in the earlier part of the year and for q3, it's been a build into a falling wedge formation which is often approached with aim of bullish reversal.
This sets the stage for a test of the 99 level, which is confluent with both a 61.8% Fibonacci retracement of the 2021-2022 major move - and the resistance side of that formation.
Notably, this resembles last year's move, when the USD set a fresh low on the Fed's first rate cut announcement of the year only for bears to be stalled thereafter. It wasn't until Q4 that USD bulls were able to take over but when they were - they drove an aggressive move into the end of the year.
In that scenario, there was also a similar move in Treasury yields as rates jumped even as the Fed was cutting overnight rates - and the rationale behind that was that a Fed cutting into a high inflation backdrop simply boosted long-run inflation expectations, which further erodes fixed yields. That can drive capital from bonds and possibly even into stocks, but more importantly for traders, that's what helped to boost the Greenback in Q4 of last year even as the Fed was cutting. - js

DXY at a Critical Juncture — What’s the Fed’s Next MoveHey Guys,
I’ve put together a swing-style analysis for the DXY.
This one’s been highly requested — my followers are valuable to me, and I never turn them down.
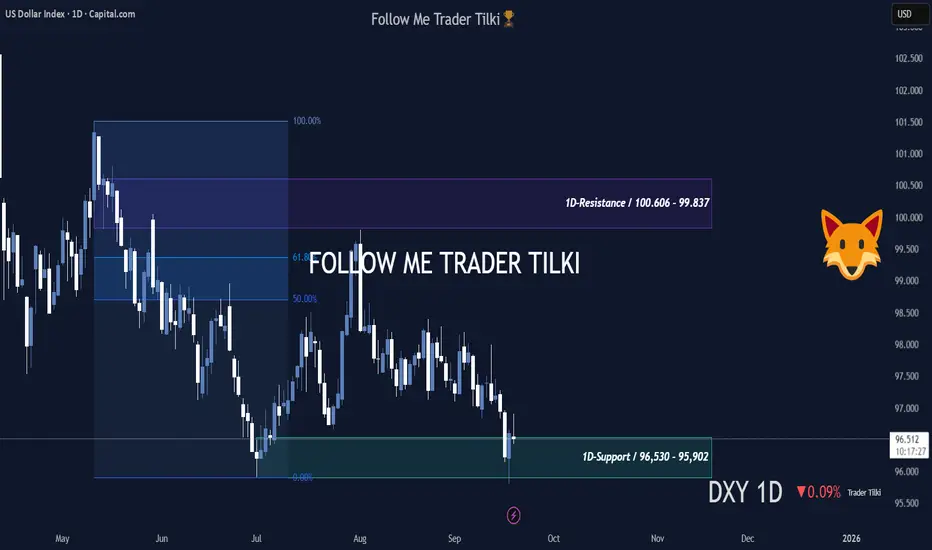
DXY Daily Levels:
- Resistance: 100.606 – 99.837
- Support: 96.530 – 95.902
From a fundamental perspective, the U.S. Dollar Index is currently dropping due to Fed policies.
No steps are being taken to push the dollar higher.
Because of this, investors are choosing gold as a safe haven instead of buying dollars.
Gold keeps hitting new ATHs, and naturally, the dollar index is sliding.
Unless the Fed takes action to support the dollar, this decline will continue.
In short, the drop in the dollar is entirely due to the policies implemented by the Fed Chair.
Remember — DXY isn’t heavily influenced by technical analysis; it’s driven by Fed policy.
That said, since the index has fallen so much, I believe we might see some steps taken in the coming months to lift the dollar.
I’ll be sharing updates right here.📢
Once support or resistance levels are broken, I’ll post new insights immediately.
Every like from you is my biggest motivation to keep sharing these analyses.
Thanks to all my friends who support me — you’re the best. ❤️
Dollar Index Holding Up But GBPUSD Might Change That...Dollar = Relative Game, Not Absolute
Dollar Index isn’t just the USD — it’s USD vs a basket (mainly EUR, JPY, GBP).
If the Fed cuts but ECB, BOE, and BOJ are also leaning dovish, the relative advantage doesn’t change; USD stays steady.
The dollar has been consolidating because macro signals are mixed (Fed easing vs US resilience, inflation uncertainty, global growth divergence), and the euro/yen/GBP balance out.
The market is waiting for a clear catalyst — usually a Fed decision, inflation report, or geopolitical shock to break the range.

U.S. Dollar Index (DXY) – Bullish Pullback & Long Setup (2H Char1. Price Action & Structure
The chart shows a bullish channel (red shaded area) where price has been making higher highs and higher lows since around September 18.
Price recently reached the upper trendline of the channel and is now pulling back toward the middle/lower zone.
2. Key Levels
Support Zone: Around 97.575 – 97.257 (blue labels).
This is where the chart suggests a potential buy/long entry.
The gray box marks the area where price is expected to reverse to the upside.
Stop-Loss Level: Slightly below 97.257, around 97.238 (red level).
If price breaks below this, it would invalidate the bullish setup.
Target Point: 98.799 – 98.805
This is the projected move upward, shown with the big arrow.
3. Expected Scenario
The zigzag line indicates that price may dip into the support zone, consolidate, and then bounce back up strongly toward the target point.
This is a long (buy) trade setup with a favorable risk-to-reward ratio since the potential reward is much bigger than the stop loss risk.
4. Risk–Reward Ratio
Risk (downside): Around 0.3 points (from 97.575 entry to 97.238 stop).
Reward (upside): Around 1.2 points (from 97.575 entry to 98.799 target).
That’s roughly 4:1 R:R — a very good trade setup if price respects the support zone.
Summary
✅ Bullish Bias – Price is in an uptrend channel.
📉 Buy Zone: 97.575 – 97.257
📊 Target: 98.799 – 98.805
🛑 Stop Loss: Below 97.238
🎯 Expectation: Short-term dip followed by a strong bullish rally.

DXYDXY Bearish Outlook
COT positioning confirms sellers are in control, showing bearish sentiment.
Market structure also points lower with lower highs and lower lows.
As long as this structure holds, bias remains bearish.

DXY ANALYSIS 1H , Trade Idea (For Study Purposes Only)
Sell Zone: 97.45 – 97.60
Target: 97.05 – 97.00
Stop Loss: Above 97.65
RR: ~1:2
---

DXY Breakout Trade Setup – Bullish Channel & High R:R OpportunitChart Overview:
Instrument: U.S. Dollar Currency Index (DXY)
Timeframe: 1 Hour (1H)
Current Price: 98.371
Analysis Date: September 26, 2025
🔍 Technical Structure:
1. Bullish Channel:
A clear ascending channel is drawn, indicating a strong short-term uptrend.
Price action has been respecting the channel well, moving between the upper and lower trendlines.
A bullish breakout is either anticipated or just confirmed above the channel.
🟦 Trade Setup (Long Position):
✅ Entry Point:
Price: 98.267 (blue horizontal line labeled "Entry Point")
This is slightly below the current price (98.371), suggesting an entry on a slight pullback after breakout.
🛑 Stop Loss:
Price: 97.986 (also marked 97.982 on the lower blue line)
Located below a recent support zone and below the breakout structure.
This gives a safety buffer if the breakout fails.
🎯 Target Point (Take Profit):
Price: 99.676
This is based on the measured move from the height of the channel, projected upward from the breakout point.
📐 Risk-to-Reward Ratio (RRR):
Very favorable; visually it appears to be around 4:1 or higher.
Small stop loss area (red box) relative to the large target area (green box).
High RRR makes this setup attractive for risk-managed traders.
🔎 Additional Observations:
Trend: Strong bullish momentum leading into the breakout.
Volume / Confirmation: Not shown on the chart, but ideally you’d want volume confirmation for the breakout.
Timing: Entry and confirmation should align with break and retest of the channel top.
✅ Summary of the Trade Plan:
Component Value
Entry 98.267
Stop Loss 97.986
Take Profit 99.676
Risk-Reward ~4:1
Trade Type Long (Buy)
Strategy Breakout + Retest
⚠️ Important Notes:
Wait for confirmation (like a bullish candle close above the channel or successful retest).
Be aware of macroeconomic news that can affect DXY (e.g., Fed announcements, interest rate decisions, inflation data).
Use position sizing appropriate to your risk tolerance.


Dollar short-term BULLISH until proven otherwiseCAPITALCOM:DXY
After a deep liquidity sweep down to ~95.80 followed by a sharp buying response, a string of higher lows, and a higher high into the 97.39–97.78 area. Price is currently pausing just above the shaded Daily BPR.
That sequence (sweep → big rejection → higher low → higher high) is the technical basis for a bullish bias while price stays above the recent higher-low area.
Watching development for now...

Dollar Finds Support Ahead of U.S. Data and GDP; SNB Leaves RateDollar Finds Support Ahead of U.S. Data and GDP; SNB Leaves Rates Unchanged
The U.S. dollar stayed strong this week as traders waited for important U.S. jobless claims and GDP numbers that could guide the Federal Reserve’s next decision.
On Thursday morning, the Dollar Index traded near 97.55 after touching a two-week high on Wednesday. The move came after Fed Chair Jerome Powell said the central bank faces a “challenging situation” as it tries to balance high inflation with a weak job market.
Key U.S. Data in Focus
Jobless claims due later today are expected to show around 230k, suggesting the labor market is still strong.
GDP figures and PCE inflation data later this week will give more signals about economic strength.
Several Fed officials are also speaking this week, which could move markets.
Analysts say if jobless claims remain low, the dollar could get stronger because it means the Fed may delay more rate cuts.
Europe and Switzerland
In Europe, EUR/USD stayed flat near 1.1738. Analysts warn a fall below 1.1725 could push the pair down toward 1.1660.
The Swiss National Bank (SNB) kept its interest rate at zero, stopping a series of seven straight cuts. After the news, USD/CHF edged up to 0.7958.
Asia Updates
USD/JPY slipped 0.1% to 148.69 after strong gains the previous day.
BoJ minutes showed some members want to consider raising rates in the future.
AUD/USD rose 0.2% to 0.6592 after Australian inflation came in higher than expected.
Outlook
The dollar remains supported as traders balance U.S. economic strength with Fed policy expectations. For now, the focus is on today’s jobless claims and GDP data, which could set the next move for the dollar.
✍️ By Md Golam Rabbani
DOLLAR INDEX (DXY): Overbought Market & Pullback
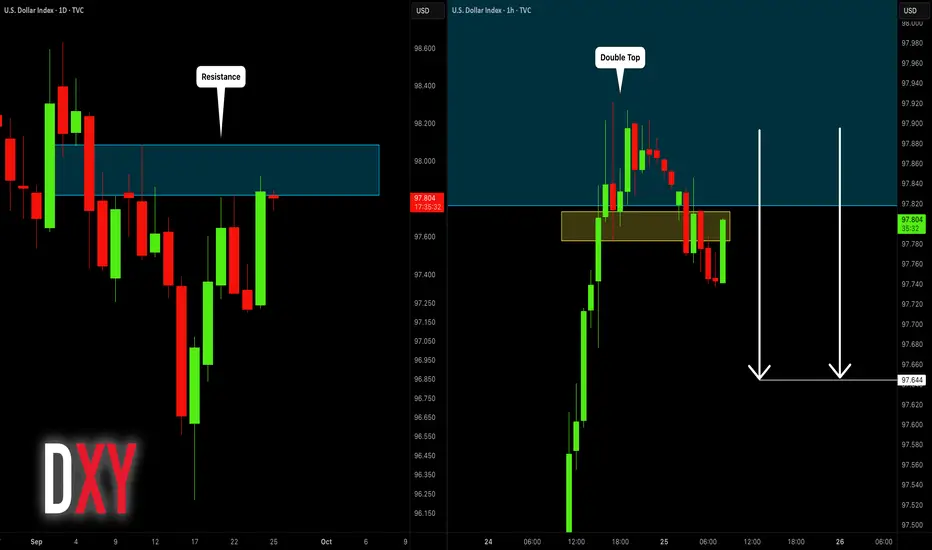
Dollar Index is testing a major daily resistance cluster now.
With a high probability, the market will retrace from that.
A double top pattern that was formed on an hourly time frame
indicates a clear overbought state.
The index may drop to 97.65
❤️Please, support my work with like, thank you!❤️
I am part of Trade Nation's Influencer program and receive a monthly fee for using their TradingView charts in my analysis.
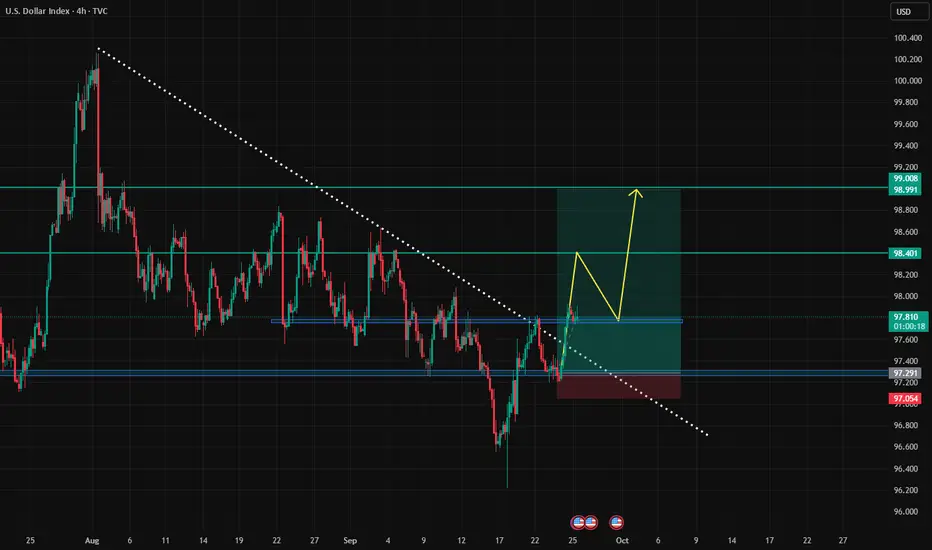
USD INDEX (DXY) BiasAm externally bullish on this guy, But price have just approached 4hr OB and resistance area
Am anticipating for a short term sells at arrowed levels before having a potential bullish PA

DXY: The Market Is Looking Down! Short!
My dear friends,
Today we will analyse DXY together☺️
The recent price action suggests a shift in mid-term momentum. A break below the current local range around 97.434 will confirm the new direction downwards with the target being the next key level of 97.299 and a reconvened placement of a stop-loss beyond the range.
❤️Sending you lots of Love and Hugs❤️

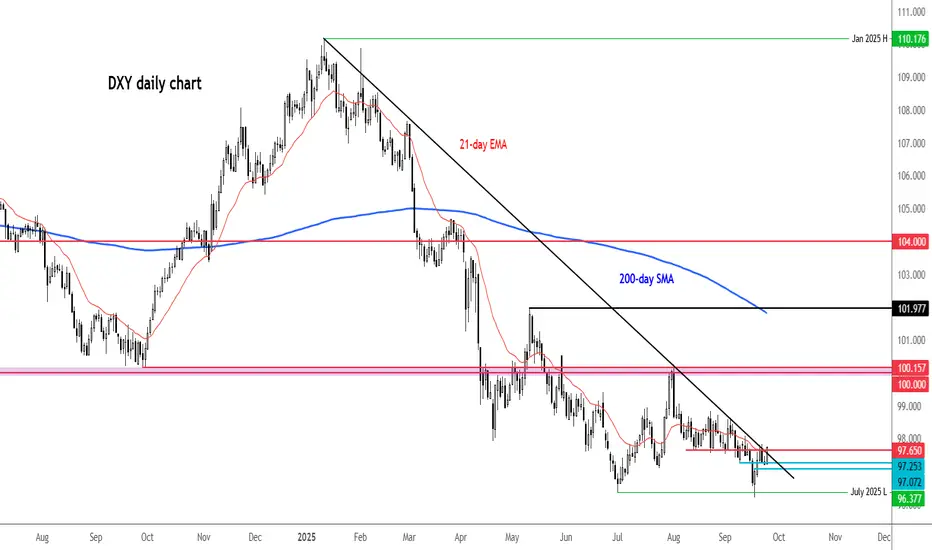
DXY testing trend resistance after Powell comments
The dollar clawed back some ground after Jerome Powell’s latest remarks, but I’m not convinced this bounce has legs. With the Fed now leaning dovish, the bias still favours more downside unless we see consistent cracks in the jobs market to justify the two cuts priced in for 2025.
Powell reiterated on Tuesday that inflation risks are skewed higher while employment risks are tilted lower, adding: “Two-sided risks mean there is no risk-free path.” Translation: he’s keeping his options open ahead of the October meeting. Fed chatter will remain front and centre, with Mary Daly up later today, jobless claims tomorrow, and the key PCE inflation reading on Friday.
The dollar index is now testing resistance around 97.60–97.80 area — a confluence of the 21-day EMA, broken support, and a trendline. Until this area breaks, it’s hard to get bullish. The broader picture of lower highs and lows still screams corrective.
By Fawad Razaqzada, market analyst with FOREX.com
Dollar Headed Higher?Looking at the price of the dollar from a daily perspective, we can see that price accumulated for about 3 full trading weeks. Manipulation took place soon after, followed by 3 strong bullish candles.
Now that bulls have entered the market after the manipulation, I fully expect the distribution to take place after retesting the bullish FVG.
Since this is the dollar we're talking about, this price movement will most likely affect the price of other assets including Gold and dollar pairs.
Targeting the daily POI/Medium BSL.

DXY Dollar Heist: Can You Escape @100?🔥 DXY Dollar Index Bank Heist Plan (Swing Trade) 🔥
Asset: DXY Dollar Index 💵Plan: Bullish 📈Thief Trading Style: Layered Limit Order Strategy 🕵️♂️
🏦 The Heist Plan 🏦
Dear Thief OG's, Ladies & Gentlemen, get ready to pull off the ultimate DXY heist! 💰 We're using the Thief Layering Strategy to stack multiple limit orders and maximize our loot. Follow the plan, adjust to your risk, and let’s escape with the cash! 🚨
📈 Entry: The Break-In
Strategy: Deploy multiple buy limit orders to layer your entries like a master thief 🕴️. Suggested levels:
98.00 💸
98.20 💸
98.40 💸
98.60 💸
Flexibility: Add more layers based on your risk appetite or market conditions 📊.
Pro Tip: Set an alert on TradingView to catch the breakout or pullback at these levels 🚨.
🛑 Stop Loss: The Escape Route
Thief SL: Set at 97.50 to protect your stash 🛡️.
Risk Management: Adjust SL based on your lot size, risk tolerance, and number of layered entries ⚖️.
Warning: Don’t get caught! This is a high-stakes heist—stick to your risk plan 🔥.
🎯 Target: The Getaway
Police Barricade: Resistance at 100.30 🚓—watch out!
Our Target: Take profits at 100.00 to escape with the loot before the market traps you 🏃♂️💨.
🧠 Why This Heist?
The DXY is showing bullish momentum based on real-time market data 📡:
Macro Factors: Strong USD demand driven by economic indicators (check COT reports, geopolitics, and intermarket analysis) 🌍.
Technical Setup: Layered entries align with swing trade pullbacks and key support zones 📉.
Scalpers 👀: Stick to quick long-side trades with trailing SL to lock in profits 💰.
⚠️ Trading Alerts: Stay Sharp!
News Releases: Avoid new trades during high-impact news to dodge volatility traps 🚫.
Position Management: Use trailing stop-loss to secure your profits and stay safe 🛡️.
💪 Boost the Heist!
Hit the Boost Button to power up our Thief Trading Style! 🚀 Every like and view strengthens our crew, helping us rob the market with precision. Let’s make money and vanish like pros! 🤑
Stay tuned for the next heist plan, Thief OG’s! 🕵️♂️🎉

USDX: demand zone holds but downside pressure remainsThe US dollar index remains under pressure, trading within a descending channel. The recent bounce from the support zone around 96.30–96.90 stalled at the EMAs and the supply zone near 98.30–98.60, where sellers reappeared. On the 4H chart, price has failed to sustain above 97.80, keeping the bearish scenario in play.
It is also important to note that the index is trading below the 200 EMA, reinforcing the bearish bias and signaling that sustainable recovery is less likely without strong fundamental catalysts.
If 96.90 breaks, the next downside target is 96.30, followed by 95.40. Stronger bearish momentum could even push the index toward 94.00, signaling further dollar weakness. For now, 96.30 acts as the key support barrier.
From a fundamental perspective, the dollar index remains weighed down by expectations of a dovish Fed and lower yields. Any hawkish surprise from Fed officials could lift price back toward 98.50, but the structure still favors bearish continuation.
This is exactly the kind of situation where market expectations diverge from reality, and the longer it lasts the more it feels like a trend reversal is near. But as always, emotions must be set aside — we wait for clear signals, not illusions.

DXY LOCAL LONG|
✅DXY is going down to retest
A horizontal support around 97.200
Which makes me locally bullish biased
And I think that we will see a rebound
And a move up from the level
Towards the target above at 97.440
LONG🚀
✅Like and subscribe to never miss a new idea!✅

DXY | Boxed In Between 96.60 & 97.20 – Powell Holds the KeyThe dollar softened in line with expectations, shrugging off hawkish Fed remarks. With DXY caught between 96.60 support and 97.20 resistance, Powell’s speech tonight could set the tone—further downside if dovish, or consolidation if steady.
