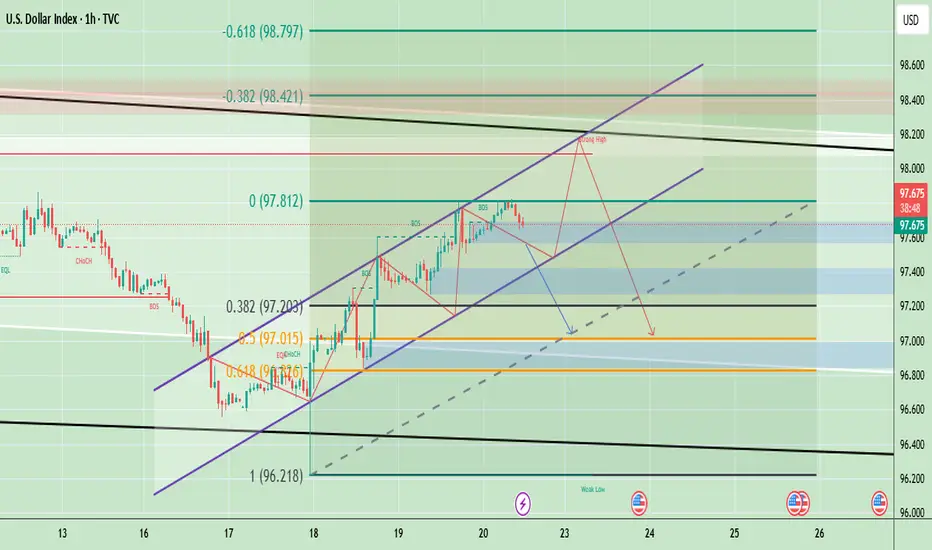
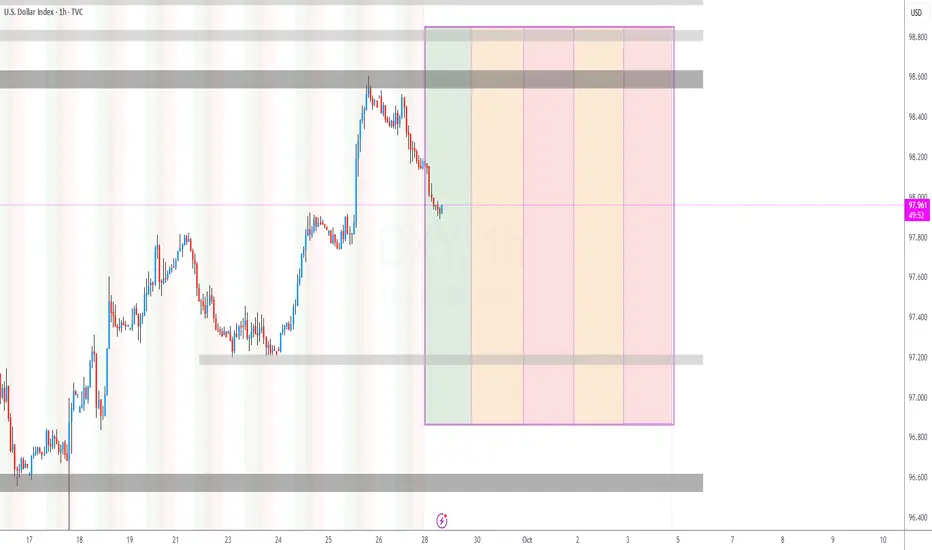
Dollar Index Resistance & Support AnalysisDXY (U.S. Dollar Index) is trading around 97.71, holding within an upward channel after bouncing from the 97.00–97.10 support zone. The structure shows a series of higher highs and higher lows, indicating short-term bullish momentum. However, the chart also highlights a potential “strong high” area near 98.20–98.40, where resistance from both Fibonacci retracement levels and channel tops converge. If DXY fails to break above this resistance, a retracement toward 97.20–97.00 is likely, with further downside risk toward 96.80 if that support breaks.
Based on the current setup, short-term upside toward 98.20–98.40 is possible, but overall bias suggests a likely pullback (downside) after testing resistance, especially if momentum weakens near the channel top.
🔴 Sell Zone (Short Setup)
- Sell Zone (Resistance area): 98.20 – 98.40
- Sell Trigger: If price tests and rejects this zone with bearish candles (reversal signals).
🟢 Buy Zone (Long Setup)
- Buy Zone (Support area): 97.20 – 97.30
- Buy Trigger: If price holds above this zone and shows bullish reversal candles (hammer, engulfing, etc.).
Note
Please risk management in trading is a Key so use your money accordingly. If you like the idea then please like and boost. Thank you and Good Luck!
DXY trade ideas
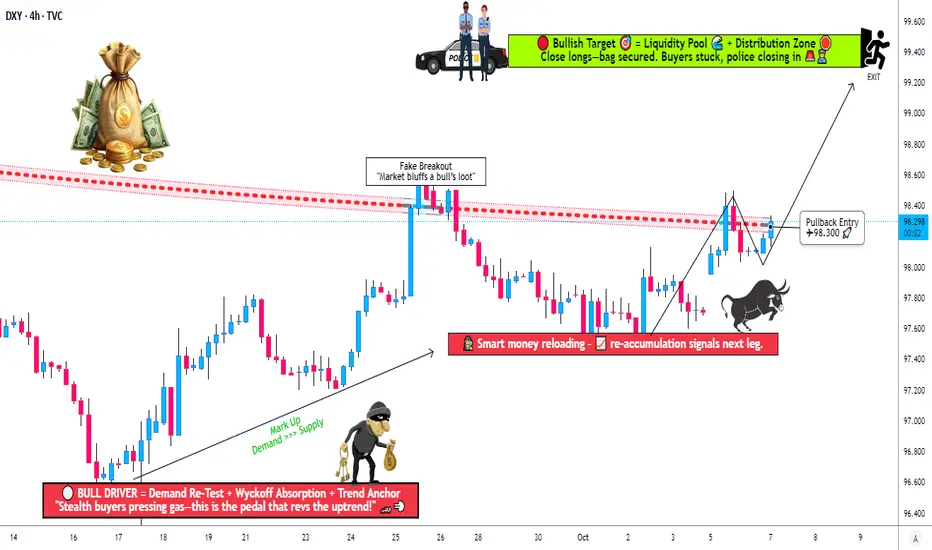
DXY Breakout Confirmed — How Far Can Bulls Run?💰 Thief’s Heist: DXY Bull Raid in Progress ⚡ Layered Entry Strategy!
📈 Setup Summary
Asset: DXY Dollar Index (Cash)
📊 Bias / Plan: BULLISH — 0.786 Triangular Moving Average was breached by buyers → trend confirmation in progress 🚀
🎯 Thief’s Game Plan (Swing / Day Trade)
🕵️ Entry Plan — “Layered Thief Style”:
💎 Any price level entry is valid — flexibility is the Thief’s advantage!
🔹 Sample Limit Layers:
• 97.800
• 98.000
• 98.200
(💡 You can increase or reduce layers based on your own style — stack smartly!)
🧨 Stop Loss (Thief SL):
⚠️ 97.400 → This is the “Thief SL Zone”
👉 But you’re the mastermind — set your own SL if you prefer!
💰 Target Zone (TP):
🚧 Police Barricade at ~99.400 — strong resistance area + oversold trap likely
💨 Thieves escape with bags before the trap closes!
⚙️ Take profit partially or fully at your own comfort — be swift, be smart 🦅
🧩 Market Insight & Technical Reasoning
✅ 786 Triangular MA breach confirms bullish structure
✅ DXY strength often follows Treasury Yield push 📈
✅ Strong USD = Weak Gold & EUR/USD usually
✅ Oversold readings hint buyers ready to counter attack
🔗 Correlation Watchlist (Related Pairs)
Keep an eye on these for confirmation 🔍
💶 FX:EURUSD → usually inverse to DXY
💷 FX:GBPUSD → tracks EUR/USD correlation
💴 FX:USDJPY → directly correlates with DXY
🥇 Gold ( OANDA:XAUUSD ) → moves opposite to DXY
💵 TVC:US10Y Yields → rising yields = bullish DXY
💡 Key Tip:
When EUR/USD & GBP/USD drop sharply + yields rise → DXY often continues its rally 🧭
⚠️ Notes & Thief Disclaimers
👑 Dear Ladies & Gentlemen (Thief OGs):
I’m not recommending my SL or TP — make your own risk rules 💼
You can make money, take money, or just watch the play unfold 🎭
This is a “Thief Style” strategy, shared for fun & educational inspiration only 🧠
Always manage risk & protect capital first — thieves survive by escaping, not over-staying 💨
✨ “If you find value in my analysis, a 👍 and 🚀 boost is much appreciated — it helps me share more setups with the community!”
Disclaimer: this is thief style trading strategy just for fun
#DXY #USDIndex #Dollar #Forex #LayeredEntry #SwingTrade #DayTrade #ThiefStrategy #TrendBreak #SmartMoney #TechnicalAnalysis #USD #TradingView #FXStrategy
07.10.25 AUDNZD Trade Recap/ Morning ForecastPairs on Watch
FX:AUDNZD Neutral
FX:GBPNZD Short
FX:AUDCHF Long
A short overview of the instruments i am looking at for today, Multi-timeframe analysis down to what i will be looking at for entry

US Dollar (DXY), strong rebound in 2026?The US Dollar is by far the weakest major currency on the FX market in 2025. But this situation could reverse in 2026 as the second year of the presidential term begins, a year that is historically unfavorable to risky assets and favorable to the US Dollar as a safe haven. Recall that during Trump’s first term, the first year (2017) saw a sharp decline in the dollar on the Forex, followed by a strong recovery in the second year (2018).
Could we see a “bis repetita” scenario with 2026, the second year of the second term?
The chart below shows the US Dollar’s last place ranking among major FX currencies.
1) The fundamental reasons that could support a rebound of the US Dollar in 2026 beyond the simple seasonality of the presidential cycle (midterms)
Several fundamental factors could sustain a US Dollar rebound in 2026:
• A shift in Federal Reserve policy could play a central role. If inflation persists or rises, the Fed could suspend or reverse the expected rate cuts, maintaining a yield differential favorable to the dollar and attracting foreign capital.
• Stronger US growth compared to the rest of the world, driven by consumption, technology, and energy independence, would make dollar-denominated assets more attractive and boost demand for the currency.
• An improvement in the trade balance, thanks to reshoring, higher exports, or lower imports, would support the dollar by limiting structural capital outflows.
• Credible fiscal consolidation signals, such as a plan to reduce deficits, would strengthen investor confidence and ease concerns about public debt, contributing to a stronger dollar.
• Increased political stability and greater predictability of economic policies, especially under a market-friendly administration, would reduce risk premiums and favor the US Dollar.
• Higher demand for safe-haven assets in the event of geopolitical tensions (e.g., China-Taiwan or the Middle East) or a global economic slowdown would boost flows into the dollar.
• Finally, the relative weakness of other major currencies — euro, yen, yuan — due to looser monetary policies or economic fragilities, would reinforce the dollar by comparison.
Together, these dynamics could create a structurally favorable environment for US Dollar appreciation in 2026.
2) To validate a US Dollar rebound, we need a technical reversal signal on long-term charts, and this is not yet the case. Here’s what to watch for
The historical weekly chart of the US Dollar shows how bullish reversals built up in 2018 and 2021. The conditions required are: stabilization of the dollar over several weeks, bullish divergences between price and momentum, a bullish reversal pattern, and finally, a breakout above resistance confirming the pattern.
At this stage, these elements are not fully in place, and the US Dollar remains bearish on FX as long as it stays below the 100-point resistance.
DISCLAIMER:
This content is intended for individuals who are familiar with financial markets and instruments and is for information purposes only. The presented idea (including market commentary, market data and observations) is not a work product of any research department of Swissquote or its affiliates. This material is intended to highlight market action and does not constitute investment, legal or tax advice. If you are a retail investor or lack experience in trading complex financial products, it is advisable to seek professional advice from licensed advisor before making any financial decisions.
This content is not intended to manipulate the market or encourage any specific financial behavior.
Swissquote makes no representation or warranty as to the quality, completeness, accuracy, comprehensiveness or non-infringement of such content. The views expressed are those of the consultant and are provided for educational purposes only. Any information provided relating to a product or market should not be construed as recommending an investment strategy or transaction. Past performance is not a guarantee of future results.
Swissquote and its employees and representatives shall in no event be held liable for any damages or losses arising directly or indirectly from decisions made on the basis of this content.
The use of any third-party brands or trademarks is for information only and does not imply endorsement by Swissquote, or that the trademark owner has authorised Swissquote to promote its products or services.
Swissquote is the marketing brand for the activities of Swissquote Bank Ltd (Switzerland) regulated by FINMA, Swissquote Capital Markets Limited regulated by CySEC (Cyprus), Swissquote Bank Europe SA (Luxembourg) regulated by the CSSF, Swissquote Ltd (UK) regulated by the FCA, Swissquote Financial Services (Malta) Ltd regulated by the Malta Financial Services Authority, Swissquote MEA Ltd. (UAE) regulated by the Dubai Financial Services Authority, Swissquote Pte Ltd (Singapore) regulated by the Monetary Authority of Singapore, Swissquote Asia Limited (Hong Kong) licensed by the Hong Kong Securities and Futures Commission (SFC) and Swissquote South Africa (Pty) Ltd supervised by the FSCA.
Products and services of Swissquote are only intended for those permitted to receive them under local law.
All investments carry a degree of risk. The risk of loss in trading or holding financial instruments can be substantial. The value of financial instruments, including but not limited to stocks, bonds, cryptocurrencies, and other assets, can fluctuate both upwards and downwards. There is a significant risk of financial loss when buying, selling, holding, staking, or investing in these instruments. SQBE makes no recommendations regarding any specific investment, transaction, or the use of any particular investment strategy.
CFDs are complex instruments and come with a high risk of losing money rapidly due to leverage. The vast majority of retail client accounts suffer capital losses when trading in CFDs. You should consider whether you understand how CFDs work and whether you can afford to take the high risk of losing your money.
Digital Assets are unregulated in most countries and consumer protection rules may not apply. As highly volatile speculative investments, Digital Assets are not suitable for investors without a high-risk tolerance. Make sure you understand each Digital Asset before you trade.
Cryptocurrencies are not considered legal tender in some jurisdictions and are subject to regulatory uncertainties.
The use of Internet-based systems can involve high risks, including, but not limited to, fraud, cyber-attacks, network and communication failures, as well as identity theft and phishing attacks related to crypto-assets.

Bearish continuation setup?The US Dollar Index (DXY) is rising towards the pivot, which is a pullback resistance that lines up with the 61.8% Fibonacci retracement and could reverse to the 1st support.
Pivot: 98.64
1st Support: 96.64
1st Resistance: 100.20
Disclaimer:
The above opinions given constitute general market commentary, and do not constitute the opinion or advice of IC Markets or any form of personal or investment advice.
Any opinions, news, research, analyses, prices, other information, or links to third-party sites contained on this website are provided on an "as-is" basis, are intended only to be informative, is not an advice nor a recommendation, nor research, or a record of our trading prices, or an offer of, or solicitation for a transaction in any financial instrument and thus should not be treated as such. The information provided does not involve any specific investment objectives, financial situation and needs of any specific person who may receive it. Please be aware, that past performance is not a reliable indicator of future performance and/or results. Past Performance or Forward-looking scenarios based upon the reasonable beliefs of the third-party provider are not a guarantee of future performance. Actual results may differ materially from those anticipated in forward-looking or past performance statements. IC Markets makes no representation or warranty and assumes no liability as to the accuracy or completeness of the information provided, nor any loss arising from any investment based on a recommendation, forecast or any information supplied by any third-party.

Dollar’s Cracks Are Showing — and the Market Smells BloodThe dollar’s strength cracked in September as fundamentals turned against the greenback. Cooling U.S. inflation, softer consumer spending, and signs of a slowing labour market gave traders fresh confidence that the Fed’s tightening cycle is over.
At the same time, growing chatter about fiscal strain and a possible government shutdown eroded demand for U.S. assets.
The Dollar Index drifted lower while EUR/USD and GBP/USD gained ground, supported by steady European inflation data and improving U.K. growth signals.
By month’s end, markets weren’t chasing yield — they were repositioning for a world where the dollar no longer leads the charge.

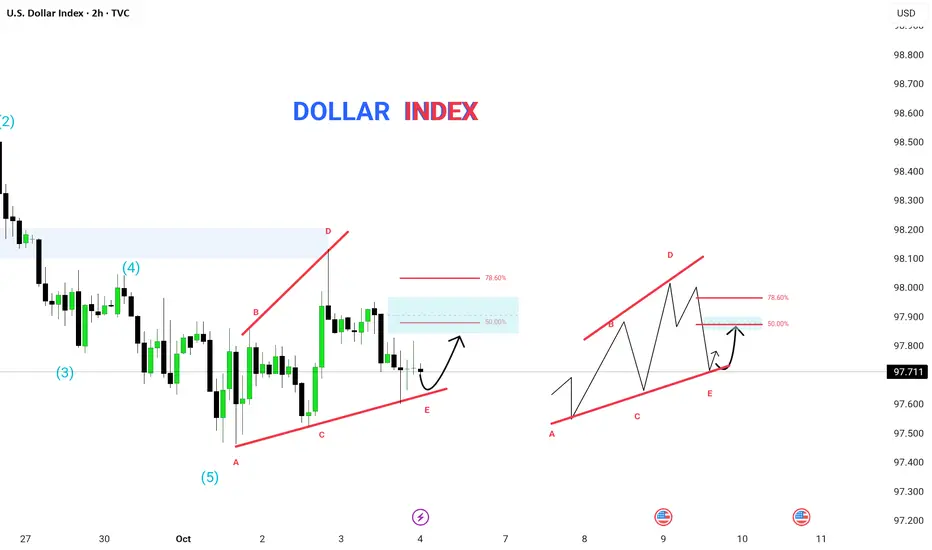
DOLLAR INDEX (DXY) – Elliott Wave & Wedge Pattern Analysis | The US Dollar Index (2H timeframe) is currently developing a corrective wedge structure (A–B–C–D–E) following a completed 5-wave bearish impulse. The current price action suggests a potential bullish correction from the E-point.
🔹 Technical Structure Breakdown:
The previous bearish leg completed a Wave (5), marking the end of an impulse cycle.
Price is now consolidating within a rising wedge pattern, forming the A–B–C–D–E structure.
The E-point is acting as a near-term support, aligning with the ascending wedge base.
Retracement targets:
50.0% → short-term correction level
78.6% → ideal reversal zone before continuation
📊 Key Levels to Watch:
Support Zone: 97.600 – 97.500
Resistance Zone: 97.900 – 98.100
Fib Targets: 50% and 78.6% retracement of the recent swing
⚡ Analyst View:
The E-point bounce could lead to a short-term bullish corrective move toward the 50–78.6% Fibonacci levels before resuming the next bearish leg as part of a broader downtrend.
Traders should monitor reaction at the wedge top for possible rejection and reversal confirmation.
🧠 Pattern: Rising Wedge inside corrective phase
🕓 Timeframe: 2H
💰 Instrument: US Dollar Index (DXY)
🎯 Bias: Short-term bullish correction → medium-term bearish continuation
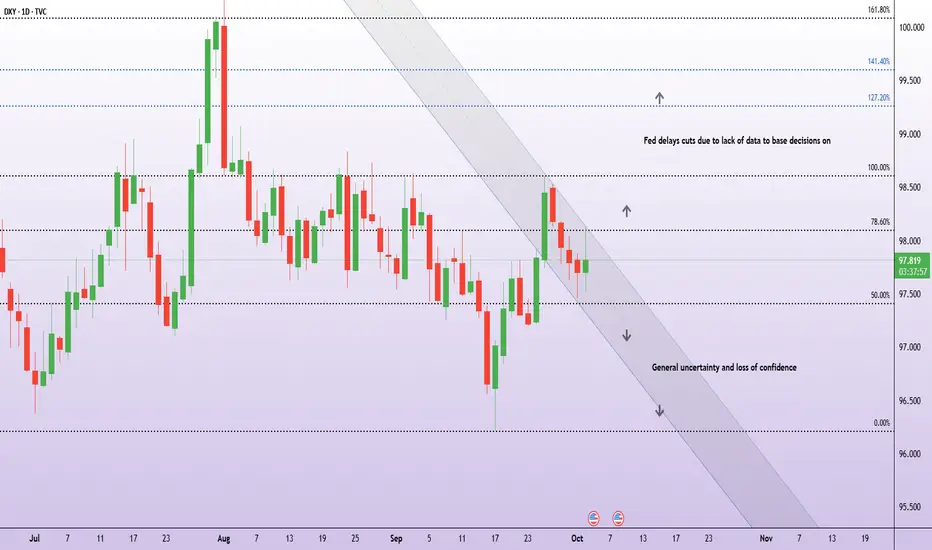
What data releases are at risk from the shutdown? The US dollar came under renewed pressure this week as the federal government entered its first shutdown in nearly seven years.
The shutdown, expected to last at least three days, means traders should not expect the September nonfarm payrolls (NFP) report this week. This key release, often one of the most closely watched on the calendar (by traders and the Federal Reserve), will now be delayed until government operations resume.
Other reports likely to be delayed or canceled include:
Wednesday, 8 October: FOMC Minutes
Wednesday, 15 October: Core and headline CPI inflation
Thursday, 16 October: Producer Price Index (PPI)
Thursday, 16 October: Retail sales
Friday, 17 October: Housing starts

Dxy builds momentum The DXY remains firm in its bullish conception, setting up for a potential projection toward the 101.000 level. This reinforces sustained dollar strength as market structure aligns with bullish momentum.

1:1 GUSmall reversal area based off previous lows, momentum to the downside but this might work out as a mini retracement.

DXY in rangedxy strugling (september open /october open) levels above that is 38.2% fib from sep high also psychological level 98 with 50day moving average and 100 MA above them , in downside level 97.5 acted as support today, what do you think considering government shutdown?

My USD analysis 1st of October 2025I made a very long sophisticated USD post but it was taken down (thanks tradingview <3) where I called long on USD. My reason was just pure technical and how it was at a support range. I think there is still more upside despite the drama that's happening around the USD. I would wait for a retest at the support then make an attempt to go long. This might potentially be a formation of a double bottom. Gold and Silver skyrocketing, but I believe there is so much potential for USD.

US DOLLAR LIQUIDITY GAMES🇺🇸 US Dollar Range Politics – Liquidity Before Clarity
The dollar isn’t trending — it’s negotiating.
📊 Current Setup
U.S. Dollar Index (DXY): 98.322 → testing the value area high
Range Floor: 96.747 → the value area low
Structure: Bearish range, with liquidity being hunted before any true direction emerges.
🏛️ Macro Backdrop
Tariffs are reshaping global flows.
Fiscal gridlock + shutdown risk clouds investor confidence.
Inflation + Fed policy signals remain mixed.
Every headline feels like an amendment to a bill no one fully understands.
The result: the dollar drifts sideways in a liquidity-seeking phase. Traders should expect chop inside the box until a decisive catalyst (data, Fed action, or policy shift) provides clarity.
🌍 Cross Pair Impact
This stalemate spills into the majors:
EURUSD & GBPUSD → reflecting the same sideways ranges and fake-outs.
USDJPY → volatility compressed, waiting for dollar direction.
Crosses are trading in sympathy — liquidity hunts on both ends, with no clean trend until DXY escapes its range.
🧭 Takeaway: The dollar is boxed in by politics and policy. Patience rules here: trade the range, wait for the breakout.

Dollar Index analysis at the start of the weekThe overall trend of the Dollar Index is still bearish, and today after the market opened it dropped again from a key support level. On the lower timeframe it looks bullish, but on the higher timeframe this could just be a correction


DXY (U.S. Dollar Index) – Bearish MomentumPrice is giving us signs of Bearish Momentum while respecting the larger descending channel structure, having recently tapped the upper trend line with a strong rejection.
Expecting:
A lower time frame correction to confirm continuation.
Targeting 90% if price breaks impulsively to the downside.
If price taps into our area of interest, we might expect a potential bullish reversal, depending on price action and correction quality.
Let price do the work, wait for the correction before entering short.

DXYU.S Dollar Index
- Bearish Channel as an corrective pattern in Short Time Frame
- Fair Value Gap
- Order Block
- Change of Characteristics
- Completed " 123 " Impulsive Waves

DXY update (29/09/2025)The upper rail of the descending parallel channel channel is waiting to be confirmed.
What matters is the fib target and bottom rail intersection. But most importantly is the bottom rail intersection.
Looks like it will be an aggressive dump.
Not financial advice

DXY outlook for the current week (WC29/09/25)DXY key levels to look out for this week, taking into consideration of manufacturing PMI, ADP & NFP
DXY 4H🔹 Overall Outlook and Potential Price Movements
In the charts above, we have outlined the overall outlook and possible price movement paths.
As shown, each analysis highlights a key support or resistance zone near the current market price. The market’s reaction to these zones — whether a breakout or rejection — will likely determine the next direction of the price toward the specified levels.
⚠️ Important Note:
The purpose of these trading perspectives is to identify key upcoming price levels and assess potential market reactions. The provided analyses are not trading signals in any way.
✅ Recommendation for Use:
To make effective use of these analyses, it is advised to manually draw the marked zones on your chart. Then, on the 15-minute time frame, monitor the candlestick behavior and look for valid entry triggers before making any trading decisions.

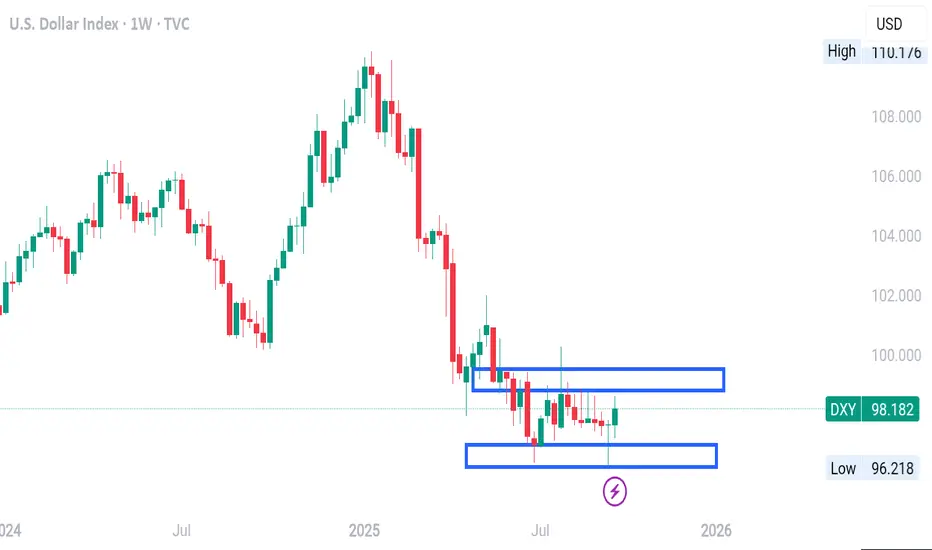
DOLLAR INDEX WEEKLY TIMEFRAME ANALYSIS Looking at the chart (USD Index, Weekly timeframe):
1. Current Context
Price has been in a clear downtrend from the highs above 110.
Recently, it has moved sideways between 96.90 – 99.30 (the two boxed ranges you marked).
Current weekly candle is green, showing a short-term attempt to bounce.
2. Key Zones
Resistance zone: 98.53 – 99.34 (upper box). Price has repeatedly failed to close above this region.
Support zone: 96.92 – 96.12 (lower box). Buyers have stepped in here multiple times to prevent deeper falls.
3. Directional Bias
Macro bias (weekly structure): Still bearish, because the overall trend is lower and price is consolidating near the bottom after a strong selloff.
Immediate/short-term bias: Neutral to slightly bullish, since the last candles show rejection of the lower end (around 97) and price is pushing back up toward resistance at 98.50+.
4. What to Watch
If price breaks and closes above 99.34, bias shifts bullish with room toward 100.95.
If price rejects the 98.5–99.3 zone again and rolls over, expect continuation lower toward 96.00 and potentially 95.30.
👉 Summary:
Bias is bearish overall, but short-term corrective bullish as price moves within the range. Directional confirmation will come only when price breaks out of either the 99.30 resistance or the 96.12 support.
DXY Showing signs of strength as we can see in weekly TF price rejects this weekly area and confirms reversal through doji candle on a weekly TF fed is not supposed to cut rates in next meeting there are possibilities that dollar can regain its strength
price did not break below the previous week low..
