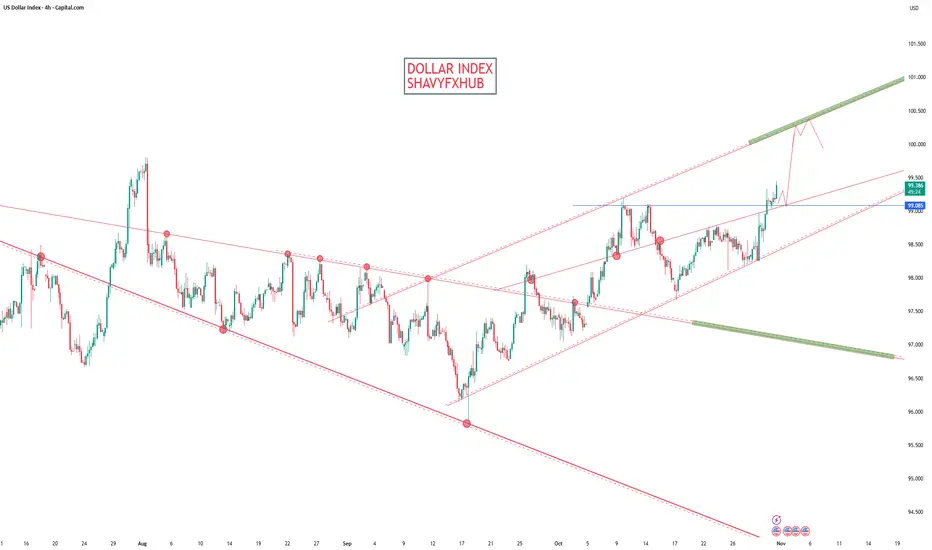
DXYDXY is ready for correction or impulse down this week even if it wants to break 100 it will give us correction down first.
Disclosure: We are part of Trade Nation's Influencer program and receive a monthly fee for using their TradingView charts in our analysis.
Trade ideas

US Dollar Index (DXY) – 4H Technical OutlookUS Dollar Index (DXY) – 4H Technical Outlook
DXY has shown a clean bullish structure shift, breaking above previous highs and confirming multiple Breaks of Structure (BOS) around the 99.00–99.20 zone.
Currently, price is trading at 99.33, inside the premium zone, and testing the weak high area near 99.40–99.60.
📊 Market Structure:
The structure has turned bullish after a confirmed Change of Character (CHoCH) and a clean BOS above 98.80.
The equilibrium zone (98.40–98.60) previously acted as strong demand and was respected multiple times.
Price is now in a premium range, suggesting potential for a short-term pullback before further continuation.
🎯 Key Levels:
Premium / Supply Zone: 99.40–99.60 (possible liquidity grab or rejection zone)
Equilibrium / Demand Zone: 98.40–98.60 (ideal re-entry zone for continuation buys)
PDH (Previous Day High): 99.40
PDL (Previous Day Low): 98.60
🧭 Trade Scenarios:
Scenario 1 – Short-term Rejection:
If DXY rejects the 99.40–99.60 supply area, expect temporary USD weakness.
This could cause pairs like EUR/USD and GBP/USD to bounce up short-term.
Scenario 2 – Continuation Buy:
If price pulls back into 98.60 equilibrium zone and forms bullish confirmation, expect continuation toward 99.80–100.00.
Supported by the 50 EMA (blue) and 200 EMA (yellow) dynamic trend alignment.
📈 Momentum Indicators:
RSI/Stochastic are both near overbought zones, indicating short-term exhaustion.
A minor retracement is likely before continuation of the bullish leg.
Summary:
The DXY remains structurally bullish but short-term overextended.
Look for a pullback toward equilibrium (98.60 zone) before the next impulse move.
This macro setup supports short-term pullbacks on USD pairs, but the broader trend remains USD bullish

DXY ShortsWe have entered a new month of trading which means new opportunities! May the month of November be a great month of trading for all.
For DXY, the overall high timeframe trend is bearish. The most current swing high has been indicated by a dashed line labelled 'Protected High'. For market to respect the high time frame downtrend, price should not break that high.
At the close of last week, price reached a supply zone at which price is likely to start the new downtrend. I will be looking for entry confirmations at the supply zone. There are two things to take into consideration once price respects the supply zone:
1. Price may have a corrective nature indicating another move up before the main sell off. If price moves this way, I will update the analysis and indicate the demand zone at which price may begin to buy from.
2. Price may be impulsive indicating major sell off as expected.
With either scenario, my perspective on DXY is still bearish. The only way I will change this view is if market impulsively breaks the protected high.
Kindly manage risk. Best Of Luck!
-TD

DXY FRGNT Weekly Forecast -Q4 | W45 | Y25 |📅 Q4 | W45 | Y25 |
📊 DXY FRGNT Weekly Forecast
🔍 Analysis Approach:
I’m applying Smart Money Concepts, focusing on:
Identifying Points of Interest on the Higher Time Frames (HTFs) 🕰️
Using those POIs to define a clear trading range 📐
Refining those zones on Lower Time Frames (LTFs) 🔎
Waiting for a Break of Structure (BoS) for confirmation ✅
This method allows me to stay precise, disciplined, and aligned with the market narrative, rather than chasing price.
💡 My Motto:
"Capital management, discipline, and consistency in your trading edge."
A positive risk-to-reward ratio, paired with a high win rate, is the backbone of any solid trading plan 📈🔐
⚠️ Losses?
They’re part of the mathematical game of trading 🎲
They don’t define you — they’re necessary, they happen, and we move forward 📊➡️
🙏 I appreciate you taking the time to review my Daily Forecast.
Stay sharp, stay consistent, and protect your capital
— FRNGT 🚀
TVC:DXY

DXY SELL TO BUY-Monthly-Bullish respect candle
Weekly-Bullish orderflow leg
Daily bullish context area FVG overlapping with FvA
H1- entry time frame for swingers, Intra day traders use 5mnt

DXY Continuing the bullish trend?DXY Weekly Outlook
The dollar has been bullish over the past few weeks, continuing to break structure to the upside. I expect this momentum to carry on a bit further, but as price approaches a strong supply zone, we could see some short-term downside.
This potential pullback would likely cause a temporary push-up for EU and GU before the dollar resumes its bullish move overall.
I don’t trade the dollar directly, but I use it as confluence for my main pairs — and right now, it aligns perfectly with my EU and GU outlooks.
Key Levels:
Possible bullish reaction around 99.600
Potential bearish reaction around 100.000 (psychological level)

dollar index to 100$
technical detail.
dollar broke out of 4hr supply roof and used nit as support ,dollar to 100$ soon,its evident from EURUSD PRICE ACTION TODAY
fundamental details
The DXY (US Dollar Index) is a benchmark that measures the value of the US dollar relative to a basket of six major global currencies: the euro (largest component), Japanese yen, British pound, Canadian dollar, Swedish krona, and Swiss franc. It serves as a broad indicator of the dollar’s strength or weakness against these currencies
The DXY is trading in the range of 105 to 107, indicating moderate strength in the US dollar.
It reflects the impact of relatively higher US interest rates and bond yields compared to other major economies.
Geopolitical uncertainties and safe-haven demand also support the dollar's position, influencing the DXY.
Key Factors Influencing DXY
Monetary Policy: The Federal Reserve’s interest rate decisions and forward guidance are primary drivers.
Economic Performance: Relative growth, inflation, and employment trends in the US versus other economies.
Risk Sentiment: The DXY often rises during periods of global uncertainty due to flight-to-quality flows into the dollar.
Trade and Capital Flows: Trade balances and foreign investment flows contribute to fluctuations.
Summary
The DXY measures overall US dollar strength against a broad basket of key currencies and is influenced heavily by US monetary policy, economic indicators, and global risk sentiment. It currently shows moderate bullishness, reflecting the Federal Reserve’s tighter policy stance and global economic conditions.
Bullish continuation setup?US Dollar Index (DXY) is falling towards the pivo,t which s a pullback support that aligns with the 50% Fibonacci retracemnt and could bounce to the 1st resistance.
Pivot: 99.10
1st Support: 98.40
1st Resistance: 100.38
Disclaimer:
The above opinions given constitute general market commentary, and do not constitute the opinion or advice of IC Markets or any form of personal or investment advice.
Any opinions, news, research, analyses, prices, other information, or links to third-party sites contained on this website are provided on an "as-is" basis, are intended only to be informative, is not an advice nor a recommendation, nor research, or a record of our trading prices, or an offer of, or solicitation for a transaction in any financial instrument and thus should not be treated as such. The information provided does not involve any specific investment objectives, financial situation and needs of any specific person who may receive it. Please be aware, that past performance is not a reliable indicator of future performance and/or results. Past Performance or Forward-looking scenarios based upon the reasonable beliefs of the third-party provider are not a guarantee of future performance. Actual results may differ materially from those anticipated in forward-looking or past performance statements. IC Markets makes no representation or warranty and assumes no liability as to the accuracy or completeness of the information provided, nor any loss arising from any investment based on a recommendation, forecast or any information supplied by any third-party.

check the trendIt is expected that the upward trend will advance to the resistance trend line and also the 78.6% level. Then there will be a possibility of a trend change.

DXY FRGNT Daily Forecast -Q4 | W44 | D31| Y25 |📅 Q4 | W44 | D31| Y25 |
📊 DXY FRGNT Daily Forecast
🔍 Analysis Approach:
I’m applying Smart Money Concepts, focusing on:
Identifying Points of Interest on the Higher Time Frames (HTFs) 🕰️
Using those POIs to define a clear trading range 📐
Refining those zones on Lower Time Frames (LTFs) 🔎
Waiting for a Break of Structure (BoS) for confirmation ✅
This method allows me to stay precise, disciplined, and aligned with the market narrative, rather than chasing price.
💡 My Motto:
"Capital management, discipline, and consistency in your trading edge."
A positive risk-to-reward ratio, paired with a high win rate, is the backbone of any solid trading plan 📈🔐
⚠️ Losses?
They’re part of the mathematical game of trading 🎲
They don’t define you — they’re necessary, they happen, and we move forward 📊➡️
🙏 I appreciate you taking the time to review my Daily Forecast.
Stay sharp, stay consistent, and protect your capital
— FRNGT 🚀
TVC:DXY

Potential bullish continuation?The US Dollar Index (DXY) is falling towards the pivot, which is a pullback support. It could bounce to the 1st resistance, which is in line with the 161.8% Fibonacci extension.
Pivot: 99.08
1st Support: 98.40
1st Resistance: 100.38
Disclaimer:
The above opinions given constitute general market commentary, and do not constitute the opinion or advice of IC Markets or any form of personal or investment advice.
Any opinions, news, research, analyses, prices, other information, or links to third-party sites contained on this website are provided on an "as-is" basis, are intended only to be informative, is not an advice nor a recommendation, nor research, or a record of our trading prices, or an offer of, or solicitation for a transaction in any financial instrument and thus should not be treated as such. The information provided does not involve any specific investment objectives, financial situation and needs of any specific person who may receive it. Please be aware, that past performance is not a reliable indicator of future performance and/or results. Past Performance or Forward-looking scenarios based upon the reasonable beliefs of the third-party provider are not a guarantee of future performance. Actual results may differ materially from those anticipated in forward-looking or past performance statements. IC Markets makes no representation or warranty and assumes no liability as to the accuracy or completeness of the information provided, nor any loss arising from any investment based on a recommendation, forecast or any information supplied by any third-party.

US Dollar: Bullish-Neutral. Buys Are Valid As +FVG Holds!Welcome back to the Weekly Forex Forecast for the week of Oct 27 - 31st.
In this video, we will analyze the following FX market: USD Dollar
The USD didn't move a lot last week, but it did move higher with Monday and Tuesday moves. The rest of the week was sideways, but it held above the +FVG. As long as the +FVG holds, prices should continue higher.
A candle body close below the +FVG will be a bearish indication.
Mindful that FOMC is Wednesday. That is decision day for the markets. Don't jump into long term moves until after the announcements for Wednesday.
Enjoy!
May profits be upon you.
Leave any questions or comments in the comment section.
I appreciate any feedback from my viewers!
Disclaimer:
I do not provide personal investment advice and I am not a qualified licensed investment advisor.
All information found here, including any ideas, opinions, views, predictions, forecasts, commentaries, suggestions, expressed or implied herein, are for informational, entertainment or educational purposes only and should not be construed as personal investment advice. While the information provided is believed to be accurate, it may include errors or inaccuracies.
I will not and cannot be held liable for any actions you take as a result of anything you read here.
Conduct your own due diligence, or consult a licensed financial advisor or broker before making any and all investment decisions. Any investments, trades, speculations, or decisions made on the basis of any information found on this channel, expressed or implied herein, are committed at your own risk, financial or otherwise.

DXY BuysDollar bullish on weekly. Price has been correcting for a few weeks to the downside. Momentum is shifting to buys on higher time frame. Price is in key areas for buys. Manage Risk!

DXY has started a new long-term Bullish Leg to 103.500.Four months ago (June 26, see chart below) we gave a strong Buy Signal on the U.S. Dollar Index (DXY), which in a month's time it hit our 100.000 Target:
Now we see the 3-year Channel Down starting the next Bullish Leg having priced its bottom (Lower Low) on September 17. As you can see this is almost the exact same triple Lower Lows bottoming process as in 2023, using also the same Fibonacci retracement levels as Targets. We have the huge 1W RSI Bullish Divergence to also confirm this.
Based on this symmetry, we have started a Bullish Leg similar to July's 2023. That peaked marginally below the 0.5 Fibonacci level. As a result, we expect DXY to target at least 103.500 by early 2026.
-------------------------------------------------------------------------------
** Please LIKE 👍, FOLLOW ✅, SHARE 🙌 and COMMENT ✍ if you enjoy this idea! Also share your ideas and charts in the comments section below! This is best way to keep it relevant, support us, keep the content here free and allow the idea to reach as many people as possible. **
-------------------------------------------------------------------------------
💸💸💸💸💸💸
👇 👇 👇 👇 👇 👇

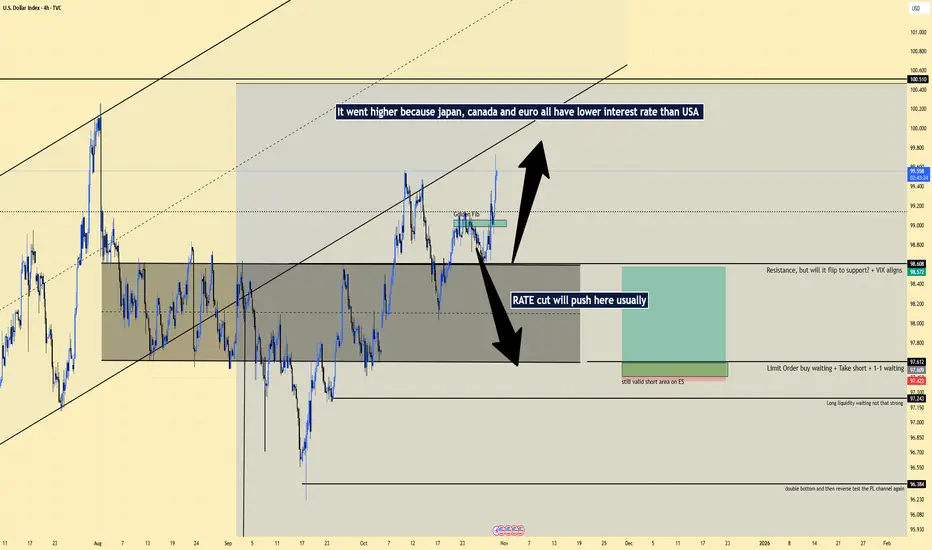
Dollar Index Analysis and Macro view in shortSo, I was analyzing the Dollar Index (DXY) to understand its next direction.
Initially, I had not checked the global interest rate landscape.
After reviewing the interest rates of Japan, Canada, Europe, and other regions, it became clear that the United States currently has higher interest rates.
This means capital is more likely to stay in the U.S. dollar, which supports continued strength in the DXY. The move was expected and aligned well with the VIX behavior.
In this analysis, I used a blend of:
Technical analysis
Semi-fundamental insights
Macro-economic context
If you have a different view or a different approach to analyzing the DXY, feel free to share your thoughts in the comments.
I would love to hear how you approach dollar index analysis, because understanding the DXY is one of the key components of global market insight.
DXY — The Dollar Game That Moves Everything...Hello Traders 🐺
Most traders keep watching Bitcoin, Gold, and the stock market...
but everything starts with the Dollar — the DXY.
DXY measures the strength of the US Dollar against major currencies (mostly the Euro, Yen, and Pound).
When DXY goes up, the Dollar is stronger.
When it goes down, the Dollar weakens.
Now here’s the fun part 👇
| Asset | When DXY goes UP | When DXY goes DOWN
| 🪙 Gold | Usually drops (USD stronger) | Usually rises
| 💰 Bitcoin | Liquidity dries up → often drops | Liquidity returns → often rallies
| 📈 Stocks | Exporters get hurt | Risk-on mood, often bullish
| 🛢 Oil | Demand cools | Prices rise with weaker USD
So yeah — DXY isn’t “just another chart.”
It’s the heartbeat of global liquidity.
⚙️ What’s happening right now
Gold is at record highs.
Bitcoin’s flying near extreme levels.
Stocks are still holding up.
Meanwhile, DXY is sitting right on a major monthly trendline support —
a level that’s held multiple times in the past.
Most traders expect the Dollar to keep weakening
after the Fed’s recent 0.25% rate cut...
but history often plays a different game.
📉 The pattern nobody talks about
Every time the US entered a recession,
the Dollar actually got stronger, even while the Fed was cutting rates.
Why? Because when fear hits, everyone runs to cash and US Treasuries.
The Dollar becomes the world’s safe haven.
So lower rates don’t always mean a weak dollar —
sometimes they’re the first warning that the system’s under stress,
and that’s exactly when DXY makes its comeback.
🇺🇸 Politics, China, and the bigger picture
Trump’s talking about another trade war with China.
China’s still trying to strengthen the Yuan and reduce its dependence on USD.
But the US can’t really afford a weak dollar right now —
because a weaker USD means more imported inflation,
and with America’s massive debt and deficits,
they need global demand for US Treasuries.
That only happens if the Dollar stays relatively strong.
🧭 My personal take
The market’s way too confident that “the Dollar is done.”
But both the chart and the history say otherwise.
DXY is testing a massive monthly trendline support while risk assets are near all-time highs.
That’s a setup I don’t want to ignore.
If DXY bounces from here,
we could see a wave of correction across Gold, Bitcoin, and even stocks.
💡 Everyone’s positioned for a weak Dollar.
History and the chart both say — it might surprise them again.
Also don't forgot our golden rule :
🐺 Discipline is rarely enjoyable , but almost always profitable. 🐺
🐺 KIU_COIN 🐺

US Dollar Index Tests Range Resistance as Momentum Firm Post-FedThe U.S. Dollar Index (DXY) continues to trade within a well-defined horizontal range, bounded by resistance near 100.30 and support around 96.42. Price is currently hovering near the upper half of this range, suggesting renewed bullish momentum in the short term.
The 50-day SMA (98.17) is trending upward and recently acted as dynamic support, while the 200-day SMA (100.53) remains above price, serving as a longer-term resistance barrier. A sustained move above the 100.30 zone would be required to shift the broader structure toward a more constructive outlook.
The MACD shows a mild bullish crossover above the signal line, indicating strengthening momentum, while the RSI (61) remains in neutral-to-bullish territory — suggesting there is room for further upside before overbought conditions emerge.
Overall, the index remains range-bound but shows short-term bullish undertones as it approaches key resistance. Traders may watch for price action confirmation near the upper boundary to gauge the next directional move.
– MW

DOLLAR INDEX (DXY): More Growth Ahead
A quick follow-up for the yesterday's idea for Dollar Index.
The market successfully violated a resistance line of a symmetrical triangle
pattern on a daily time frame.
We see its retest this morning.
A confirmed bullish CHoCH on an hourly time frame gives us a strong
intraday bullish confirmation.
There is a high chance that the Index will continue rising.
Goal - 99.35
❤️Please, support my work with like, thank you!❤️
I am part of Trade Nation's Influencer program and receive a monthly fee for using their TradingView charts in my analysis.

DOLLAR INDEX DXYWHAT IS DXY /DOLLAR INDEX
The Dollar Index (DXY) measures the value of the United States dollar against a weighted basket of six major foreign currencies: the Euro (57.6%), Japanese Yen (13.6%), British Pound (11.9%), Canadian Dollar (9.1%), Swedish Krona (4.2%), and Swiss Franc (3.6%). It is calculated as a weighted geometric mean of these currencies' exchange rates relative to the dollar. The DXY indicates the overall strength or weakness of the US dollar in the global market.
The US 10-Year Treasury Yield (US10Y) represents the return on investment for US government debt maturing in 10 years. It reflects market expectations for interest rates, inflation, and economic growth.
How DXY and US10Y interact:
When US10Y rises, reflecting tighter monetary conditions or inflation concerns, US interest rates become more attractive, which often strengthens the US dollar, leading to a higher DXY.
Conversely, when US10Y falls, lower yields can reduce dollar appeal, causing DXY to weaken.
Movements in DXY and US10Y are intertwined through monetary policy expectations and global capital flows.
For example, a rising US10Y can boost capital inflows into US assets, strengthening the dollar and pushing the DXY higher.
This interplay influences foreign exchange markets, commodity prices, and international investment decisions.
DOLLAR INDEX ON RETEST TO THE 4HR TRENDLINE WILL GO LONG .
TRADE REASON IS ON THE CHART,MARKET KEEPING LONG SENTIMENT AFTER RATE CUT WITH NO HOPE OF CUTTING AGAIN .
The Dollar Index (DXY) paradoxically rose despite the Federal Reserve's rate cut to 3.75%-4.00% on October 29, 2025, due to several nuanced reasons:
Market Expectations vs Reality: The rate cut was widely anticipated and mostly priced in before the announcement. When the Fed delivered the expected 25 basis point cut without signaling more aggressive easing ahead, it reassured markets about the US economic outlook.
Dovish but Cautious Fed Tone: Fed Chair Powell emphasized a cautious approach, highlighting uncertainties but not committing to a rapid series of cuts. This balanced tone supported confidence in the dollar.
Safe-Haven Demand: Global economic uncertainties and geopolitical risks boosted demand for the US dollar as a safe-haven currency, pushing the DXY higher.
Relative Monetary Policy: While the Fed cut rates, other major central banks like the ECB and BOJ remained more dovish or on hold, keeping the dollar relatively attractive.
Technical Buying: The DXY had technical support around current levels, triggering algorithmic and institutional buying on dips.
the DXY's rise reflects that investors viewed the rate cut as a pragmatic, measured step rather than a sign of economic weakness, supporting dollar strength despite the easing.
KEY FUNDAMENTAL REPORT TODAY FROM UNITED STATES .
The Federal Reserve announced a 25 basis point cut to its benchmark federal funds rate on October 29, 2025, lowering the target range to 3.75% - 4.00%. This marks the second consecutive rate reduction this year. The decision was made amid moderate economic expansion, a slowing job market, slightly elevated inflation, and uncertainty caused by limited economic data due to a government shutdown.
The Fed also stated it will end the reduction of its balance sheet assets (quantitative tightening) on December 1, 2025. The committee emphasized attentiveness to the evolving economic outlook, risks to employment and inflation, and readiness to adjust policy accordingly. The vote was 10-2, with some dissent for either deeper cuts or no cuts at all.
This rate cut supports easing financial conditions to aid maximum employment and returning inflation to the 2% long-run goal.
Federal Reserve Chair Jerome Powell delivered speech.
Key points from his speech:
The Fed remains focused on achieving maximum employment and stable prices.
Despite some disruption from a partial government shutdown delaying some economic data, available information indicates little change in employment and inflation outlooks since the September meeting.
Labor market conditions appear to be gradually cooling, with inflation still somewhat elevated.
The rate cut was aimed at supporting these goals given the balance of risks to employment and inflation.
The Fed will end the reduction of its asset holdings (quantitative tightening) on December 1.
Powell emphasized a balanced approach between supporting growth and controlling inflation, noting the policy is not on a preset course.
Future rate moves remain data-dependent; a December rate cut is not guaranteed.
He acknowledged the challenges and trade-offs in monetary policy decision-making, especially under uncertainty from recent disruptions.
Overall, Powell’s speech conveyed cautious optimism combined with a pragmatic acknowledgement of incoming risks and uncertainty, signaling readiness to adjust policy to evolving economic conditions.
NOTE ;TRADING IS 100% PROBABILITY.
RISK MANAGEMENT IS KEY
ANY KEY LEVEL CAN FAIL.
#GOLD #US10Y #DOLLAR


Forex Traders Focus on Central Bank DecisionsForex Traders Focus on Central Bank Decisions
As expected, the Federal Reserve yesterday cut the Federal Funds Rate from 4.25% to 4.00%, while Jerome Powell’s remarks reduced the likelihood of further rate cuts. Meanwhile, decisions by other key central banks are also influencing the currency markets, according to Forex Factory:
→ The Bank of Canada lowered its policy rate from 2.50% to 2.25%, in line with market expectations. Its official statement highlighted risks of slower GDP growth, “continued weakness in the economy”, and concerns over U.S. trade relations and tariffs.
→ The Bank of Japan (BoJ) kept interest rates unchanged but signalled readiness to raise borrowing costs if economic conditions allow. This has shifted traders’ focus towards a possible rate hike as early as December.
→ The European Central Bank (ECB) is expected to leave its key rate steady, with the decision due at 16:15 GMT+3 today.
→ Next week, both the Reserve Bank of Australia and the Bank of England are scheduled to announce their policy decisions.
Against this backdrop, attention is increasingly turning to the Dollar Index (DXY) chart today.
Technical Analysis of the DXY Chart
On 19 September, we conducted a key analysis of the DXY chart, noting that:
→ The long-term downward channel (shown in red) remains relevant, divided into quarters by the intermediate QL and QH lines.
→ The index had rebounded from the QL line (marked by an arrow).
→ A bullish scenario was emerging.
Following that rebound, the price began to form an upward trajectory, reaching the upper boundary of the channel by 10 October — which, as anticipated, acted as strong resistance.
Currently, the DXY chart displays a narrowing triangle pattern, where:
→ The resistance is defined by the upper edge of the long-term descending channel that has contained the index’s 2025 movements.
→ The short-term upward channel from the September low remains intact.
This formation may reflect both the current balance of the U.S. dollar against a basket of major currencies and the uncertainty among analysts about its future direction.
Given the combination of central bank decisions, the U.S. government shutdown, geopolitical risks, and trade tensions, a breakout from this triangle could mark the start of a major trend lasting several weeks or even months.
Yesterday’s Fed decision strengthened the dollar, breaking through a local Bullish Flag pattern (shown in blue) and increasing the likelihood of further upward momentum.
This article represents the opinion of the Companies operating under the FXOpen brand only. It is not to be construed as an offer, solicitation, or recommendation with respect to products and services provided by the Companies operating under the FXOpen brand, nor is it to be considered financial advice.

DOLLAR INDEX (DXY): Confirmed Bullish ContinuationThe DOLLAR INDEX appears to be showing bullish tendencies from both daily and intraday perspectives.
From a daily timeframe, I observe a confirmed breakout of a resistance line within a symmetrical triangle pattern, indicating a trend violation and continuation.
On an hourly timeframe, we see a breakout of a resistance line of a bullish flag pattern, followed by a strong bullish movement.
I anticipate that the market will continue to grow.
The next resistance level is identified at 99.53.

dxy 1h🔹 Overall Outlook and Potential Price Movements
In the charts above, we have outlined the overall outlook and possible price movement paths.
As shown, each analysis highlights a key support or resistance zone near the current market price. The market’s reaction to these zones — whether a breakout or rejection — will likely determine the next direction of the price toward the specified levels.
⚠️ Important Note:
The purpose of these trading perspectives is to identify key upcoming price levels and assess potential market reactions. The provided analyses are not trading signals in any way.
✅ Recommendation for Use:
To make effective use of these analyses, it is advised to manually draw the marked zones on your chart. Then, on the 5-minute time frame, monitor the candlestick behavior and look for valid entry triggers before making any trading decisions.
