Dollar Index Daily Trade SetupsIn this update, we review the recent price action in the Dollar Index and identify the next high-probability trading opportunities and price objectives to target. To review today's analysis, click here!
Trade ideas

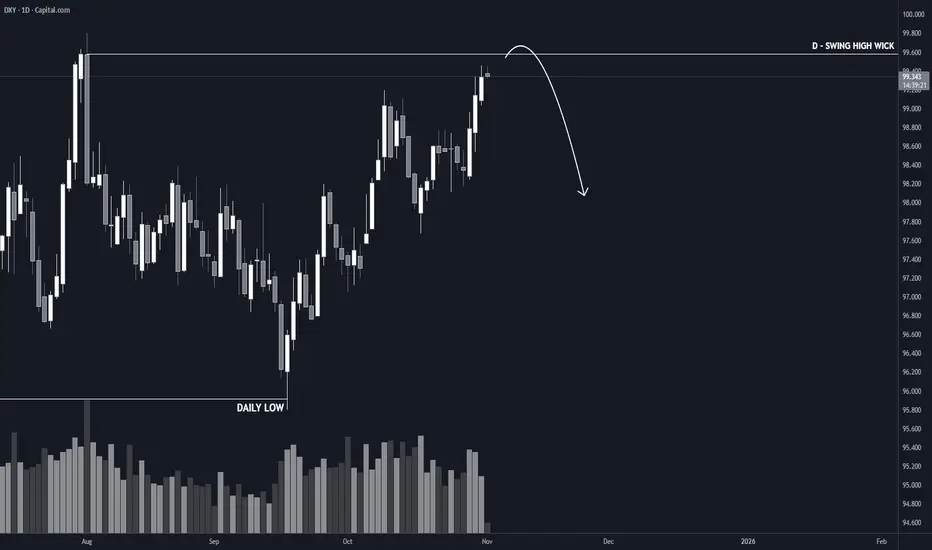
USD Potential Retracement to 99.5I am anticipating a potential retracement on DXY :
Price has run above the recent daily range high. I am now anticipating a potential retracement or pullback.
I will be monitoring H4 and H1 Timeframe price action to see if H1 and H4 lows can start getting taken to validate the idea.
I will also be monitoring the close of Wednesdays Daily Candle.
I am anticipating DXY to pullback to around 99.475 to look for more long positions.
Once dxy has traded back to the key level / support area i will then target 100.360

DXY Institutional Pullback Setup – Smart Money Buying the Dip!💰 DXY: The Dollar Flexing Hard - Institutional Swing Play! 🎯
📊 Market Overview
The U.S. Dollar Index (DXY) is showing serious institutional strength! After a clean pullback to the 786 Triangular Moving Average, we're locked and loaded for a bullish continuation play. This setup screams "smart money accumulation" and we're positioning for the ride up! 💪
🎯 The Setup: Bullish Confirmation ✅
Asset: DXY (U.S. Dollar Index CFD)
Bias: 🟢 BULLISH - Confirmed on institutional timeframes
Strategy Type: Swing/Day Trade Hybrid
📈 Technical Confluence:
✅ 786 TMA Pullback - Textbook institutional support zone
✅ Price action holding above key structure
✅ Volume profile showing accumulation
✅ Smart money footprint evident
🎲 The "Layered Entry" Gameplan (Thief Style 😎)
Instead of going all-in at one price, we're using multiple limit orders (layering strategy) to build our position like the institutions do:
💵 Entry Zones (Layer Your Orders):
Layer 1: 98.400
Layer 2: 98.600
Layer 3: 98.800
Note: You can add more layers based on your risk appetite and account size! The beauty of layering? You average into the move without FOMO-ing at the worst price. 🧠
Current Price Entry: Yes, you can enter at market if you're confident in the setup, but layering gives you better risk management.
🛡️ Risk Management (Thief OG Edition)
🚨 Stop Loss: 98.100
This is MY stop loss based on my risk tolerance. IMPORTANT: I'm NOT telling you to blindly copy this. Set your SL based on YOUR account size, risk percentage, and comfort level. Trade your plan, not mine! 🎰
🎯 Profit Target: 100.000 (The Big Round Number!)
🧲 Why 100.000?
Simple Moving Average acting as strong resistance
Psychological round number = liquidity magnet 🧲
Overbought conditions likely near this zone
Trap potential for late longs - we want to exit before the crowd panics!
Exit Strategy: Take profits in stages! Don't be greedy. 💰 Consider taking 50% off at 99.500 and letting the rest ride to 100.000 with a trailing stop.
DISCLAIMER: This target is MY analysis. You decide when to take profits based on your strategy. If you see your account glowing green, TAKE THE MONEY! 💸
🔗 Related Pairs to Watch (Correlation Game 🕹️)
The DXY doesn't move in isolation! Here are the correlated plays:
📉 Inverse Correlations (These typically move OPPOSITE to DXY):
FX:EURUSD - Strong negative correlation (~-95%). DXY up = EUR/USD down
FX:GBPUSD - Cable follows Euro's lead, watch for breakdown
OANDA:AUDUSD & OANDA:NZDUSD - Commodity currencies get crushed when DXY rips
Gold ( OANDA:XAUUSD ) - Dollar strength = gold weakness (classic inverse)
📈 Positive Correlations (These move WITH DXY):
FX:USDJPY - Yen pairs amplify dollar moves
OANDA:USDCHF - Swissy follows dollar strength
OANDA:USDCAD - Loonie weakens on DXY strength (unless oil goes parabolic)
Pro Tip: If DXY is pumping but EUR/USD isn't dumping proportionally, something's off - be careful! 🚩
🧠 Key Points & Edge:
Institutional Level Confirmed - The 786 TMA is a proven reversal/continuation zone used by big money
Swing Trading Sweet Spot - This isn't a scalp; give it room to breathe
Layer Like a Pro - Don't blow your load on one entry; scale in strategically
Risk First, Profits Second - Protect your capital like it's your only child 👶
Watch Correlations - DXY strength impacts EVERYTHING in Forex
⚠️ Risk Disclosure & "Thief Style" Disclaimer
THIS IS THE "THIEF STYLE" TRADING STRATEGY - JUST FOR FUN AND EDUCATIONAL PURPOSES! 🎲
This analysis represents MY personal trading plan and bias. I am NOT a financial advisor, and this is NOT financial advice. Trading involves substantial risk of loss, and you could lose more than your initial investment.
✅ Do your own research (DYOR)
✅ Never risk more than you can afford to lose
✅ Past performance ≠ future results
✅ Markets can remain irrational longer than you can remain solvent
Trade at your own risk! I'm sharing my playbook, but YOU are responsible for your account. If you make money, congrats! 🎉 If you lose money, that's on you, not me. Manage your risk like a pro! 💪
🚀 Let's Catch This Move Together!
The setup is ripe, the levels are clear, and the plan is locked in. Now we wait for the market to come to us - patience pays in this game! ⏰
✨ If you find value in my analysis, a 👍 and 🚀 boost is much appreciated — it helps me share more setups with the community!
#DXY #USDollarIndex #ForexTrading #SwingTrading #InstitutionalTrading #TechnicalAnalysis #TradingStrategy #ForexSignals #PriceAction #SupportAndResistance #RiskManagement #EURUSD #ForexCorrelation #SmartMoney #TradingView #MarketAnalysis #DayTrading #ForexLife #ThiefStyle #LayeredEntry #DollarBull
Happy Trading, Thief OGs! 💎🙌

Dxy | Dollar indexHi my friends. I think price can not break previous high. It's failure to return so market is bearish!

Dxy will fall in coming months Crypto will Rise.Dxy Target of 92 is going to happen in coming months blow off top will happen before bear market starts.

DXY FRGNT Daily Forecast -Q4 | W45 | D4| Y25 |
📅 Q4 | W45 | D4| Y25 |
📊 DXY FRGNT Daily Forecast
🔍 Analysis Approach:
I’m applying Smart Money Concepts, focusing on:
Identifying Points of Interest on the Higher Time Frames (HTFs) 🕰️
Using those POIs to define a clear trading range 📐
Refining those zones on Lower Time Frames (LTFs) 🔎
Waiting for a Break of Structure (BoS) for confirmation ✅
This method allows me to stay precise, disciplined, and aligned with the market narrative, rather than chasing price.
💡 My Motto:
"Capital management, discipline, and consistency in your trading edge."
A positive risk-to-reward ratio, paired with a high win rate, is the backbone of any solid trading plan 📈🔐
⚠️ Losses?
They’re part of the mathematical game of trading 🎲
They don’t define you — they’re necessary, they happen, and we move forward 📊➡️
🙏 I appreciate you taking the time to review my Daily Forecast.
Stay sharp, stay consistent, and protect your capital
— FRNGT 🚀
TVC:DXY

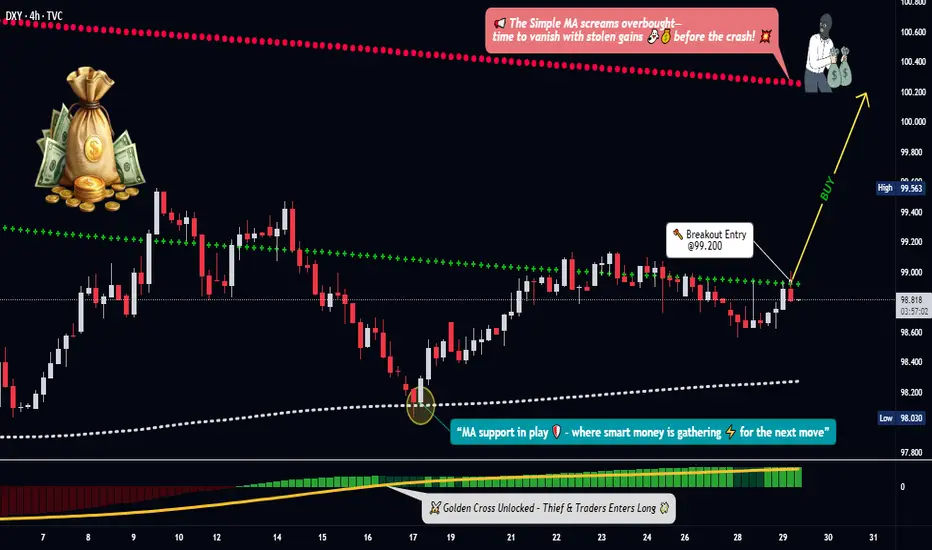
DXY Breakout Map — Is the Dollar Index Ready for a Power Move?🎯 DXY BULLISH BREAKOUT: The "Limit Order Layup" Strategy 🚀
Hey Thief OGs! 👋 The King Dollar 👑 is getting ready for a potential rally, and we've got the map 🗺️ to navigate it. This is a swing/day trade plan focusing on a classic technical setup with a tactical entry twist.
📈 The Overall Plan (Bias): BULLISH 🐂
The strategy waits for a bullish confirmation using a Simple Moving Average (SMA) pullback 🔙 followed by a MACD golden cross ✨. We're buying the dip, expecting a continuation upward 📊.
⚡ The Thief's Entry Tactic (The "Layering Method") 🎁
The key is patience and precision. We don't chase the price.
✅ Wait for the Trigger: Confirm a daily close ABOVE 99.200.
🎯 Deploy Limit Orders: After the breakout, set multiple buy limit orders at key support levels to get a good average entry price.
Suggested Layers: 🟢 98.400, 🟢 98.600, 🟢 98.800, 🟢 99.000
💡 Pro Tip: You can adjust the number of layers and levels based on your own risk appetite!
🛡️ Risk Management (The Escape Plan) 🚨
Stop Loss (SL): A hard stop is placed at 98.200. This level is the line in the sand – if price breaks below here, our thesis is likely invalid ❌.
⚠️ Note: Dear Ladies & Gentleman (Thief OGs), I do not recommend you set only my SL. It is your own choice. You can make money, then take money at your own risk.
🎯 Profit Targets (The Getaway) 💰
Take Profit (TP): We are targeting 100.200. This zone aligns with where the Moving Average may act as strong resistance, and the market could become overbought. When the trap is set, we escape with profits! 🏃♂️💨
⚠️ Note: Dear Ladies & Gentleman (Thief OGs), I am not recommending you set only my TP. It is your own choice. You can make money, then take money at your own risk.
🔍 Related Pairs to Watch & Key Correlations 🌐
The DXY doesn't move in a vacuum. Keep an eye on these:
EUR/USD ( FX:EURUSD ): 👑 The inverse king. A rising DXY typically means a falling EUR/USD 📉.
GBP/USD ( FX:GBPUSD ): Similar to the Euro, a strong dollar often pressures Cable downward 📉.
Gold ( OANDA:XAUUSD ): 🪙 Gold is priced in USD. A stronger dollar can make gold more expensive for other currencies, often putting downward pressure on it 📉.
USD/JPY ( FX:USDJPY ): A strong dollar trend usually powers USD/JPY higher 📈.
Key Point: If our DXY bullish idea is correct, you should generally see EUR/USD and GBP/USD weakening 📉, and USD/JPY strengthening 📈.
✨ “If you find value in my analysis, a 👍 and 🚀 boost is much appreciated — it helps me share more setups with the community!”
#DXY #TradingSetup #SwingTrading #Forex #DollarIndex #TradingStrategy #MACD #TechnicalAnalysis #LimitOrder
DXY — London Session🧭 Market Context
Dollar capped down overnight from 99.762 to 99.704 but still trades above the key bullish structure point at 99.525. The structure remains bullish overall, yet price keeps failing to break through 99.875 — the current cap. London session has filled yesterday’s balance range, leaving us in neutral territory.
We’re sitting on zero deviation — meaning equal chance to push higher or rotate lower.
Before taking any position, we need confirmation.
📈 Technical Frame DSM + VFA
Structure stays constructive but momentum is fading.
Volume shows thinning participation near 99.875 — professionals aren’t chasing.
If we see clear volume conviction through that level, we likely drive higher and fill the capped zone. If price slips below 99.525, expect a liquidity sweep into the lower volume pocket near 99.40. Right now, this is observation mode — not engagement mode.
🌍 Fundamental Frame (Macro Logic)
Overnight softness came from mild risk-on sentiment — Asia equities up, yields down.
Still, the Fed’s tone stays restrictive, and dollar demand remains under the surface.
This move looks more like positioning ahead of NFP than any real shift in trend.
🏛️ Coach’s Lens
When the market sits in balance, patience becomes the edge.
Professionals wait for clarity; amateurs act on hope.
Bias follows structure — not emotion.
🎯 Operator Rule
Confirmation defines conviction.
— CORE5DAN
Institutional Logic. Modern Technology. Real Freedom.

DXY Daily Outlook — Bullish Order Flow Toward Equal HighsHello traders 👋
On the DXY daily chart, we can clearly see that price showed a strong bullish reaction after grabbing liquidity below 96.37, initiating a bullish order flow that, in my view, is still in progress.
The equal highs above the current price act as a potential draw on liquidity and serve as my first bullish target.
However, keep an eye on the trendline liquidity forming below the current price — there’s a possibility that price may sweep this liquidity before continuing higher.
Overall, my bias remains bullish for now.
💌It is my honor to share your comments with me💌
🔎 DYOR
💡Wait for the update!

DXY FRGNT Weekly Forecast -Q4 | W45 | Y25 |📅 Q4 | W45 | Y25 |
📊 DXY FRGNT Weekly Forecast
🔍 Analysis Approach:
I’m applying Smart Money Concepts, focusing on:
Identifying Points of Interest on the Higher Time Frames (HTFs) 🕰️
Using those POIs to define a clear trading range 📐
Refining those zones on Lower Time Frames (LTFs) 🔎
Waiting for a Break of Structure (BoS) for confirmation ✅
This method allows me to stay precise, disciplined, and aligned with the market narrative, rather than chasing price.
💡 My Motto:
"Capital management, discipline, and consistency in your trading edge."
A positive risk-to-reward ratio, paired with a high win rate, is the backbone of any solid trading plan 📈🔐
⚠️ Losses?
They’re part of the mathematical game of trading 🎲
They don’t define you — they’re necessary, they happen, and we move forward 📊➡️
🙏 I appreciate you taking the time to review my Daily Forecast.
Stay sharp, stay consistent, and protect your capital
— FRNGT 🚀
TVC:DXY

DXY ANALYSIS: TRADING WEEK 3 - 7 NOVEMBER 2025On this video i higlight the importance of the 101.800 area of resistance, a multi year resistance that on my view will be reached soon
I have two possible scenarios for the DXY next week:
- Test of the 101.800 during the first 2/3 trading days and pullback to the 97,700 area of support where the DXY would cover a gap left open 3 weeks ago and where the DXY will start rallying up again
- Test of the 101.300 - 101.500 level of resistance during the first 2/3 trading days and pullback to the 98.500 - 98.400 area of support where the DXY will start rallying up again
Data released through the week and the strength of the Index will ultimately confirm one of the two scenario
I will update and follow up on this trading analysis - setup; please like, comment and share if you like this Trading Idea

DXY should make clear path soonThere is a liquidation zone on number 9 TD sequential and bottom of mini channel.
Bullish momentum set to continue?The US Dollar Index (DXY) is falling towards the pivot, which is a pullback suport and could bounce to the 1st resistance.
Pivot: 99.53
1st Support: 98.55
1st Resistance: 101.46
Disclaimer:
The above opinions given constitute general market commentary, and do not constitute the opinion or advice of IC Markets or any form of personal or investment advice.
Any opinions, news, research, analyses, prices, other information, or links to third-party sites contained on this website are provided on an "as-is" basis, are intended only to be informative, is not an advice nor a recommendation, nor research, or a record of our trading prices, or an offer of, or solicitation for a transaction in any financial instrument and thus should not be treated as such. The information provided does not involve any specific investment objectives, financial situation and needs of any specific person who may receive it. Please be aware, that past performance is not a reliable indicator of future performance and/or results. Past Performance or Forward-looking scenarios based upon the reasonable beliefs of the third-party provider are not a guarantee of future performance. Actual results may differ materially from those anticipated in forward-looking or past performance statements. IC Markets makes no representation or warranty and assumes no liability as to the accuracy or completeness of the information provided, nor any loss arising from any investment based on a recommendation, forecast or any information supplied by any third-party.

US Dollar: Bullish-Neutral. Buys Are Valid As +FVG Holds!Welcome back to the Weekly Forex Forecast for the week of Oct 27 - 31st.
In this video, we will analyze the following FX market: USD Dollar
The USD didn't move a lot last week, but it did move higher with Monday and Tuesday moves. The rest of the week was sideways, but it held above the +FVG. As long as the +FVG holds, prices should continue higher.
A candle body close below the +FVG will be a bearish indication.
Mindful that FOMC is Wednesday. That is decision day for the markets. Don't jump into long term moves until after the announcements for Wednesday.
Enjoy!
May profits be upon you.
Leave any questions or comments in the comment section.
I appreciate any feedback from my viewers!
Disclaimer:
I do not provide personal investment advice and I am not a qualified licensed investment advisor.
All information found here, including any ideas, opinions, views, predictions, forecasts, commentaries, suggestions, expressed or implied herein, are for informational, entertainment or educational purposes only and should not be construed as personal investment advice. While the information provided is believed to be accurate, it may include errors or inaccuracies.
I will not and cannot be held liable for any actions you take as a result of anything you read here.
Conduct your own due diligence, or consult a licensed financial advisor or broker before making any and all investment decisions. Any investments, trades, speculations, or decisions made on the basis of any information found on this channel, expressed or implied herein, are committed at your own risk, financial or otherwise.

DXYSo DXY showing great structure after failing to continue bullish as it did not break above the supply zone and now, moving bearish ensuring the to move towards previous demad zone which price created.

DXY — London SessionThe Dollar reached its 99.8 target and closed the day above it, confirming short-term strength. Price now trades stretched on the daily chart, well above its normal rhythm. As long as daily lows keep printing higher, structure holds — but with both weekly and monthly charts in correction, momentum could fade quickly. This is a day-by-day market where clarity matters more than conviction.
On the technical side, DXY shows rhythm exhaustion — clear deviation from its average range. When price moves this far from balance, professionals stop chasing and wait for rhythm to reset. The key signal now is whether the next daily low holds or breaks; that decides who controls the tape.
Macro conditions still support the Dollar. The Fed’s tone stays cautious on further cuts, while the U.S. government shutdown keeps data flow limited. Investors prefer safety over yield, and capital continues to park in USD for clarity and liquidity. It’s not a growth story — it’s a stability story.
When a target hits, professionals re-map before acting again. The next decision comes from structure, not emotion.
Operator Rule: After targets hit, think — don’t chase.
- Institutional Logic. Modern Technology. Real Freedom.

DXYU.S Dollar Index
- Completed " 12345 " Impulsive Waves
- Break of Structure
- Bullish Channel as an corrective pattern in Long Time Frame
- Order Block
- RSI - Divergence

DXY FRGNT Daily Forecast -Q4 | W45 | D3| Y25 |📅 Q4 | W45 | D3| Y25 |
📊 DXY FRGNT Daily Forecast
🔍 Analysis Approach:
I’m applying Smart Money Concepts, focusing on:
Identifying Points of Interest on the Higher Time Frames (HTFs) 🕰️
Using those POIs to define a clear trading range 📐
Refining those zones on Lower Time Frames (LTFs) 🔎
Waiting for a Break of Structure (BoS) for confirmation ✅
This method allows me to stay precise, disciplined, and aligned with the market narrative, rather than chasing price.
💡 My Motto:
"Capital management, discipline, and consistency in your trading edge."
A positive risk-to-reward ratio, paired with a high win rate, is the backbone of any solid trading plan 📈🔐
⚠️ Losses?
They’re part of the mathematical game of trading 🎲
They don’t define you — they’re necessary, they happen, and we move forward 📊➡️
🙏 I appreciate you taking the time to review my Daily Forecast.
Stay sharp, stay consistent, and protect your capital
— FRNGT 🚀
TVC:DXY

Forex Traders Focus on Central Bank DecisionsForex Traders Focus on Central Bank Decisions
As expected, the Federal Reserve yesterday cut the Federal Funds Rate from 4.25% to 4.00%, while Jerome Powell’s remarks reduced the likelihood of further rate cuts. Meanwhile, decisions by other key central banks are also influencing the currency markets, according to Forex Factory:
→ The Bank of Canada lowered its policy rate from 2.50% to 2.25%, in line with market expectations. Its official statement highlighted risks of slower GDP growth, “continued weakness in the economy”, and concerns over U.S. trade relations and tariffs.
→ The Bank of Japan (BoJ) kept interest rates unchanged but signalled readiness to raise borrowing costs if economic conditions allow. This has shifted traders’ focus towards a possible rate hike as early as December.
→ The European Central Bank (ECB) is expected to leave its key rate steady, with the decision due at 16:15 GMT+3 today.
→ Next week, both the Reserve Bank of Australia and the Bank of England are scheduled to announce their policy decisions.
Against this backdrop, attention is increasingly turning to the Dollar Index (DXY) chart today.
Technical Analysis of the DXY Chart
On 19 September, we conducted a key analysis of the DXY chart, noting that:
→ The long-term downward channel (shown in red) remains relevant, divided into quarters by the intermediate QL and QH lines.
→ The index had rebounded from the QL line (marked by an arrow).
→ A bullish scenario was emerging.
Following that rebound, the price began to form an upward trajectory, reaching the upper boundary of the channel by 10 October — which, as anticipated, acted as strong resistance.
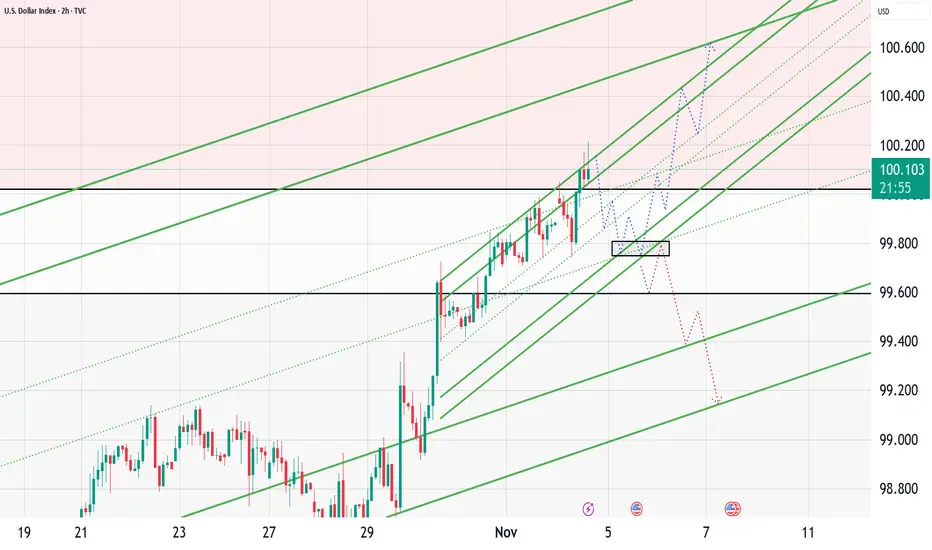
Currently, the DXY chart displays a narrowing triangle pattern, where:
→ The resistance is defined by the upper edge of the long-term descending channel that has contained the index’s 2025 movements.
→ The short-term upward channel from the September low remains intact.
This formation may reflect both the current balance of the U.S. dollar against a basket of major currencies and the uncertainty among analysts about its future direction.
Given the combination of central bank decisions, the U.S. government shutdown, geopolitical risks, and trade tensions, a breakout from this triangle could mark the start of a major trend lasting several weeks or even months.
Yesterday’s Fed decision strengthened the dollar, breaking through a local Bullish Flag pattern (shown in blue) and increasing the likelihood of further upward momentum.
This article represents the opinion of the Companies operating under the FXOpen brand only. It is not to be construed as an offer, solicitation, or recommendation with respect to products and services provided by the Companies operating under the FXOpen brand, nor is it to be considered financial advice.

DOLLAR INDEX (DXY): More Growth Ahead
A quick follow-up for the yesterday's idea for Dollar Index.
The market successfully violated a resistance line of a symmetrical triangle
pattern on a daily time frame.
We see its retest this morning.
A confirmed bullish CHoCH on an hourly time frame gives us a strong
intraday bullish confirmation.
There is a high chance that the Index will continue rising.
Goal - 99.35
❤️Please, support my work with like, thank you!❤️
I am part of Trade Nation's Influencer program and receive a monthly fee for using their TradingView charts in my analysis.

DOLLAR INDEX DXYWHAT IS DXY /DOLLAR INDEX
The Dollar Index (DXY) measures the value of the United States dollar against a weighted basket of six major foreign currencies: the Euro (57.6%), Japanese Yen (13.6%), British Pound (11.9%), Canadian Dollar (9.1%), Swedish Krona (4.2%), and Swiss Franc (3.6%). It is calculated as a weighted geometric mean of these currencies' exchange rates relative to the dollar. The DXY indicates the overall strength or weakness of the US dollar in the global market.
The US 10-Year Treasury Yield (US10Y) represents the return on investment for US government debt maturing in 10 years. It reflects market expectations for interest rates, inflation, and economic growth.
How DXY and US10Y interact:
When US10Y rises, reflecting tighter monetary conditions or inflation concerns, US interest rates become more attractive, which often strengthens the US dollar, leading to a higher DXY.
Conversely, when US10Y falls, lower yields can reduce dollar appeal, causing DXY to weaken.
Movements in DXY and US10Y are intertwined through monetary policy expectations and global capital flows.
For example, a rising US10Y can boost capital inflows into US assets, strengthening the dollar and pushing the DXY higher.
This interplay influences foreign exchange markets, commodity prices, and international investment decisions.
DOLLAR INDEX ON RETEST TO THE 4HR TRENDLINE WILL GO LONG .
TRADE REASON IS ON THE CHART,MARKET KEEPING LONG SENTIMENT AFTER RATE CUT WITH NO HOPE OF CUTTING AGAIN .
The Dollar Index (DXY) paradoxically rose despite the Federal Reserve's rate cut to 3.75%-4.00% on October 29, 2025, due to several nuanced reasons:
Market Expectations vs Reality: The rate cut was widely anticipated and mostly priced in before the announcement. When the Fed delivered the expected 25 basis point cut without signaling more aggressive easing ahead, it reassured markets about the US economic outlook.
Dovish but Cautious Fed Tone: Fed Chair Powell emphasized a cautious approach, highlighting uncertainties but not committing to a rapid series of cuts. This balanced tone supported confidence in the dollar.
Safe-Haven Demand: Global economic uncertainties and geopolitical risks boosted demand for the US dollar as a safe-haven currency, pushing the DXY higher.
Relative Monetary Policy: While the Fed cut rates, other major central banks like the ECB and BOJ remained more dovish or on hold, keeping the dollar relatively attractive.
Technical Buying: The DXY had technical support around current levels, triggering algorithmic and institutional buying on dips.
the DXY's rise reflects that investors viewed the rate cut as a pragmatic, measured step rather than a sign of economic weakness, supporting dollar strength despite the easing.
KEY FUNDAMENTAL REPORT TODAY FROM UNITED STATES .
The Federal Reserve announced a 25 basis point cut to its benchmark federal funds rate on October 29, 2025, lowering the target range to 3.75% - 4.00%. This marks the second consecutive rate reduction this year. The decision was made amid moderate economic expansion, a slowing job market, slightly elevated inflation, and uncertainty caused by limited economic data due to a government shutdown.
The Fed also stated it will end the reduction of its balance sheet assets (quantitative tightening) on December 1, 2025. The committee emphasized attentiveness to the evolving economic outlook, risks to employment and inflation, and readiness to adjust policy accordingly. The vote was 10-2, with some dissent for either deeper cuts or no cuts at all.
This rate cut supports easing financial conditions to aid maximum employment and returning inflation to the 2% long-run goal.
Federal Reserve Chair Jerome Powell delivered speech.
Key points from his speech:
The Fed remains focused on achieving maximum employment and stable prices.
Despite some disruption from a partial government shutdown delaying some economic data, available information indicates little change in employment and inflation outlooks since the September meeting.
Labor market conditions appear to be gradually cooling, with inflation still somewhat elevated.
The rate cut was aimed at supporting these goals given the balance of risks to employment and inflation.
The Fed will end the reduction of its asset holdings (quantitative tightening) on December 1.
Powell emphasized a balanced approach between supporting growth and controlling inflation, noting the policy is not on a preset course.
Future rate moves remain data-dependent; a December rate cut is not guaranteed.
He acknowledged the challenges and trade-offs in monetary policy decision-making, especially under uncertainty from recent disruptions.
Overall, Powell’s speech conveyed cautious optimism combined with a pragmatic acknowledgement of incoming risks and uncertainty, signaling readiness to adjust policy to evolving economic conditions.
NOTE ;TRADING IS 100% PROBABILITY.
RISK MANAGEMENT IS KEY
ANY KEY LEVEL CAN FAIL.
#GOLD #US10Y #DOLLAR

US Dollar Index Tests Range Resistance as Momentum Firm Post-FedThe U.S. Dollar Index (DXY) continues to trade within a well-defined horizontal range, bounded by resistance near 100.30 and support around 96.42. Price is currently hovering near the upper half of this range, suggesting renewed bullish momentum in the short term.
The 50-day SMA (98.17) is trending upward and recently acted as dynamic support, while the 200-day SMA (100.53) remains above price, serving as a longer-term resistance barrier. A sustained move above the 100.30 zone would be required to shift the broader structure toward a more constructive outlook.
The MACD shows a mild bullish crossover above the signal line, indicating strengthening momentum, while the RSI (61) remains in neutral-to-bullish territory — suggesting there is room for further upside before overbought conditions emerge.
Overall, the index remains range-bound but shows short-term bullish undertones as it approaches key resistance. Traders may watch for price action confirmation near the upper boundary to gauge the next directional move.
– MW
