Roadmaps for $20000 Gold and $800 Silver.Roadmaps for $20000 Gold and $800 Silver.
HUGE reaction on that possible 45 year breakdown line for stocks vs silver.
If we get a bounce in Q2, it will OFFICIALLY morph into existence, making it a CRITICAL & VALID line.
BIG moves for Gold, Silver, Oil and friends below that.
Related indices

US30 Consolidation Growth momentumUS30 trading within a well-defined ascending channel, confirming a medium-term bullish trend. Price has consistently respected both the upper resistance and lower support boundaries of the channel, indicating strong trend structure and controlled momentum.
Recently, price produced a strong impulsiv

DOW JONES giving a strong Sell Signal at the top.Dow Jones (DJI) has been consolidating for exactly the past 1 month, ranging within Resistance 1 and the Support Zone, with the current rebound coming off its 1D MA50 (grey trend-line) as well.
The 4H RSI is testing its Lower Highs trend-line and every time the index touched it, we had a strong Sel

DOW JONES 9-month Channel Up is still holding.Dow Jones (DJI) has been trading within a 9-month Channel Up and is currently on its latest Bullish Leg following a 1D MA50 (blue trend-line) bounce. The last two Bullish Legs peaked just below the -0.382 Fibonacci extension. The strongest Sell Signal was given however by the 1D RSI when it hit its

Potential Massive Fibonacci Time Cycle TurnToday 02/09/26 the Dow Jones Industrial Average (DJI) made a new all-time high unconfirmed by the Dow Transportation Average, S&P 500, and Nasdaq Composite.
This high comes at the end point of a massive Fibonacci time cycles covering 97 – years.
The starting point is the DJI mania peak made in 19

1h TF - Long on Dow Jones Industrial Average Index (Ticker DJI)TVC:DJI
Technicals:
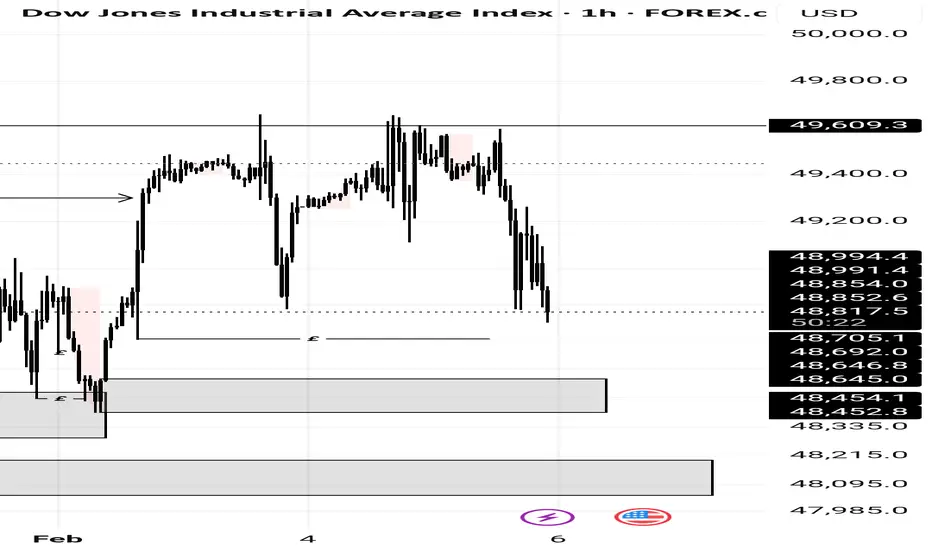
Having the price consolidated between 48800 and 49600 during January, trade picture strongly depend on market sentiment and event occurence.
- Short-term Long scenario:
In case price decides to move above 49600 a descent amount of stop-losses will be collected, pushing

US30 Market Correction SetupPrice strong resistance zone (50000–51500)
This is my personal technical analysis based on fibonachi.
Trade with proper risk management.
S.K.G Market Prediction

#US30 Buy Trade Scenario.Here’s an up-to-date #US30 Buy trade outlook (technical + fundamental) to help you assess whether positioning for a Upside makes sense right now.
Thank You......

Expected retracement US30Looking at the chart, the Dow Jones is currently sitting right inside a consolidation zone around 50,247, where price is hesitating between buyers and sellers. This grey box i drew marks resistance, showing the market is undecided at this level. My expectation seems to be that price won’t immediatel

US30The market has respected and followed a series of demands leading to buys. Swept an equal high and is heading down now for a more buy in the line of the previous buys. Tho there rest a demand below have 3 zones of equal lows which if the most current demand fails, it will head for the demand below
See all ideas
Displays a symbol's value movements over previous years to identify recurring trends.
Frequently Asked Questions
Dow Jones Industrial Average Index reached its highest quote on Jan 13, 2026 — 49,686.0 USD. See more data on the Dow Jones Industrial Average Index chart.
The lowest ever quote of Dow Jones Industrial Average Index is 18,212.0 USD. It was reached on Mar 23, 2020. See more data on the Dow Jones Industrial Average Index chart.
Dow Jones Industrial Average Index is just a number that lets you track performance of the instruments comprising the index, so you can't invest in it directly. But you can buy Dow Jones Industrial Average Index futures or funds or invest in its components.