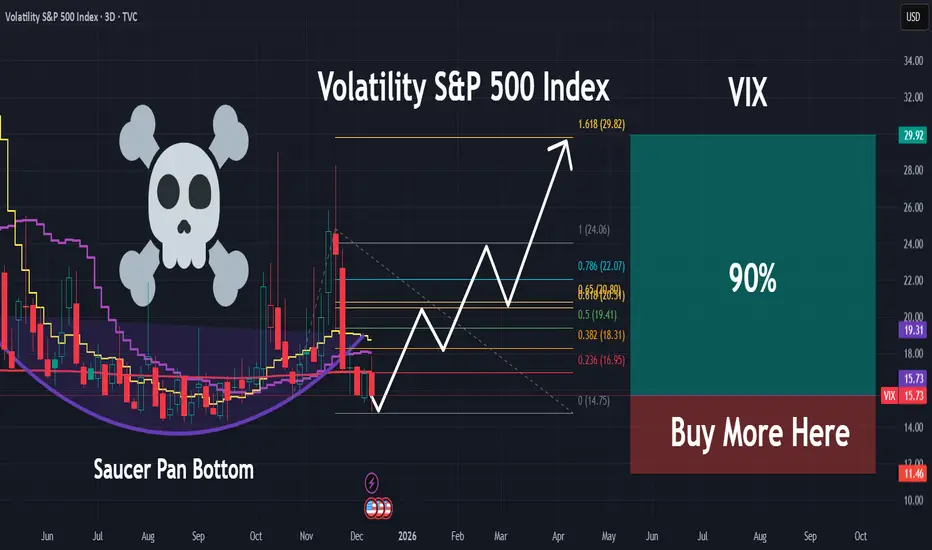
VIX | Major Volatility and Market Correction Incoming | LONGThe VIX Index, formally known as the Cboe Volatility Index, is a real-time market index that represents the market's expectation of 30-day forward-looking volatility for the S&P 500 index. It is widely known as the "fear gauge" because it tends to rise sharply during periods of increased investor fe
About Volatility Index
VIX is a trademarked ticker symbol for the CBOE Volatility Index, a popular measure of the implied volatility of S&P 500 index options; the VIX is calculated by the Chicago Board Options Exchange (CBOE). Often referred to as the fear index or the fear gauge, the VIX represents one measure of the market's expectation of stock market volatility over the next 30-day period.
Related indices
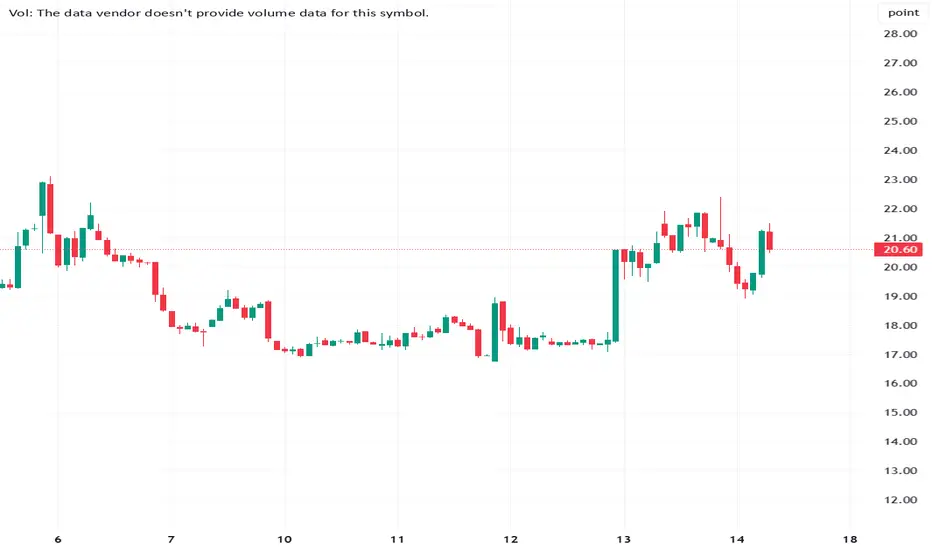
Huge VIX spike is imminent One of the best indicator to predict the VIX is 7 and 12 MA crossings. This crossing happens daily, hourly etc. All are reflecting a reliable movement on SPY and VIX.
However, when this happens on weekly chart, it's a different story. Expect at least 30%+ spike.

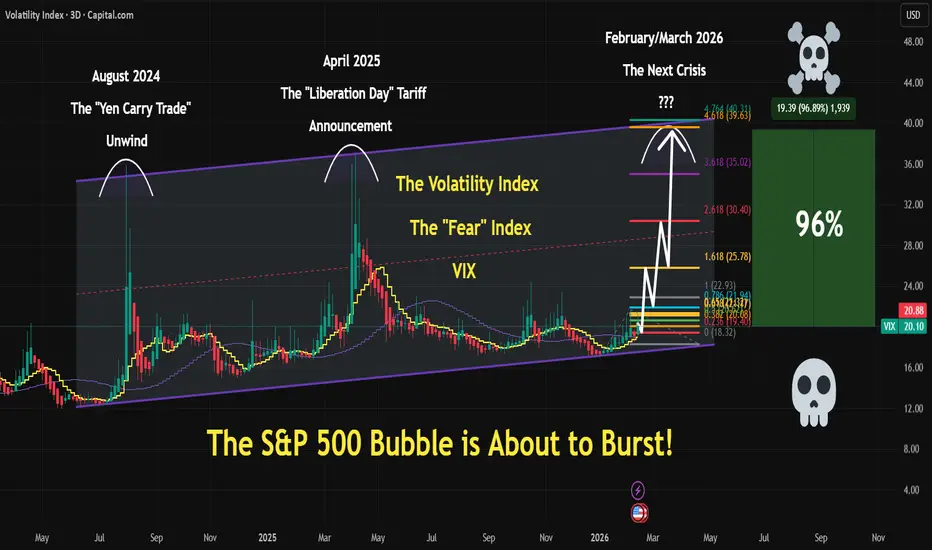
VIX | S&P500 Is About To TANK | LONG VIX | SHORT SPYSince we are currently in mid-February 2026, the specific "crisis" label is still being debated by historians and market analysts, but several distinct names have already emerged in the headlines. Depending on whether you're following the diplomatic friction, the domestic policy shifts, or the liter
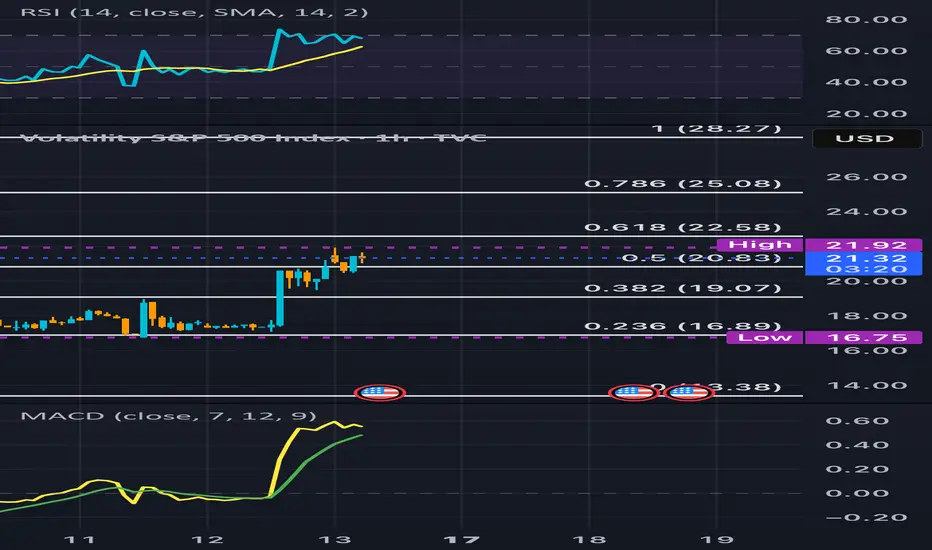
Consolidating and going higherVix broke the hard level at 0.50 fibonacci, ready to test next levels. TP 27/28 area
Lot of call options at 25 have been bought yesterday
VIX: EMA 10:1 Bullish Trend vs Candles 4:10 Bearish VIX: EMA 10:1 Bullish Trend vs Candles 4:10 Bearish — The Fear Index Is Fighting Itself
Overview
VIX at 20.60 is presenting a mirror-image divergence that rarely appears this cleanly. The EMA alignment reads 10:1 bullish — near-total trend dominance across every timeframe. But the candlestick struc
QS V4 Elite: Institutional Positioning Signals VIX Reversion⚡ QS V4 ELITE — VIX Weekly Volatility Setup
Trade Thesis
Despite strong equities, the VIX is refusing to compress further — often an early signal that smart money is positioning for turbulence.
Direction: CALLS (Speculative)
Conviction: Low–Moderate
Alpha Score: 62
Time Horizon: Weekly
👉 This

VIX short-term TASince the beginning of February the VIX has started an uptrend again, you should be cautious of market volatility in the upcoming days.

Volatility Regime Shift Watch: VIX Bias Turns Bullish🚀 QuantSignals Katy AI Stock Analysis
Analyzed 1 stock(s): VIX
📈 VIX Analysis
Current Price: $20.92
Final Prediction: $21.23 (+1.46%)
30min Target: $20.62 (-1.41%)
Trend: BULLISH
Confidence: 54.7%
Volatility: 92.1%
Summary: Generated 0 trade signals from 1 successful analyses out of 1 symbols.


Are we about to see a massive vix spike? $100?I'm not sure what the cause will be here, but it looks like we're on the verge of a massive vix spike. I can imagine that the selloff will look like a combination between the 1987 1 day crash and the covid selloff.
I think we're about to see a 20%+ correction that happens very quickly which I think

See all ideas
Displays a symbol's value movements over previous years to identify recurring trends.
Frequently Asked Questions
Volatility Index reached its highest quote on Mar 18, 2020 — 99.95 USD. See more data on the Volatility Index chart.
The lowest ever quote of Volatility Index is 8.92 USD. It was reached on Jan 4, 2018. See more data on the Volatility Index chart.
Volatility Index is just a number that lets you track performance of the instruments comprising the index, so you can't invest in it directly. But you can buy Volatility Index futures or funds or invest in its components.